©The Author(s) 2024.
World J Radiol. Oct 28, 2024; 16(10): 497-511
Published online Oct 28, 2024. doi: 10.4329/wjr.v16.i10.497
Published online Oct 28, 2024. doi: 10.4329/wjr.v16.i10.497
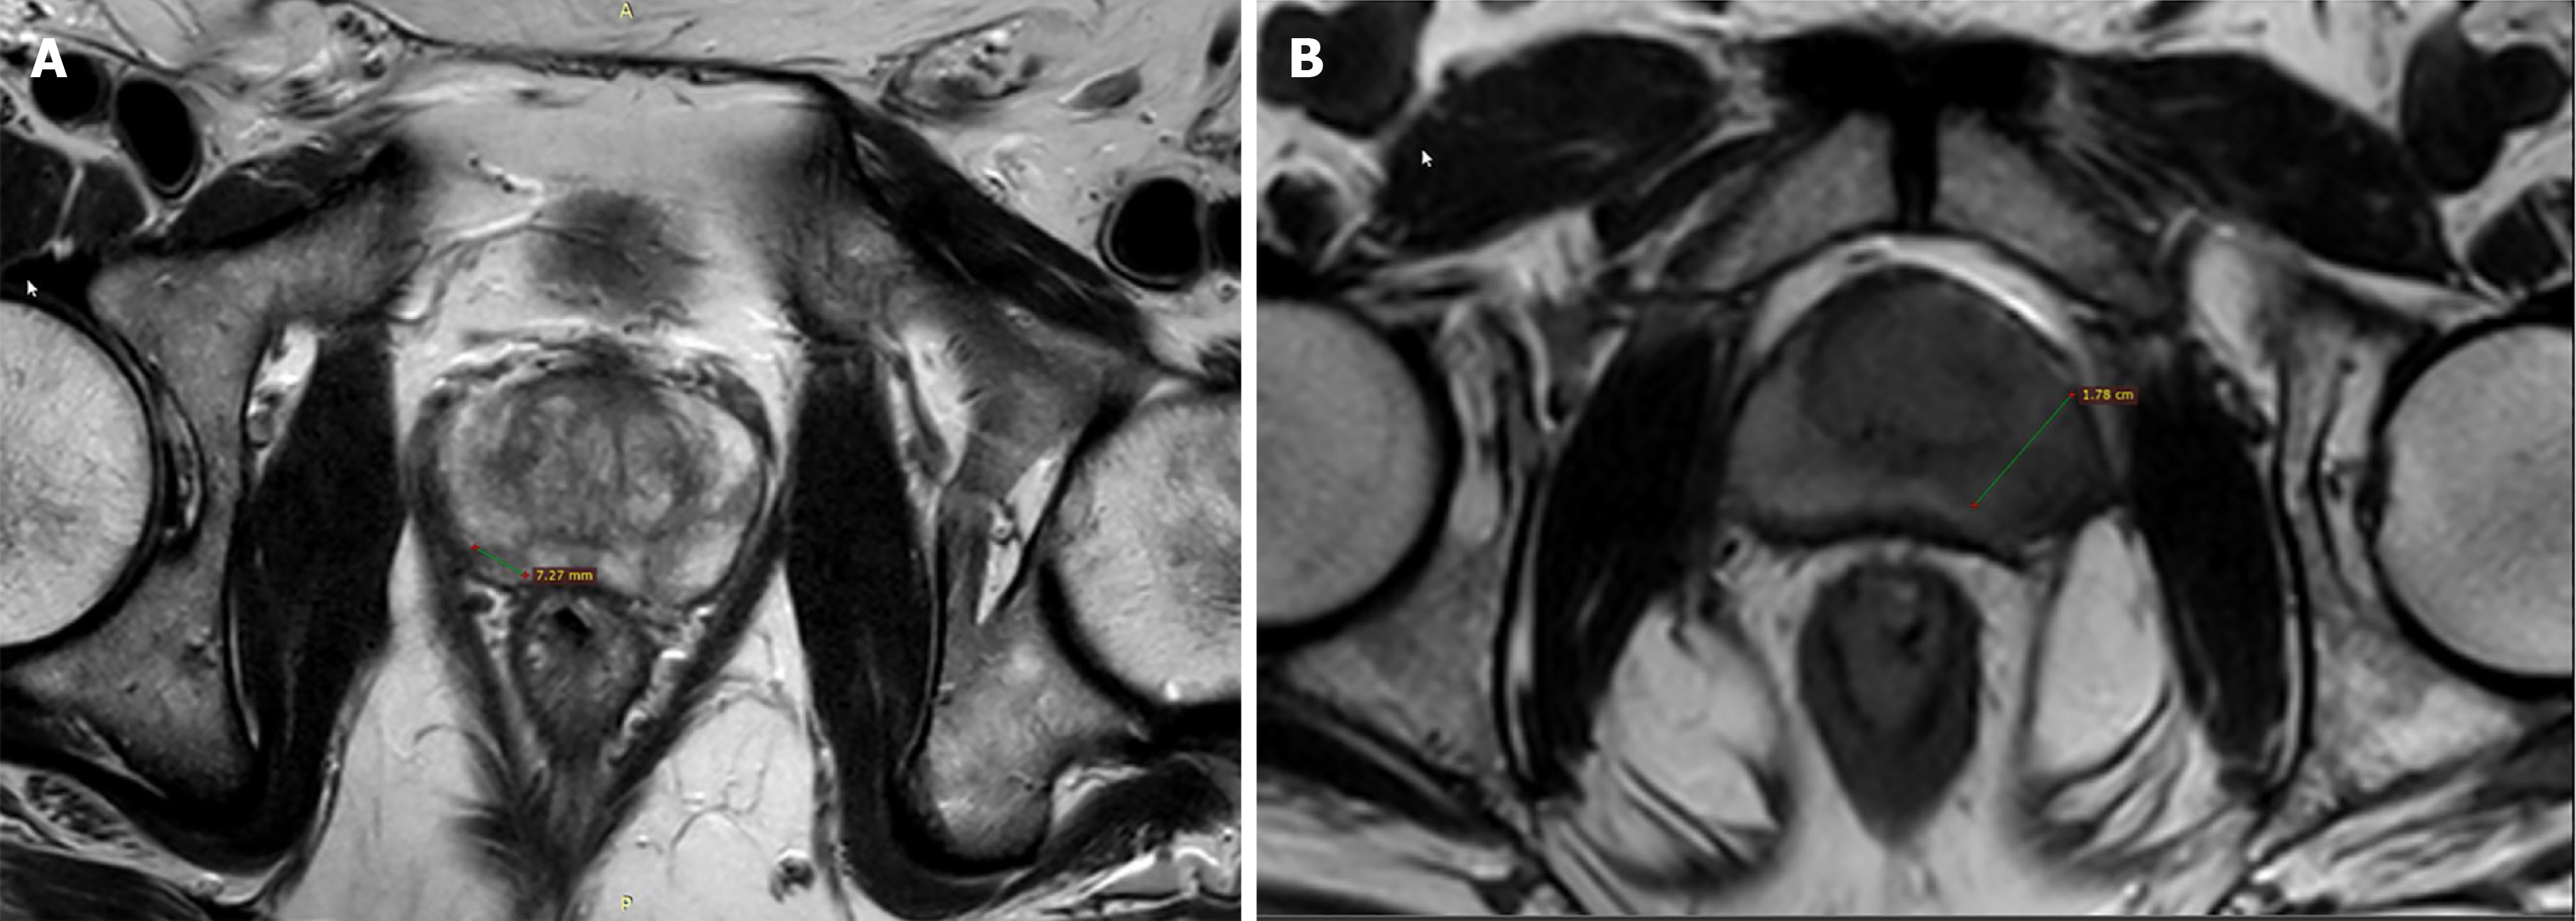
Figure 1 PIRADS 4 vs PIRADS 5 lesions on basis of size: T2 weighted axial image.
A: A right peripheral zone ill-defined hypointense lesion measuring 727 mm suggestive of PIRADS 4 lesion; B: T2 weighted axial image showing a left peripheral zone ill-defined hypointense lesion measuring 17 cm suggestive of PIRADS 5 lesion.
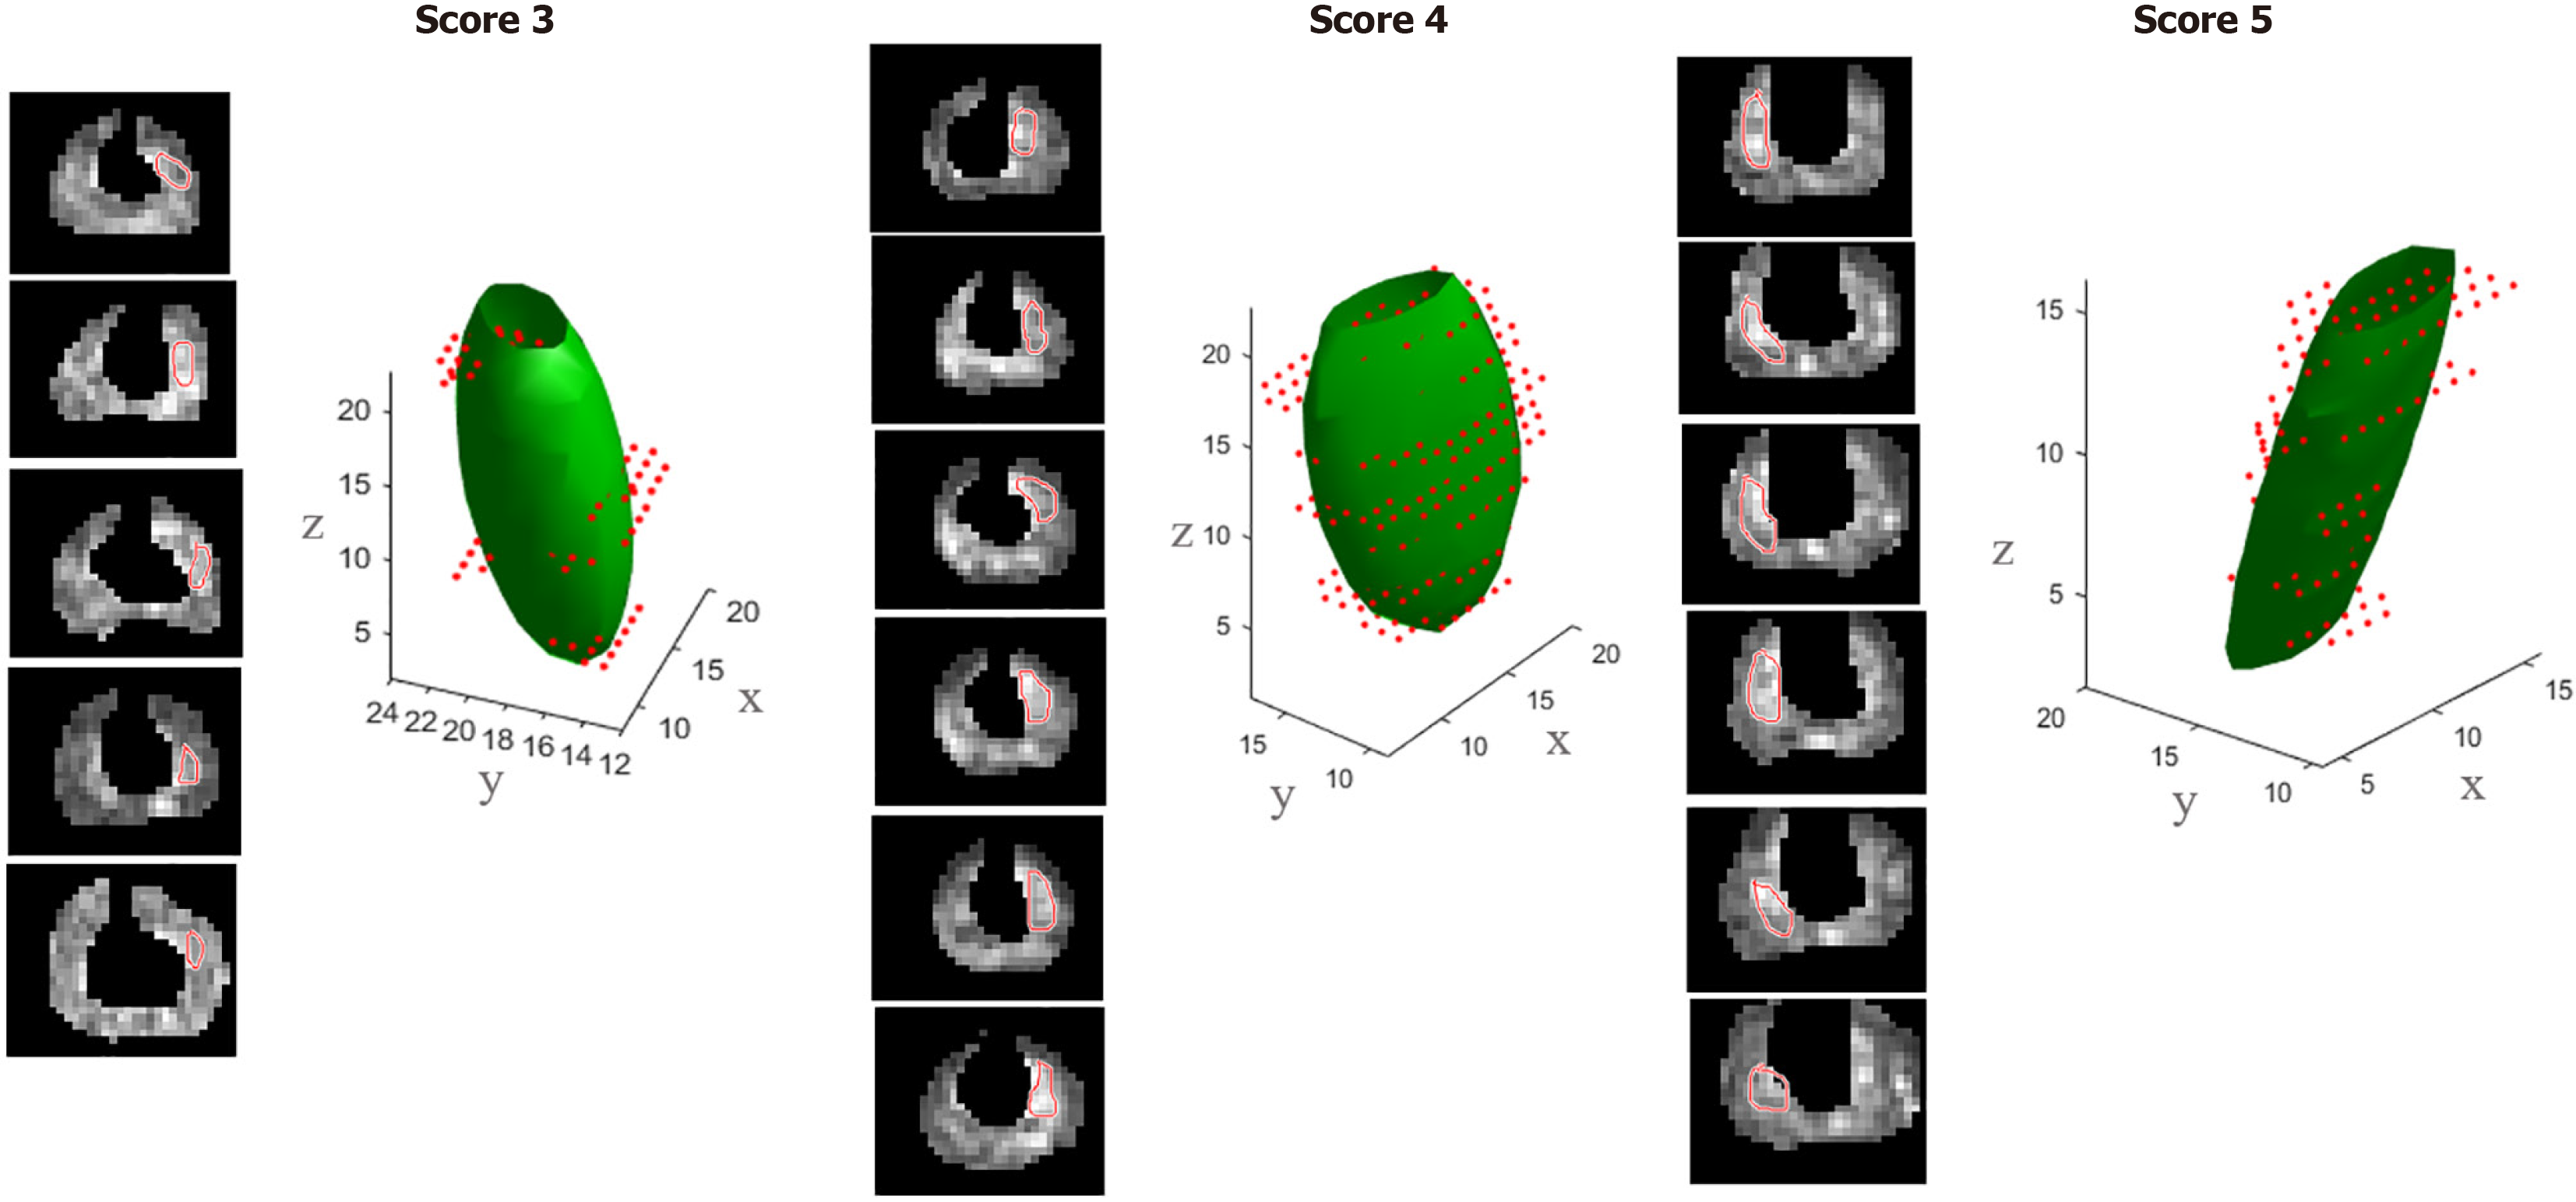
Figure 2 Three-dimensional ellipsoid fit: Three-dimensional fitting of the segmented lesions from.
Diffusion-weighted magnetic resonance images (b = 2000 s/mm2) for different PI-RADS scores.
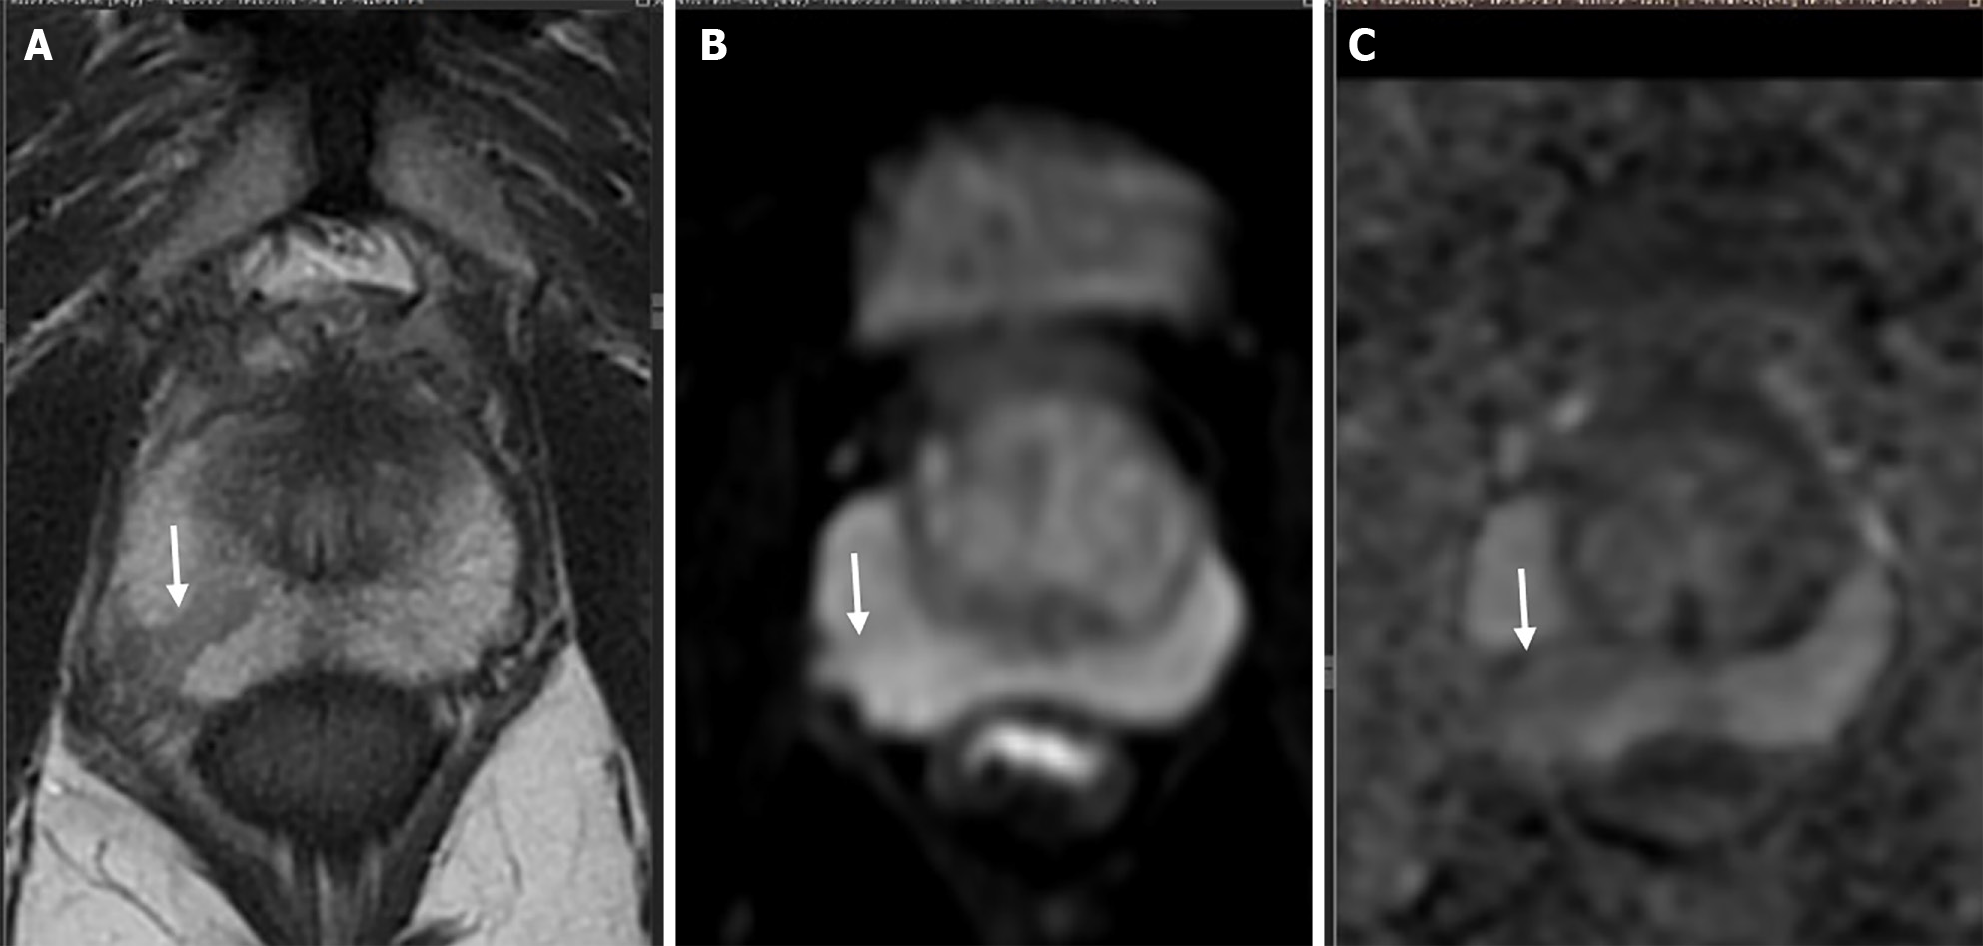
Figure 3 Shape analysis.
A-C: T2-weighted axial image shows a wedge-shaped T2 hypointense lesion (arrow in A) in right peripheral zone which shows no diffusion restriction (arrow in B and C) is scored as a category 2 observation according to PIRADS v.2.1.
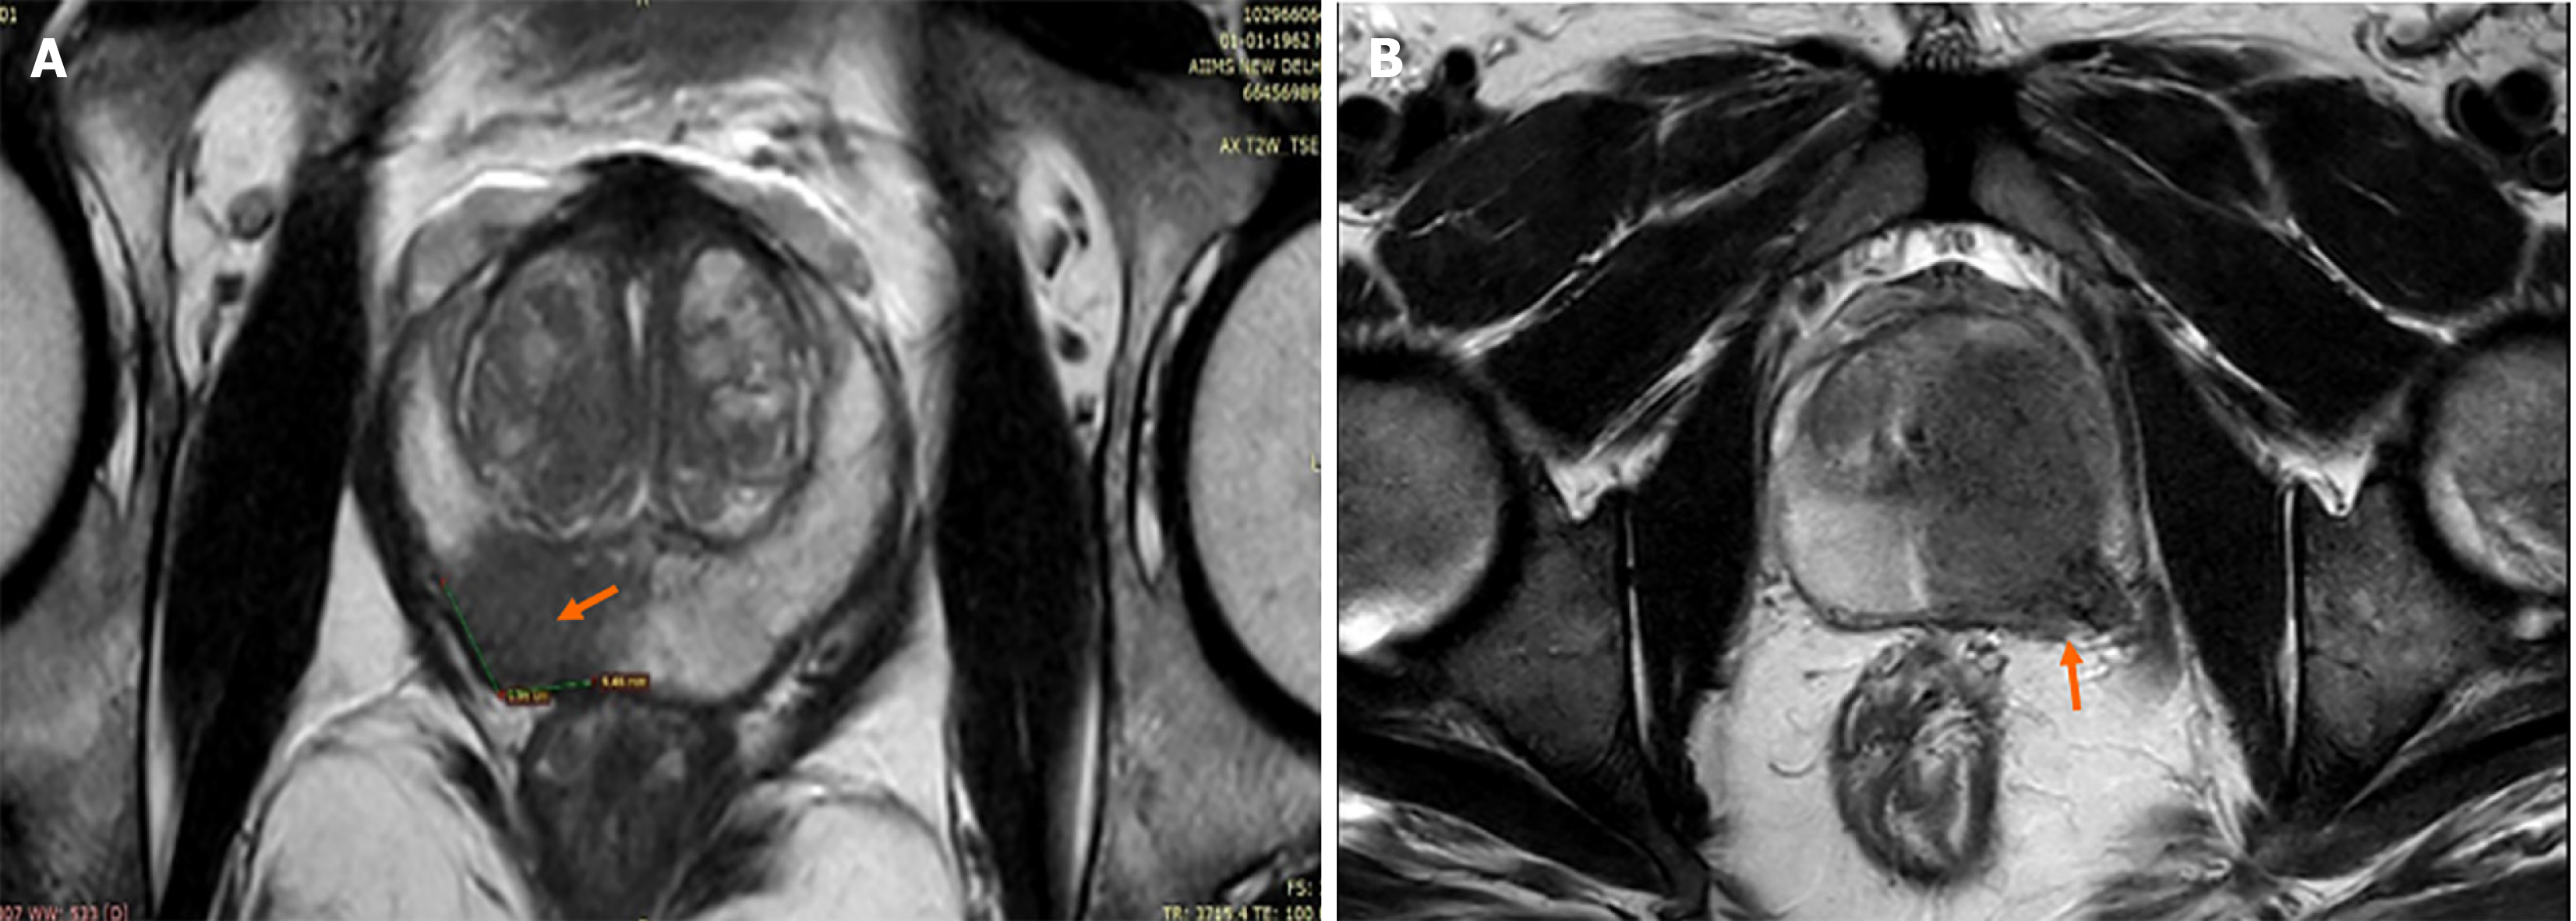
Figure 4 Length of capsular contact.
A: T2-weighted axial image shows T2 hypointense lesion in right peripheral zone having wide contact (9.6 mm) with the capsule i.e., wider length of capsular contact suggesting the possibility of microscopic capsular invasion which was confirmed on histopathology along with its high grade (Gleason score 4 + 5); B: T2-weighted axial image in another case shows T2 hypointense lesion in left transitional and peripheral zone having wide contact with capsule i.e., wider length of capsular contact with adjacent neurovascular invasion (arrow).
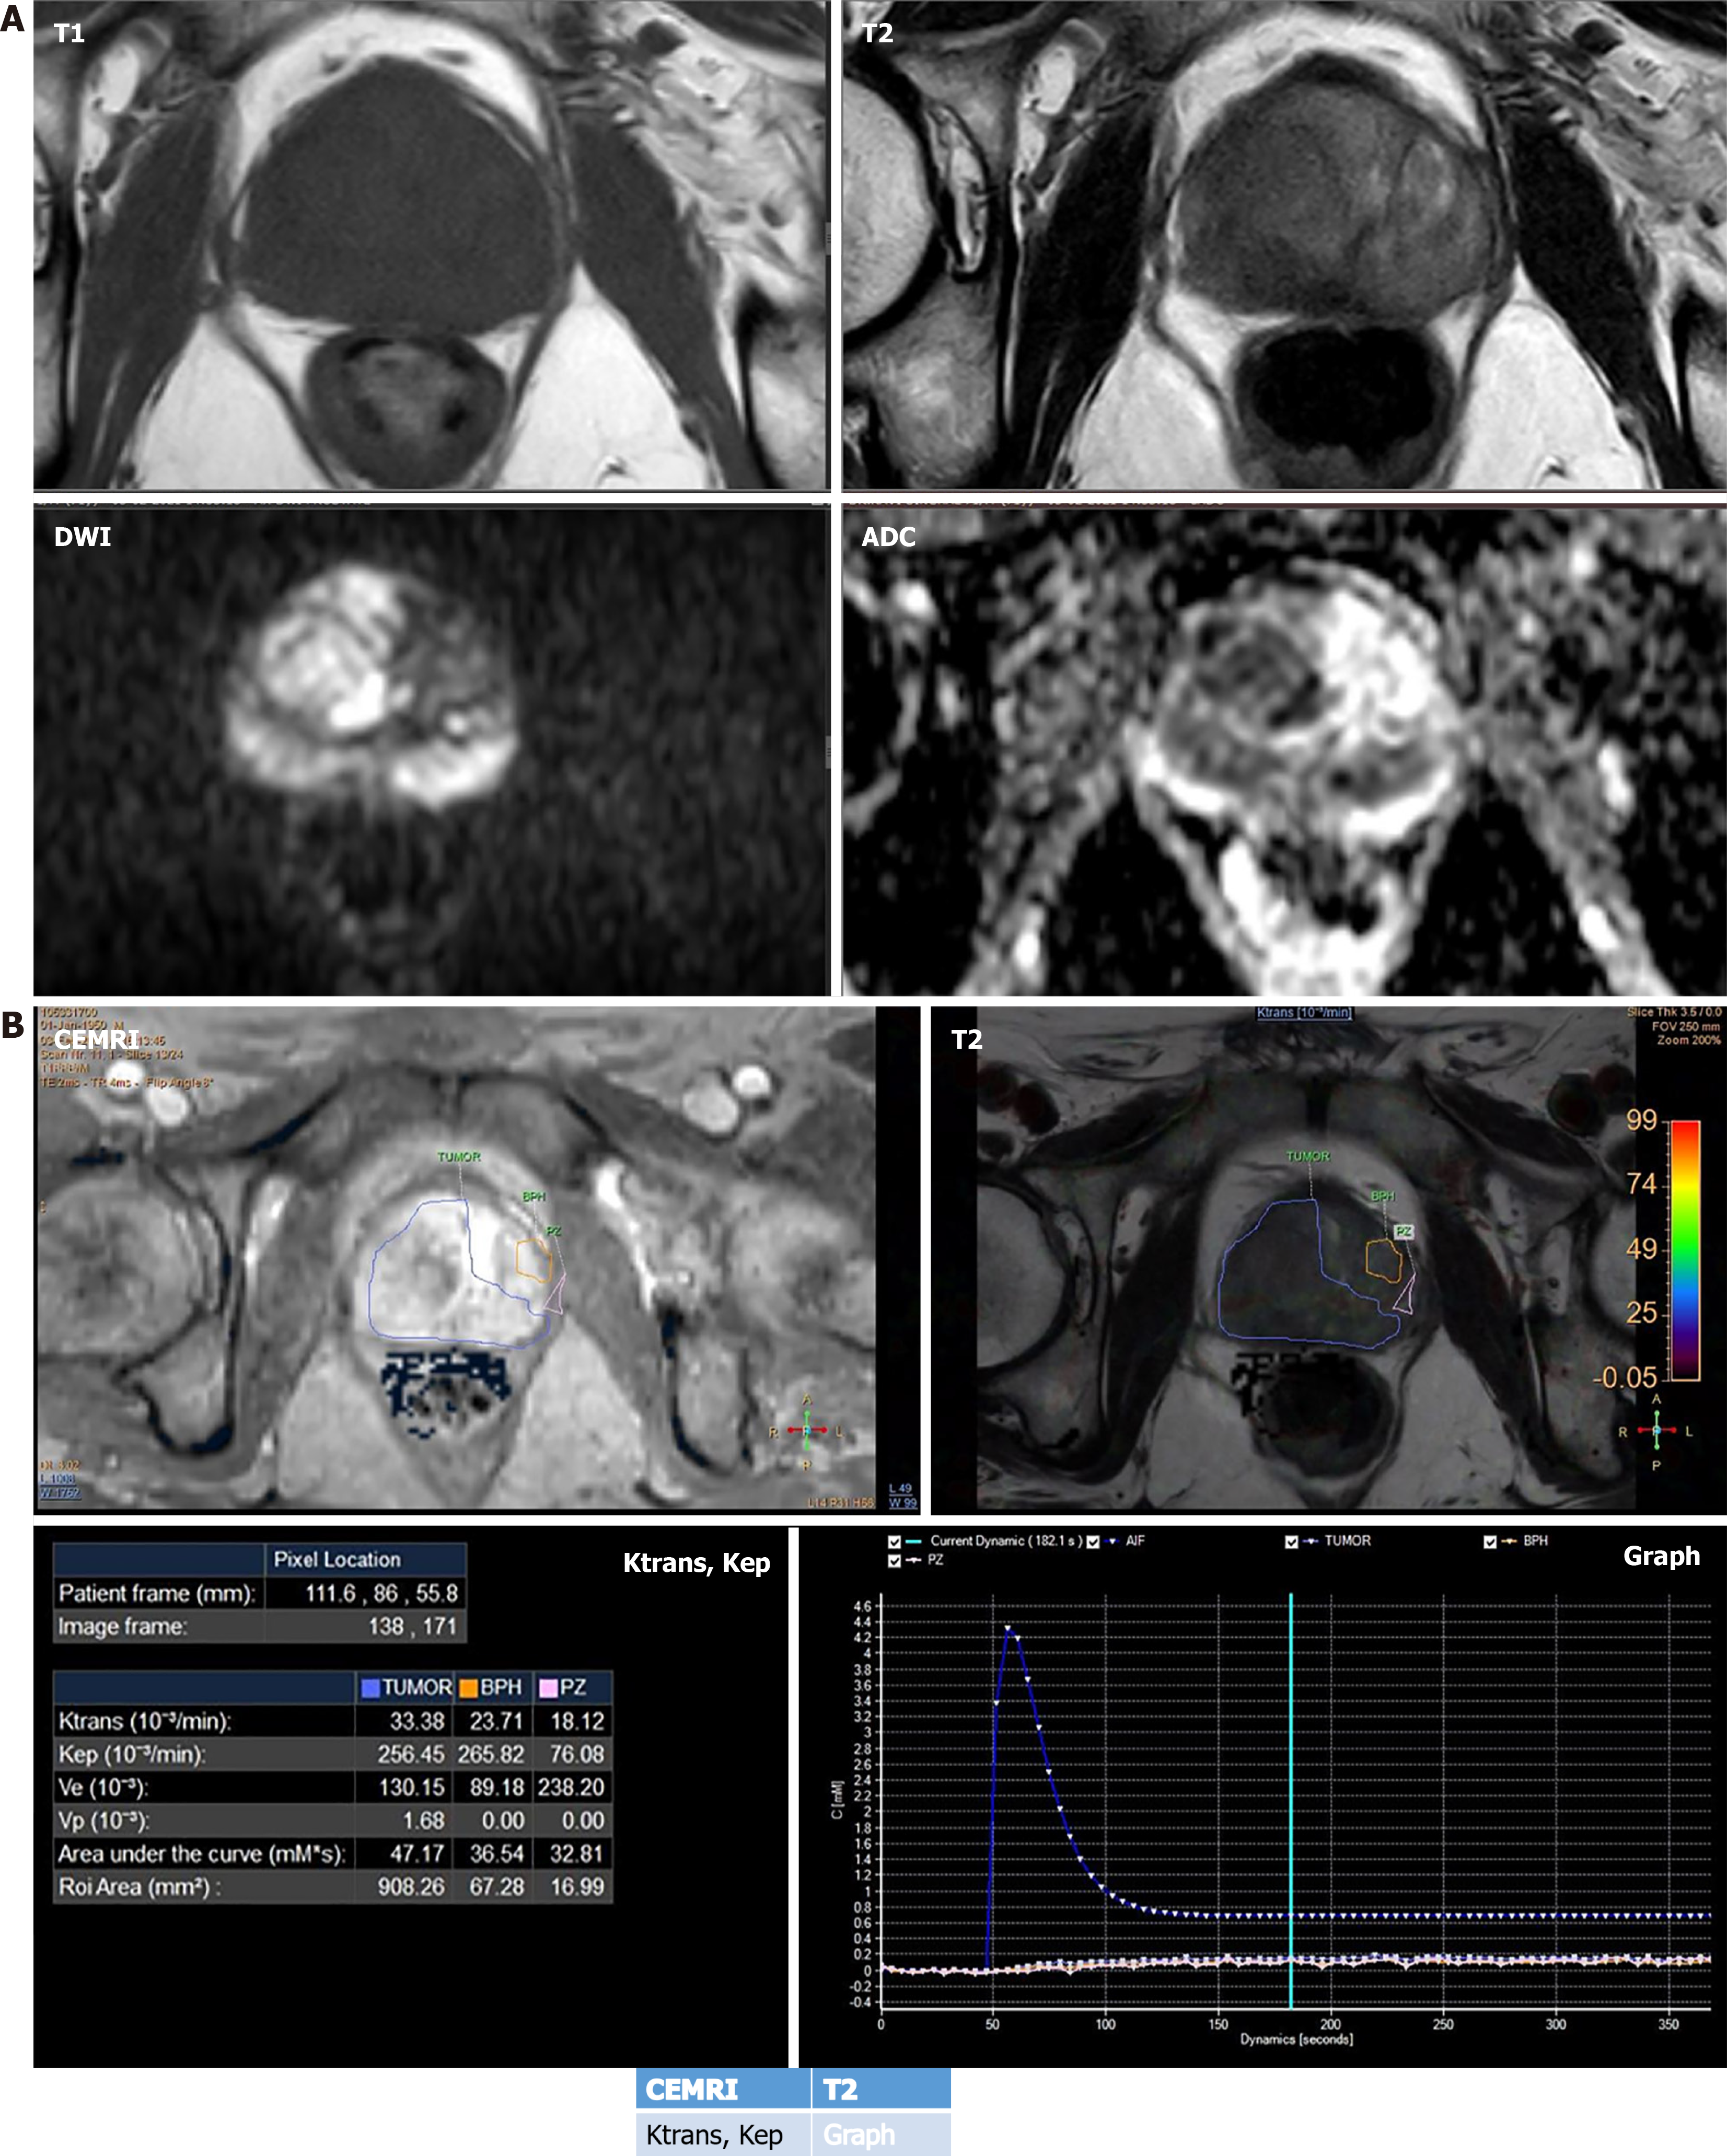
Figure 5 Dynamic contrast-enhanced magnetic resonance imaging based parameters.
A: Multiphasic magnetic resonance imaging images show PIRAD 5 lesion in right transitional zone, peripheral zone and left peripheral zone (asterisk); B: Dynamic contrast-enhanced magnetic resonance imaging images show various quantitative parameters. Region of interest has been drawn depicting prostatic cancer and benign prostatic hyperplasia (BPH) nodule. The table in B demonstrates higher Ktrans and Ve value in the prostatic cancer region as compared to BPH nodule. While Kep value is lower in the prostatic cancer region as compared to BPH nodule. The qualitative signal intensity curve in B demonstrates rapid wash in (steeper slope) and fast wash out in prostatic cancer region which is the characteristic curve for malignant tumors.
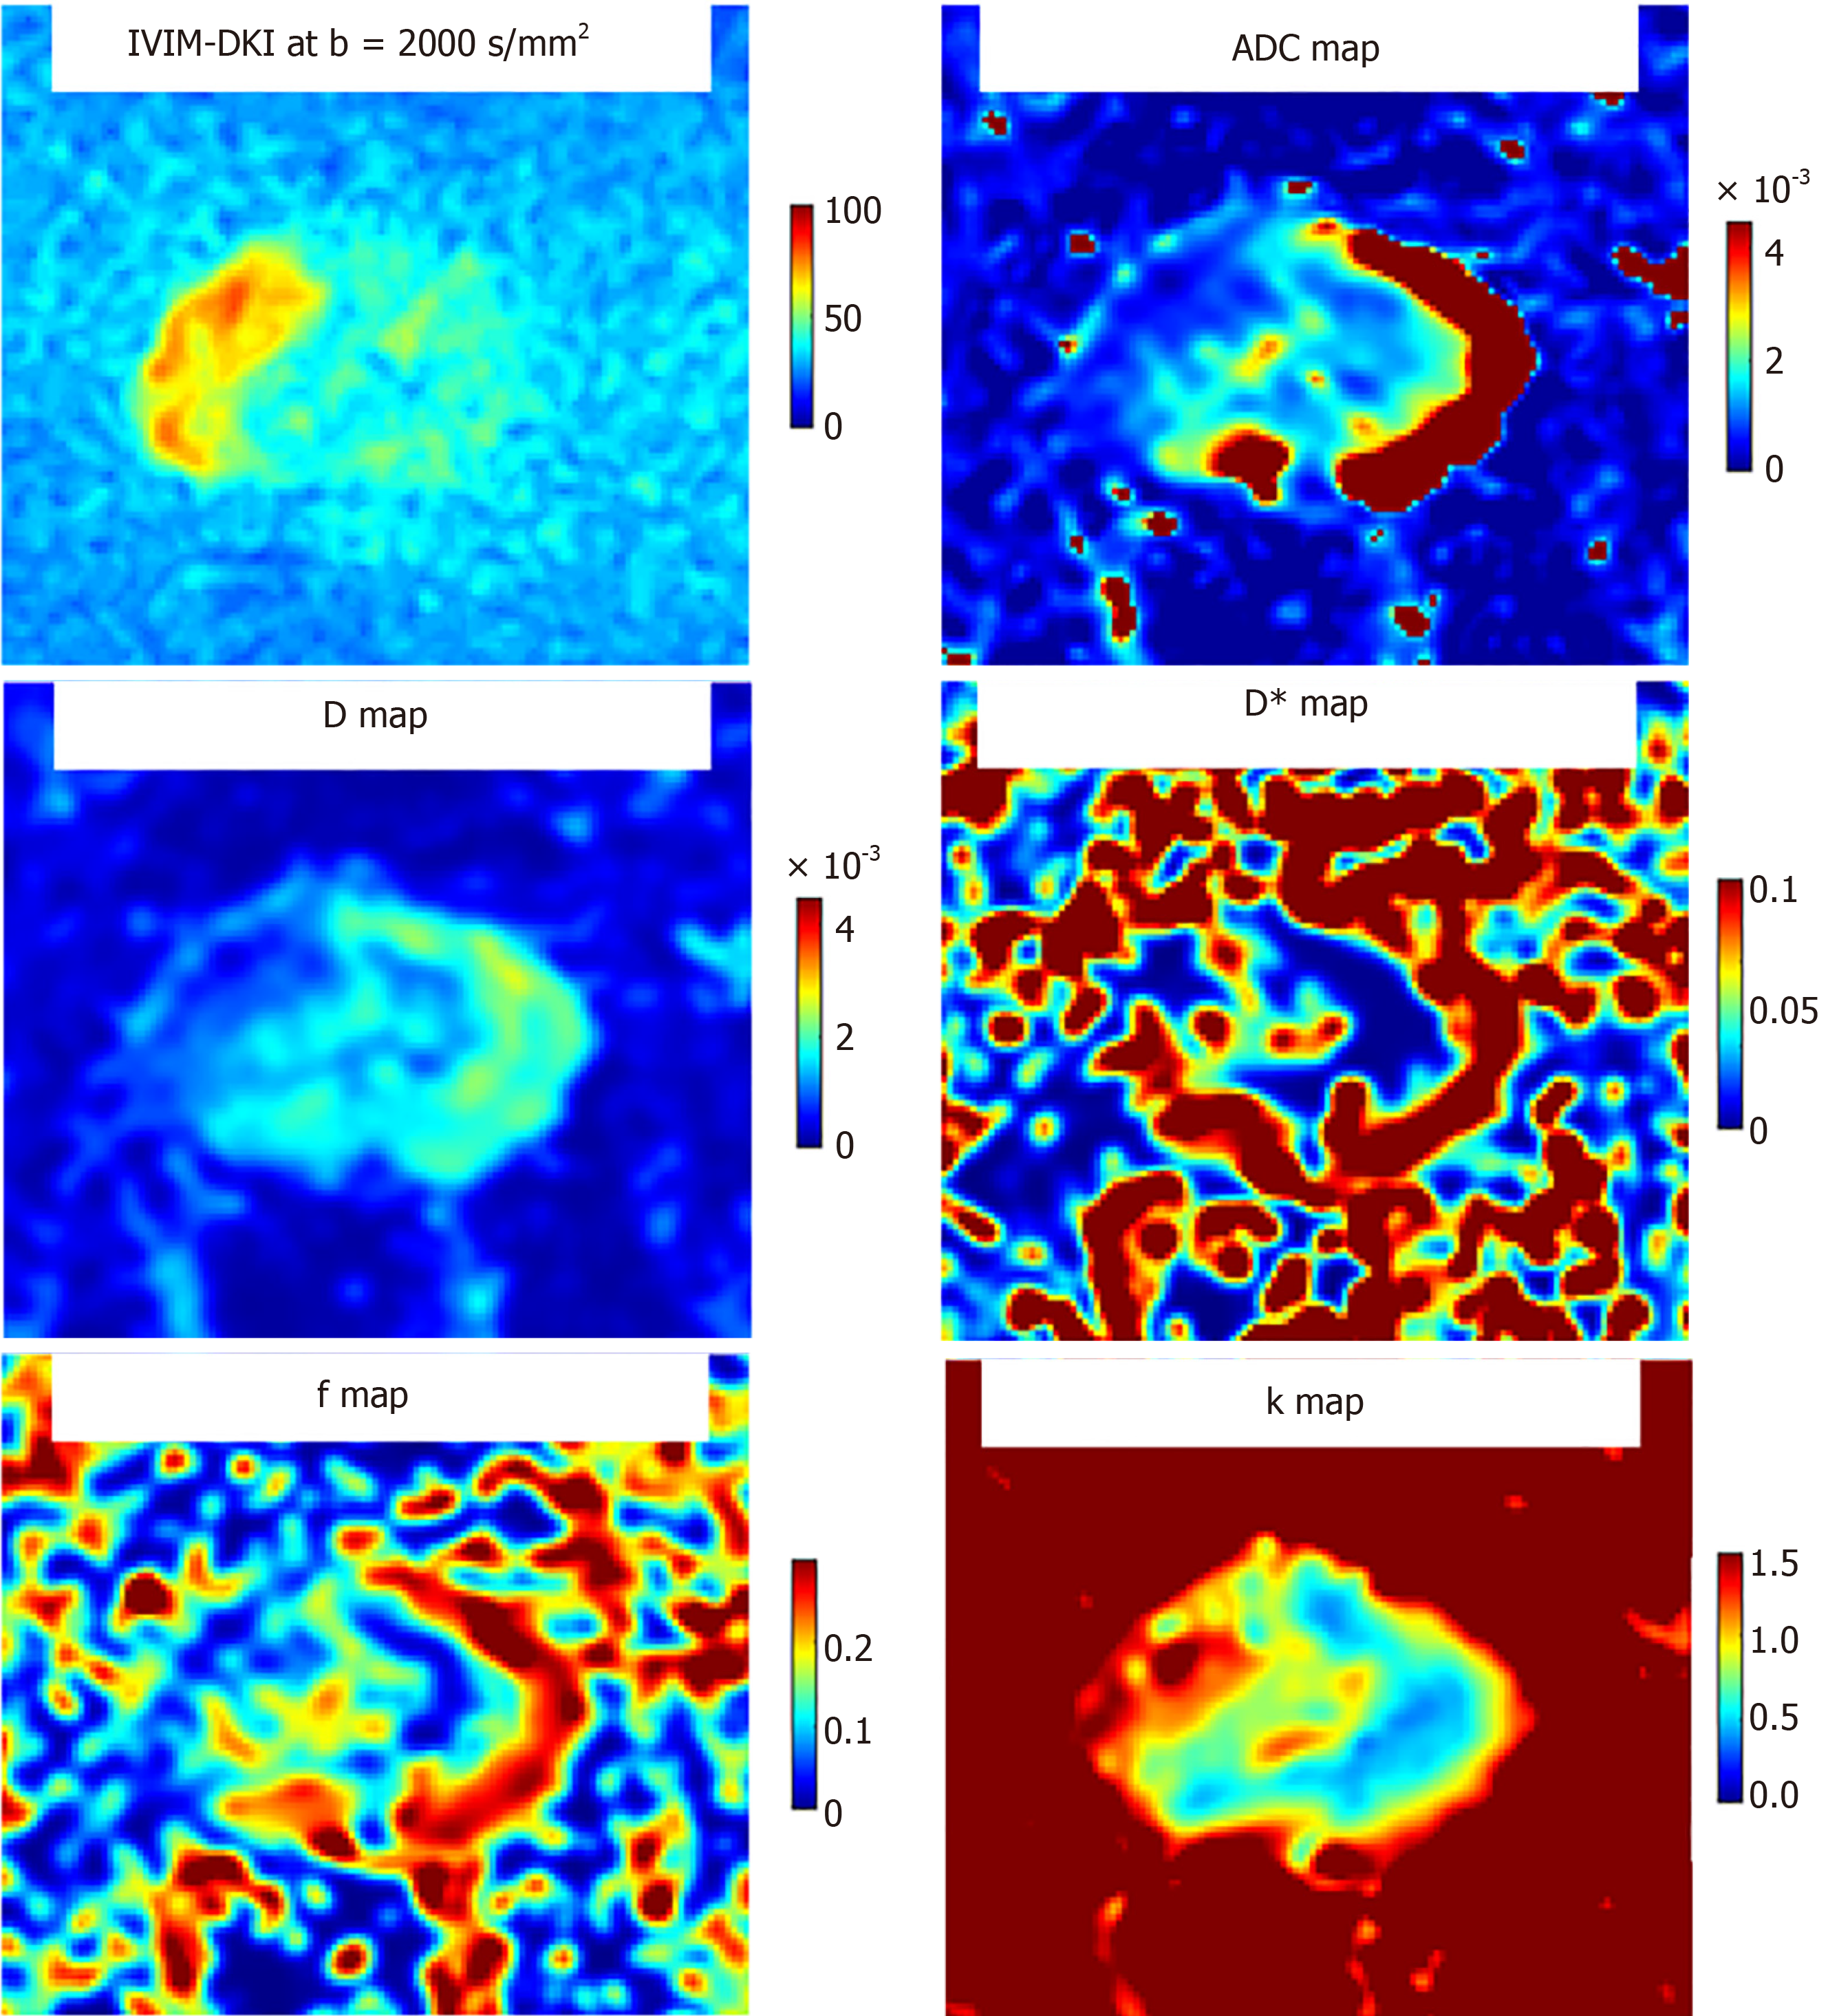
Figure 6 Intravoxel incoherent motion: Intravoxel incoherent motion-diffusion kurtosis imaging at b value 2000 second/mm2 showing apparent diffusion coefficient map, D map, D* map, f map and k map.
The prostatic cancer region is hyperintense in the background of hypointense gland on b 2000 second/mm2 image and hypointense on apparent diffusion coefficient image.
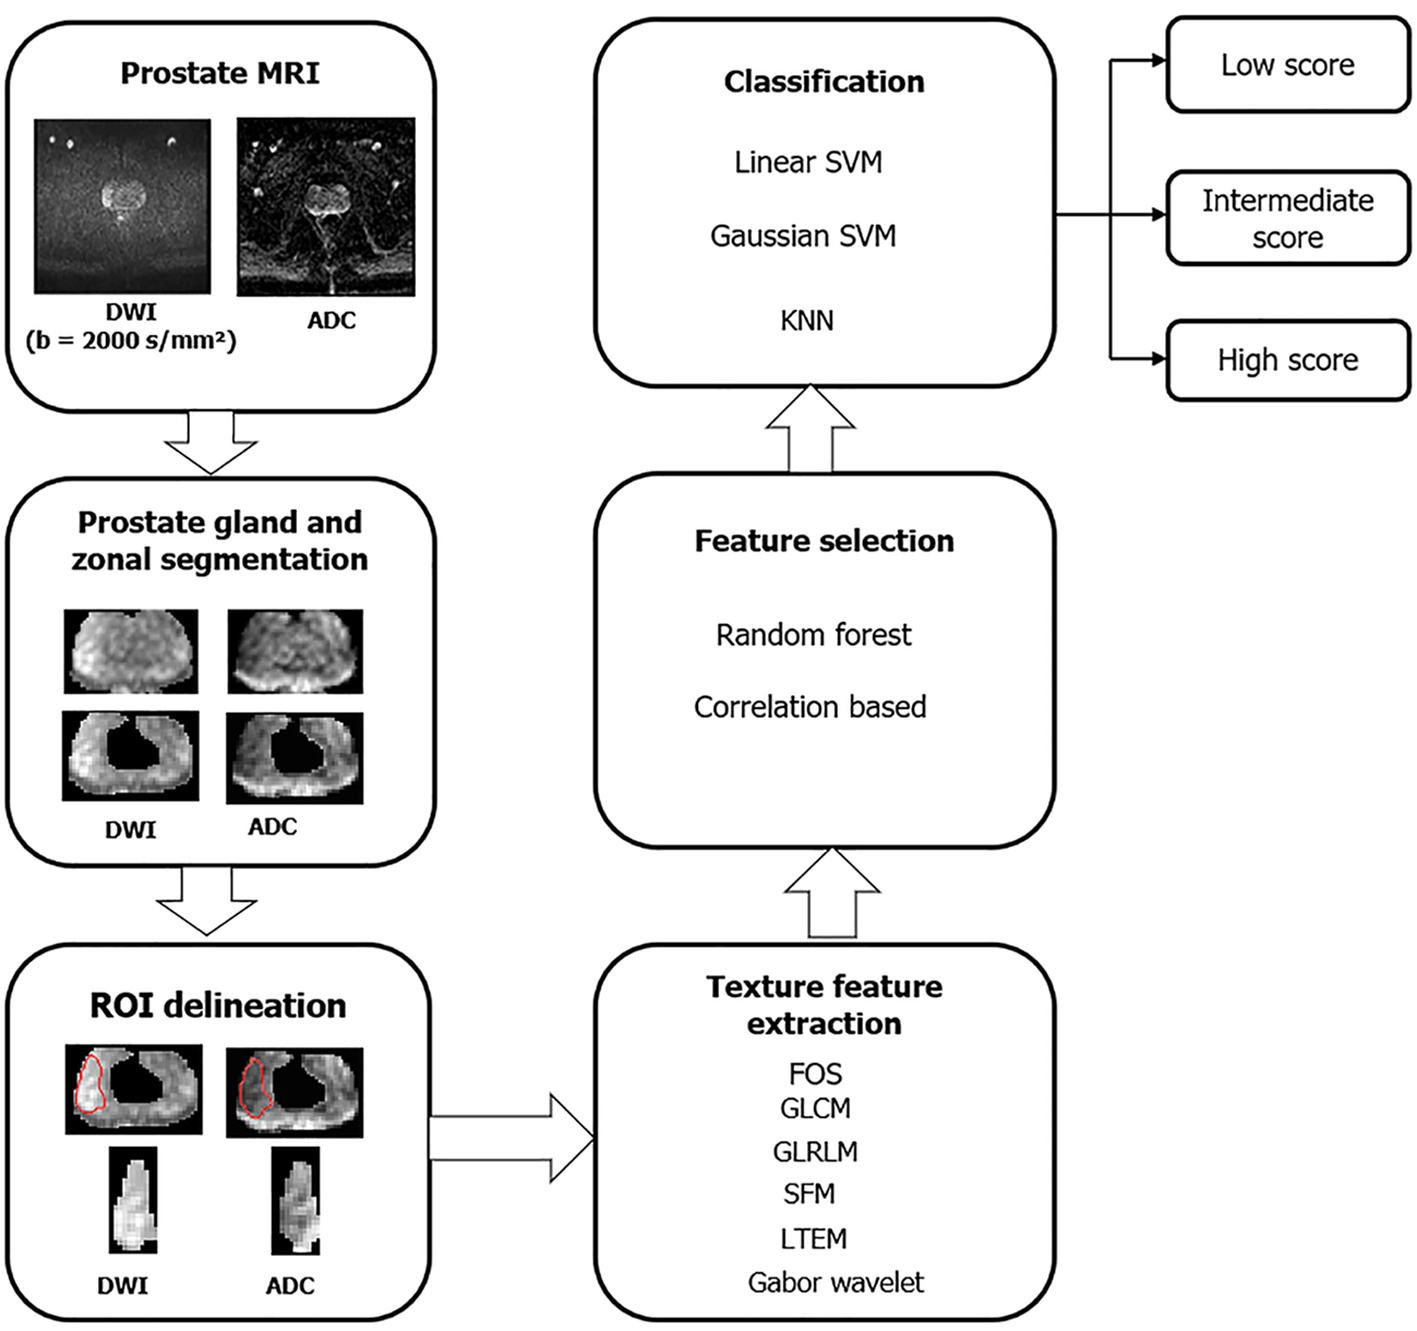
Figure 7 Overview of the framework for texture analysis.
MRI: Magnetic resonance imaging; ADC: Apparent diffusion coefficient; DWI: Diffusion-weighted imaging; FOS: First-order statistics; GLCM: Grey level co-occurrence matrix; GLRLM: Grey level run length matrix; KNN: K-nearest neighbor; LTEM: Laws texture energy measures; ROI: Region of interest; SFM: Statistical feature matrix; SVM: Support vector machine.
- Citation: Dhiman A, Kumar V, Das CJ. Quantitative magnetic resonance imaging in prostate cancer: A review of current technology. World J Radiol 2024; 16(10): 497-511
- URL: https://www.wjgnet.com/1949-8470/full/v16/i10/497.htm
- DOI: https://dx.doi.org/10.4329/wjr.v16.i10.497


