Copyright
©The Author(s) 2024.
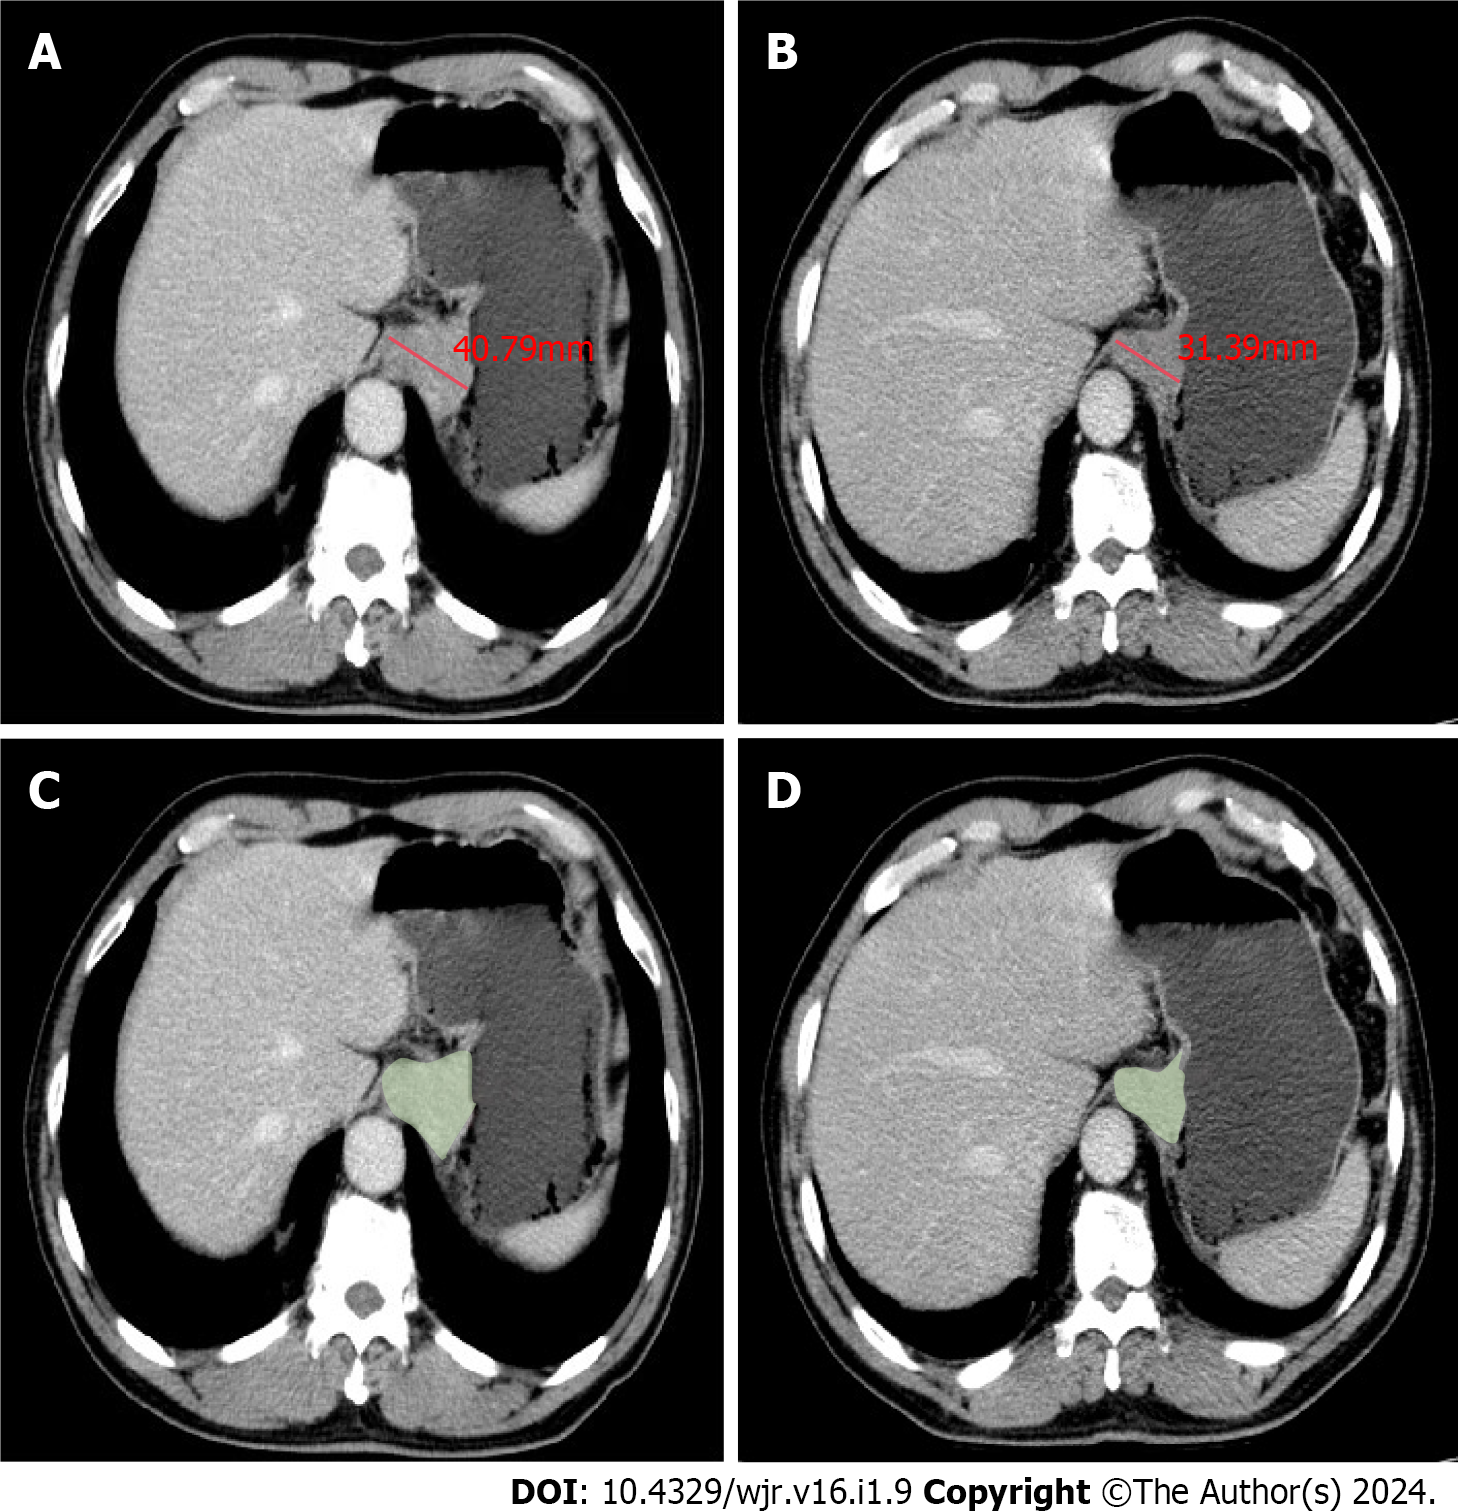
Figure 1 Measurements of maximal diameters and gross tumor volume based on portal venous phase contrast-enhanced computed tomography in a 65-year-old male with adenocarcinoma of the esophagogastric junction.
A: Maximal diameters of the tumor before three cycles neoadjuvant chemotherapy with docetaxel, oxaliplatin and S-1 (DOS); B: Maximal diameters of the tumor after three cycles DOS; C: Gross tumor volume (GTV) of the tumor before three cycles DOS; D: GTV of the tumor after three cycles DOS.
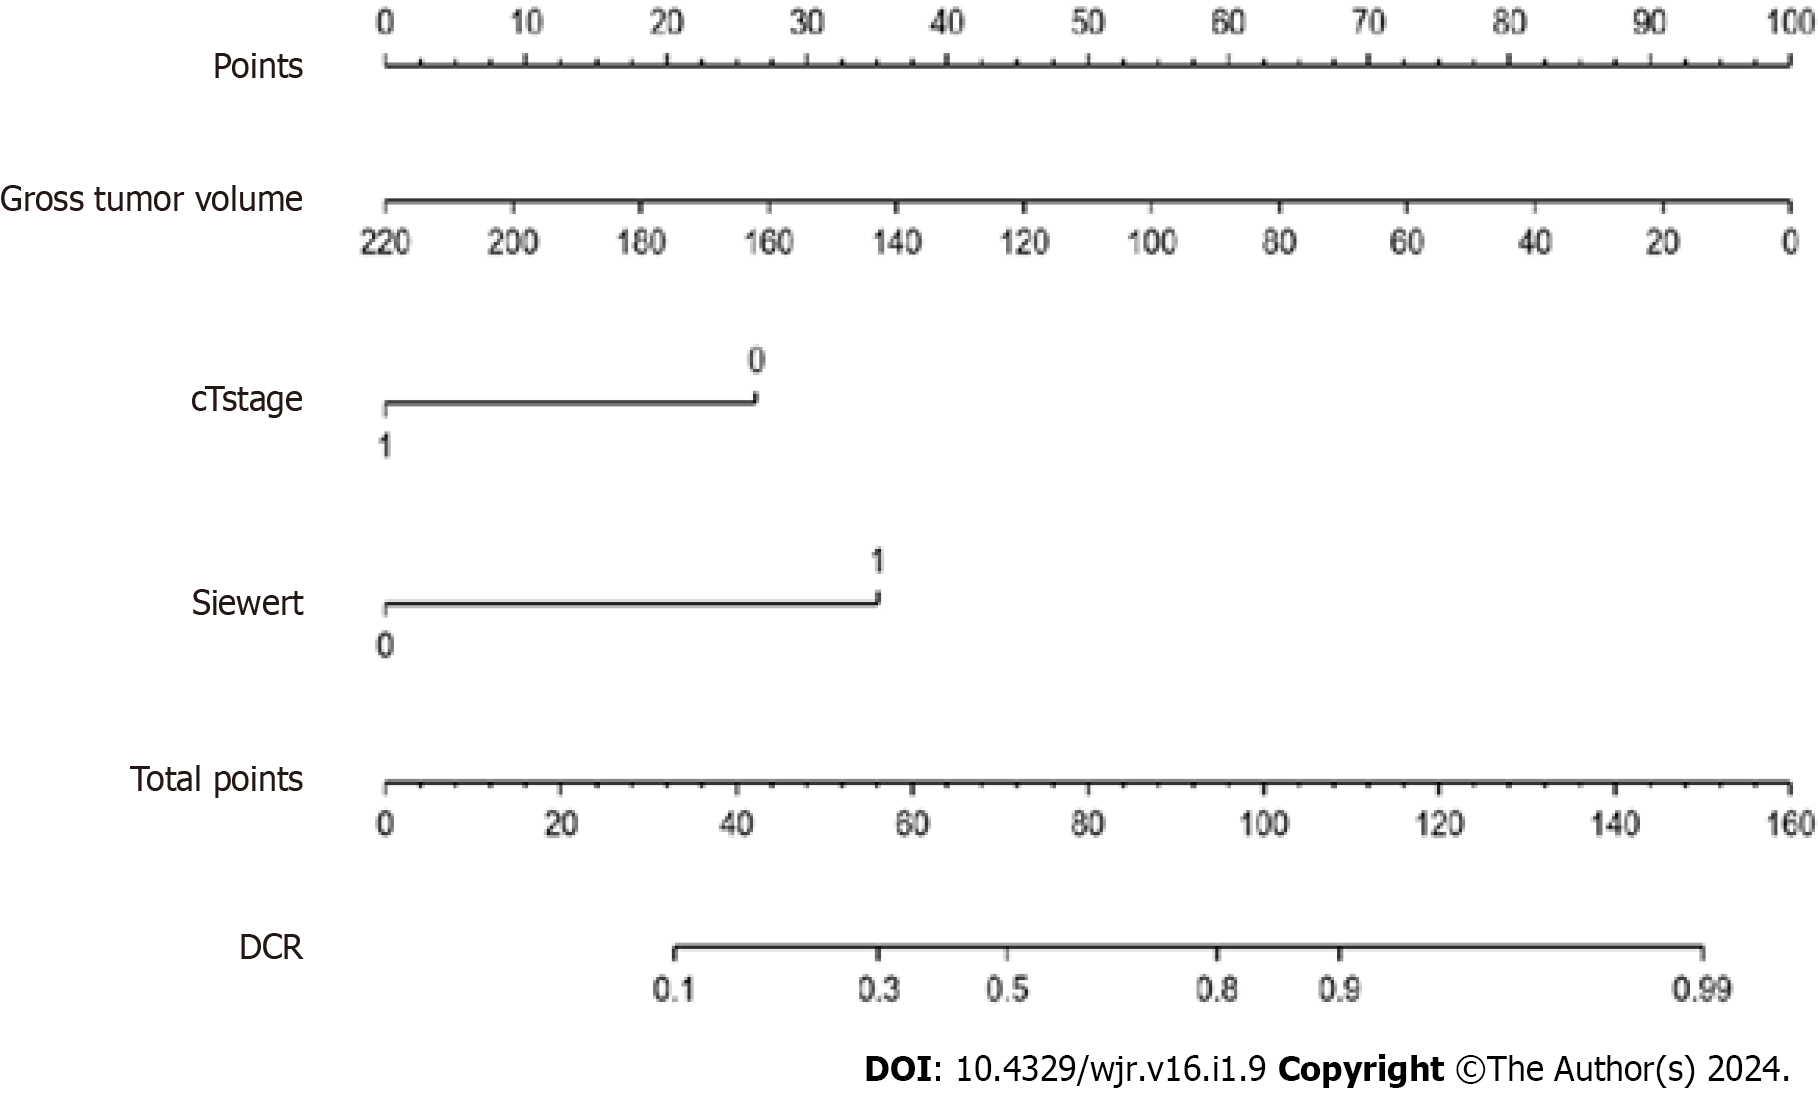
Figure 2 Nomogram was developed to predict disease control rate of adenocarcinoma of the esophagogastric junction after three cycles of neoadjuvant chemotherapy with docetaxel, oxaliplatin and S-1.
DCR: Disease control rate.
Figure 3 Receiver operating characteristic curves of the nomogram.
A: Area under curve with 0.838 in training cohort; B: Area under curve with 0.824 in validation cohort.
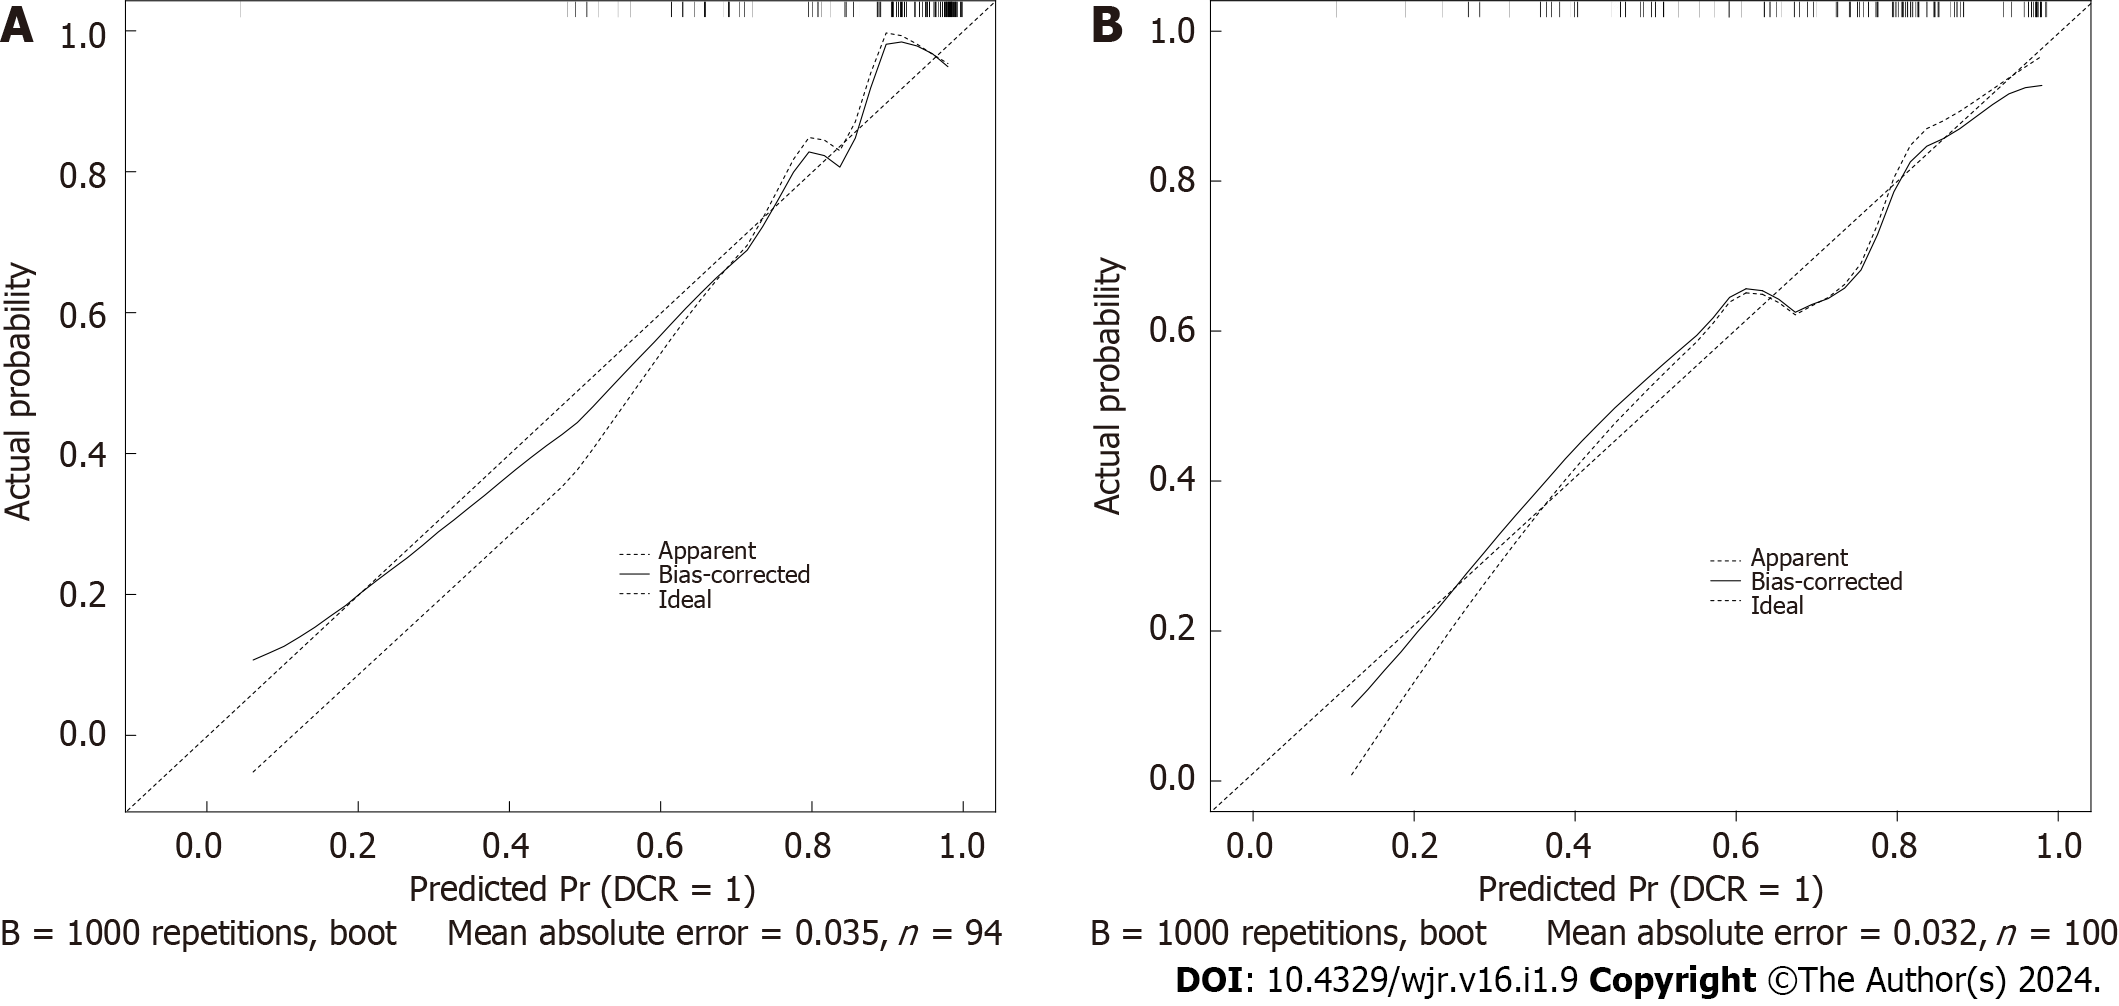
Figure 4 Calibration curve of the nomogram.
A: Calibration curve in the training cohort; B: Calibration curve in the validation cohort.
- Citation: Zhou CQ, Gao D, Gui Y, Li NP, Guo WW, Zhou HY, Li R, Chen J, Zhang XM, Chen TW. Computed tomography-based nomogram of Siewert type II/III adenocarcinoma of esophagogastric junction to predict response to docetaxel, oxaliplatin and S-1. World J Radiol 2024; 16(1): 9-19
- URL: https://www.wjgnet.com/1949-8470/full/v16/i1/9.htm
- DOI: https://dx.doi.org/10.4329/wjr.v16.i1.9


