©The Author(s) 2023.
World J Radiol. Apr 28, 2023; 15(4): 89-97
Published online Apr 28, 2023. doi: 10.4329/wjr.v15.i4.89
Published online Apr 28, 2023. doi: 10.4329/wjr.v15.i4.89
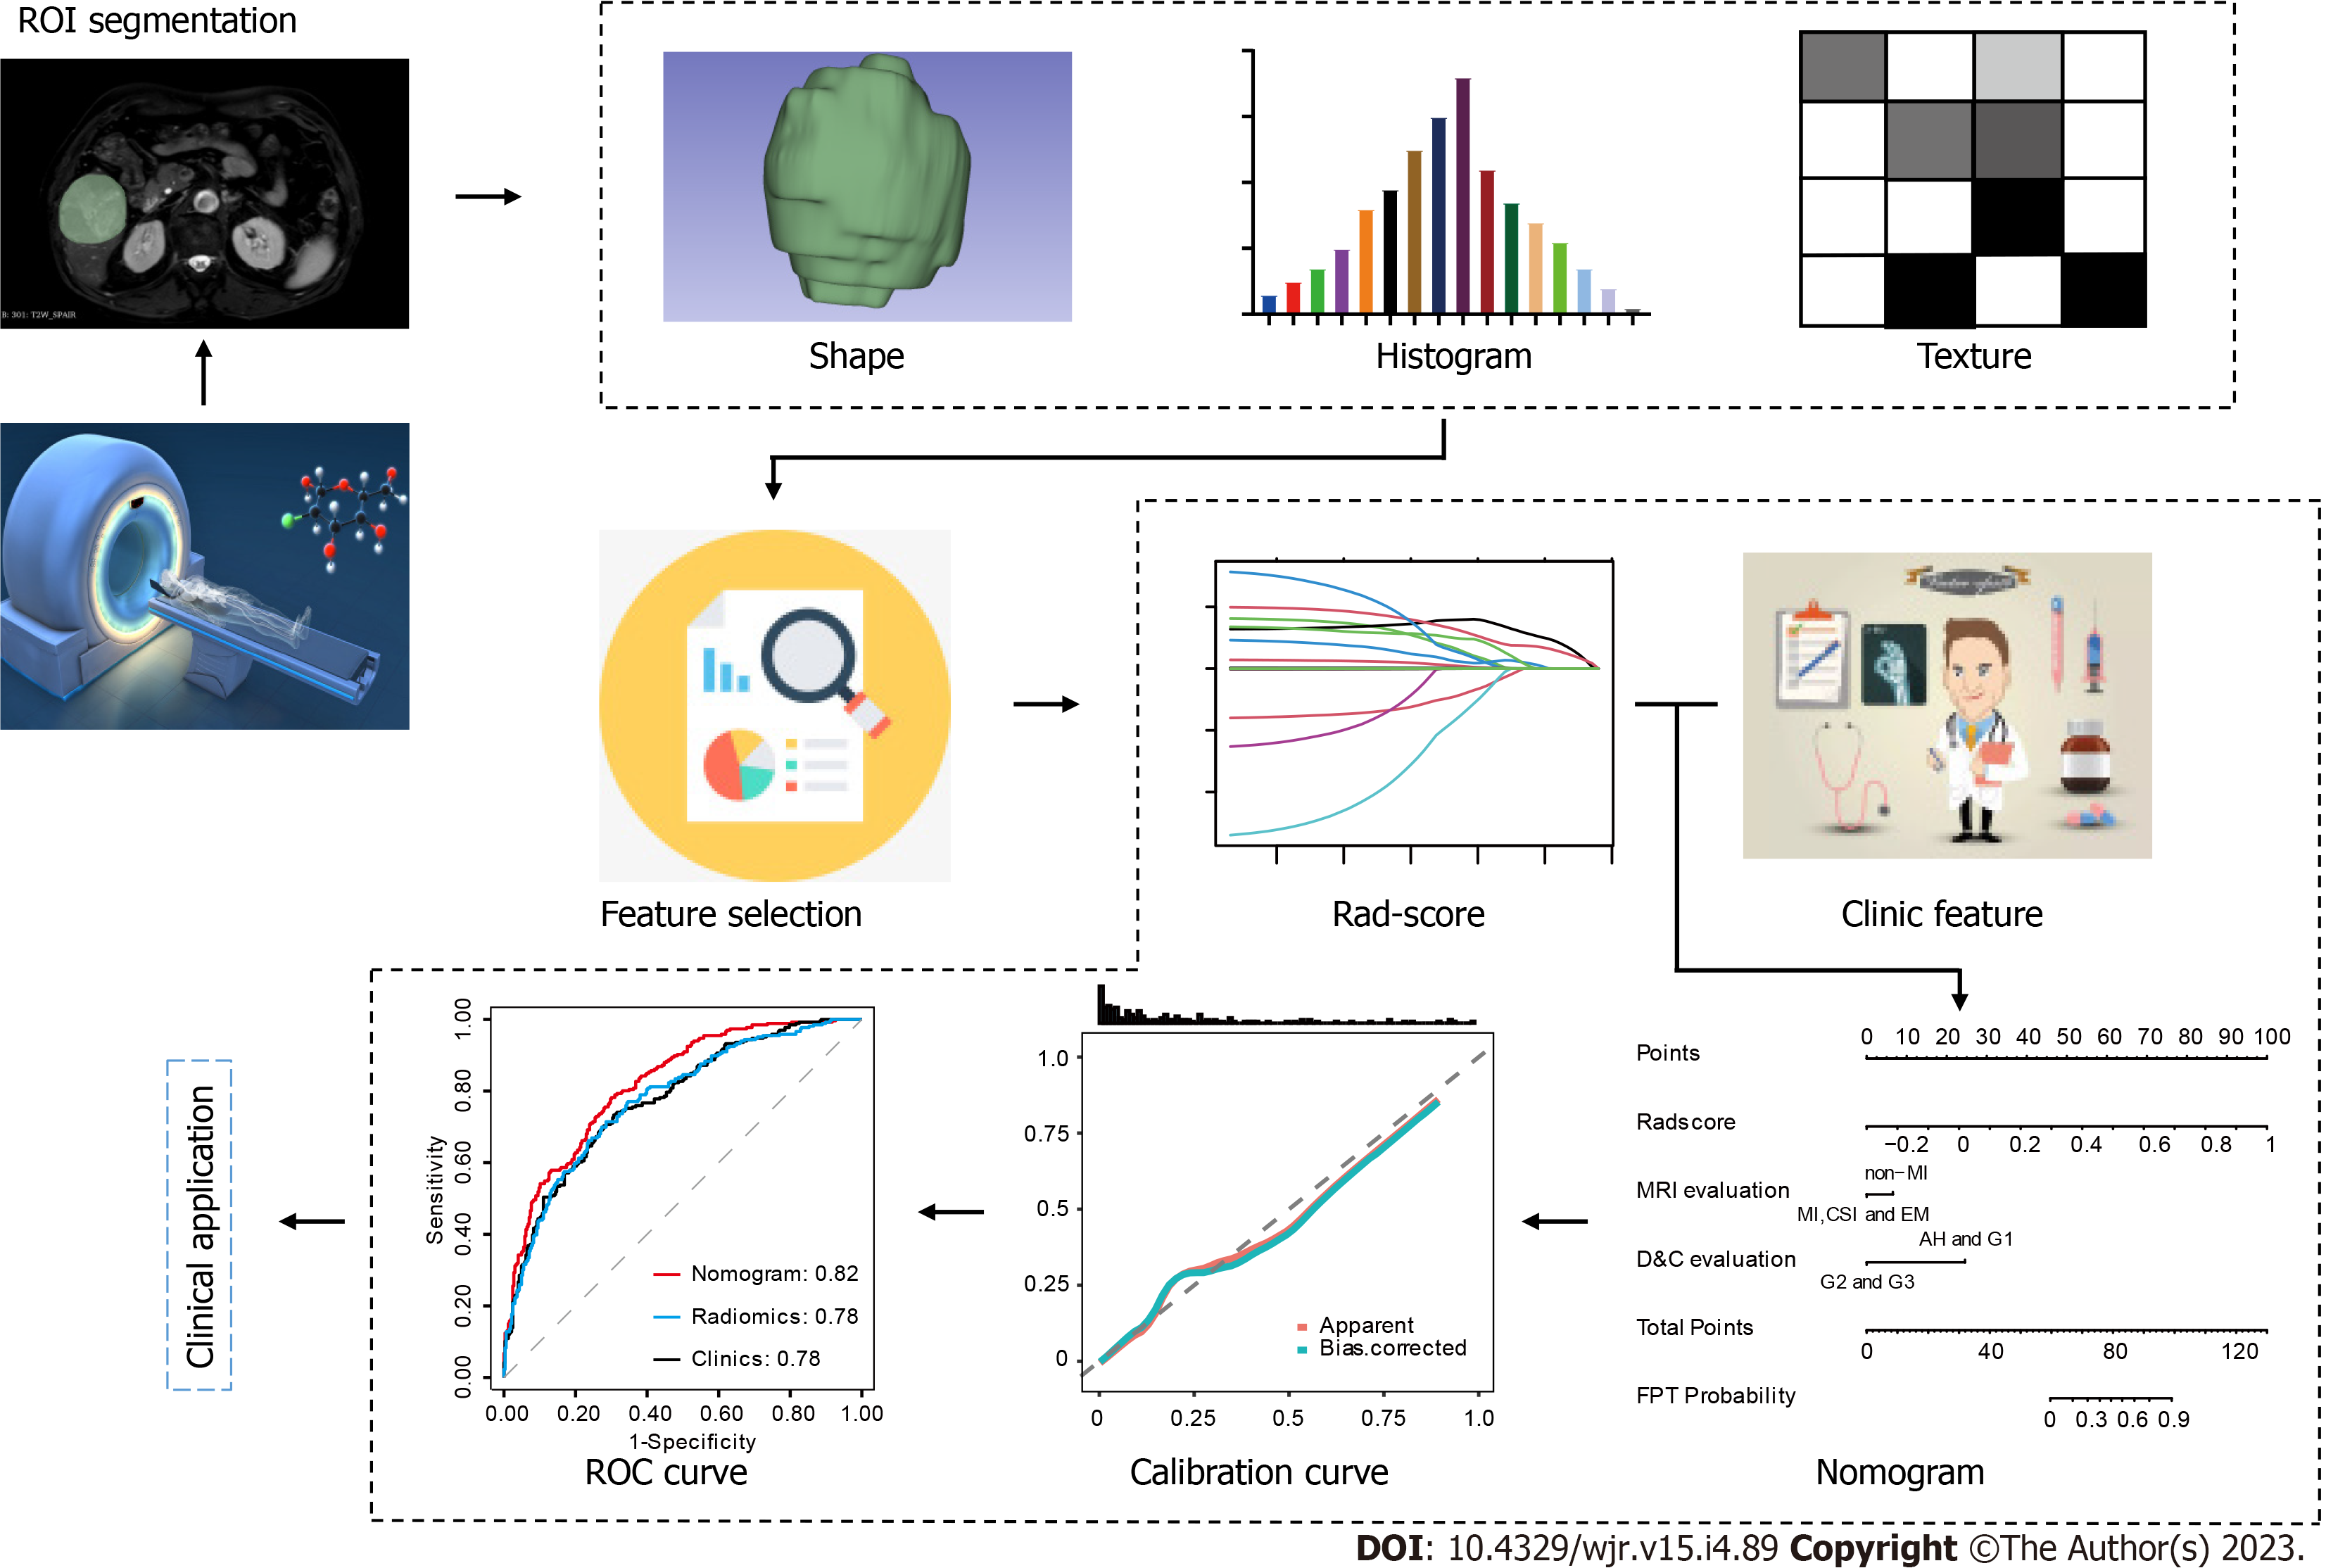
Figure 1 Radiomics flowchart.
Based on the imaging data obtained through scanning, the region of interest is delineated on the image, corresponding imaging features are extracted, features are filtered and dimensioned, and imageomics labels are constructed to obtain the rad-score of the image. Then, combined with clinical features, a joint prediction model is established, and a series of clinical applications are conducted by constructing nomogram, calibration curve, and receiver operating characteristic curve. ROI: Region of interest; ROC: Receiver operating characteristic; FPT: Ferroptosis; MRI: Magnetic resonance imaging.
- Citation: Chen TY, Yang ZG, Li Y, Li MQ. Radiomic advances in the transarterial chemoembolization related therapy for hepatocellular carcinoma. World J Radiol 2023; 15(4): 89-97
- URL: https://www.wjgnet.com/1949-8470/full/v15/i4/89.htm
- DOI: https://dx.doi.org/10.4329/wjr.v15.i4.89


