©The Author(s) 2023.
World J Radiol. Mar 28, 2023; 15(3): 56-68
Published online Mar 28, 2023. doi: 10.4329/wjr.v15.i3.56
Published online Mar 28, 2023. doi: 10.4329/wjr.v15.i3.56
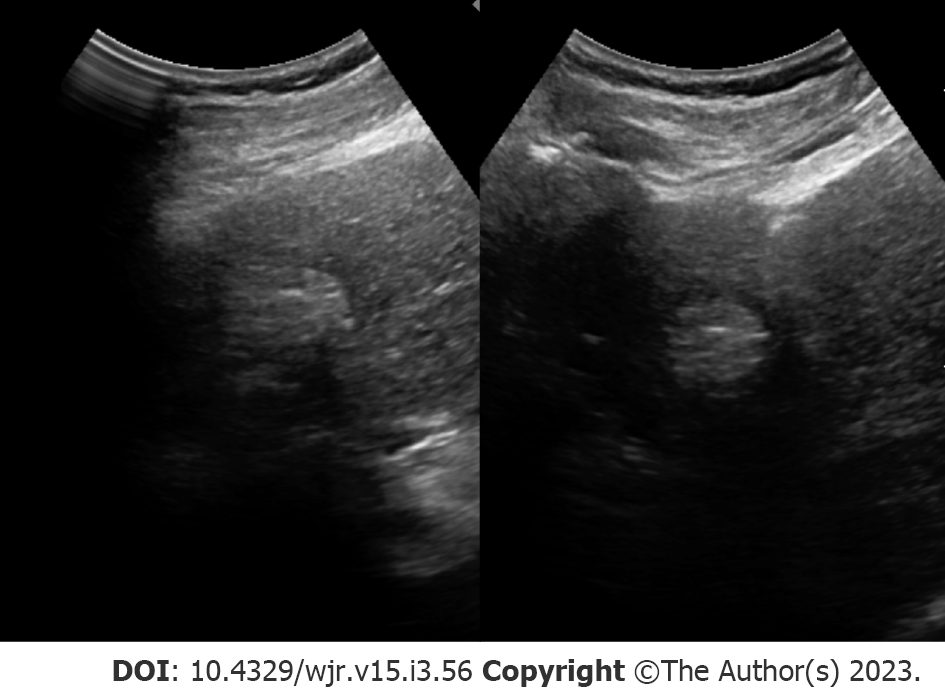
Figure 1 Screening ultrasound.
Hyperechoic segment IV liver lesion compatible and later characterized as hepatocellular carcinoma.
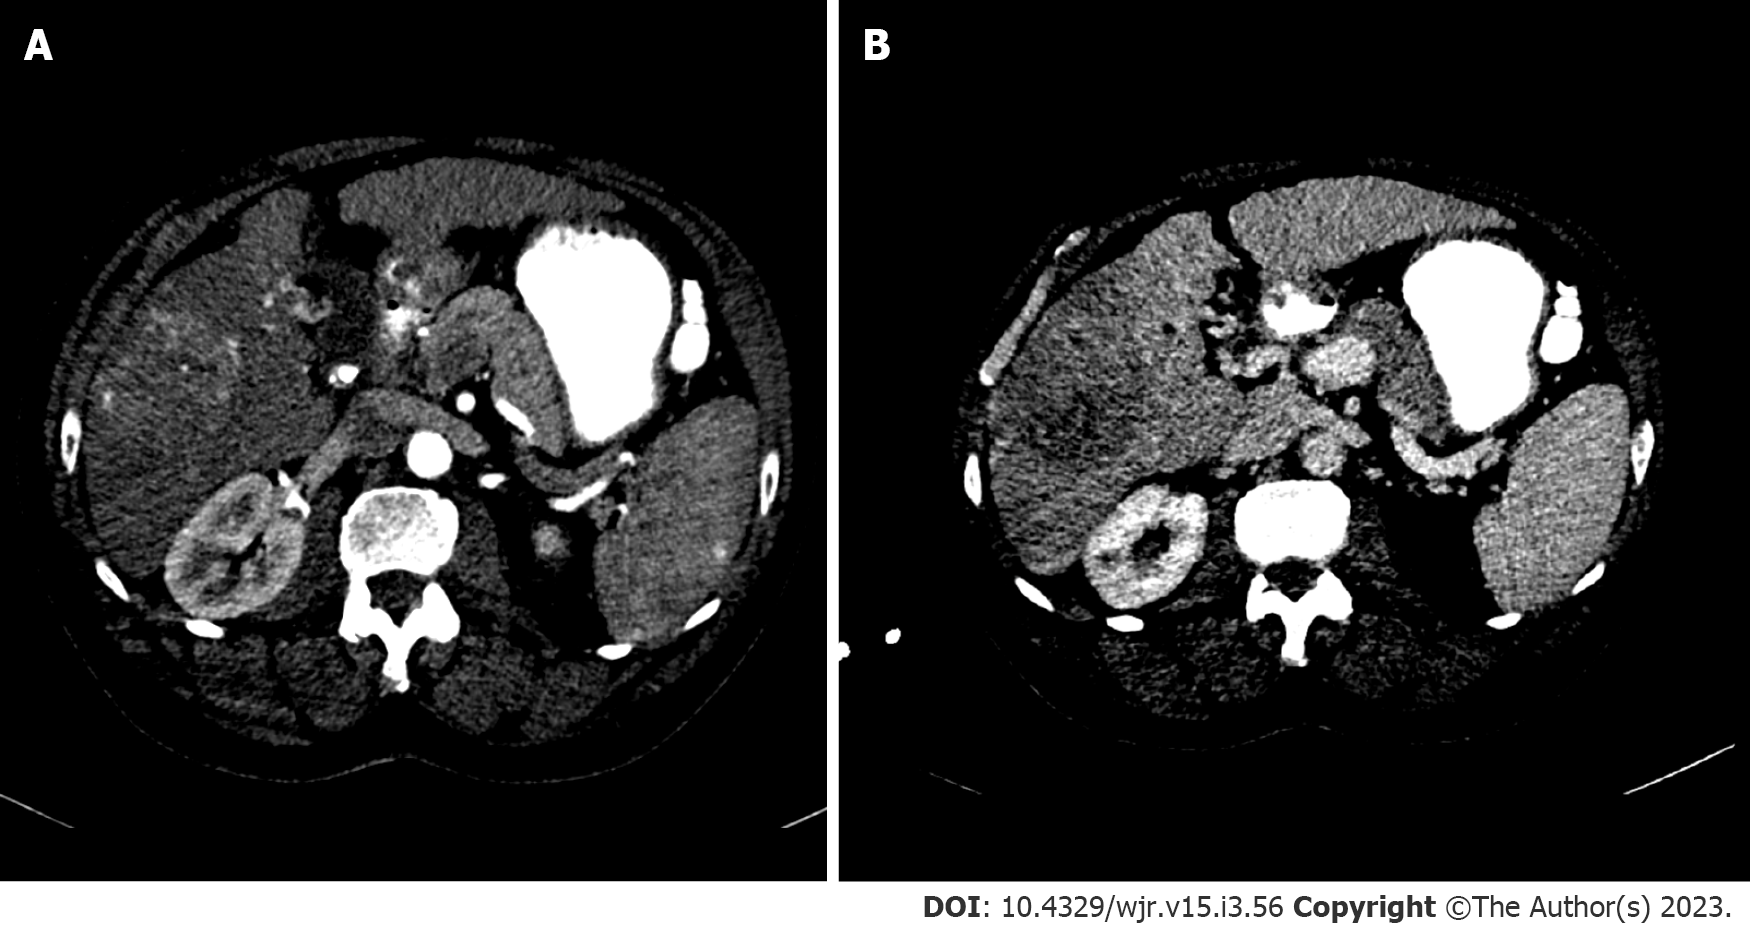
Figure 2 Axial multiphasic computed tomography imaging 75-year-old male with suspected hepatocellular carcinoma.
A: Hyperenhancing liver lesion in segment VIII during the arterial phase; B: Corresponding washout within the delayed venous phase.
Figure 3 Axial multiphasic magnetic resonance imaging.
A: T2-weighted axial sequence imaging of the abdomen; B: T1-weighted fat saturation post-contrast axial sequence image of the abdomen with arterial enhancement of segment VIII lesion; C: Delayed venous phase washout.
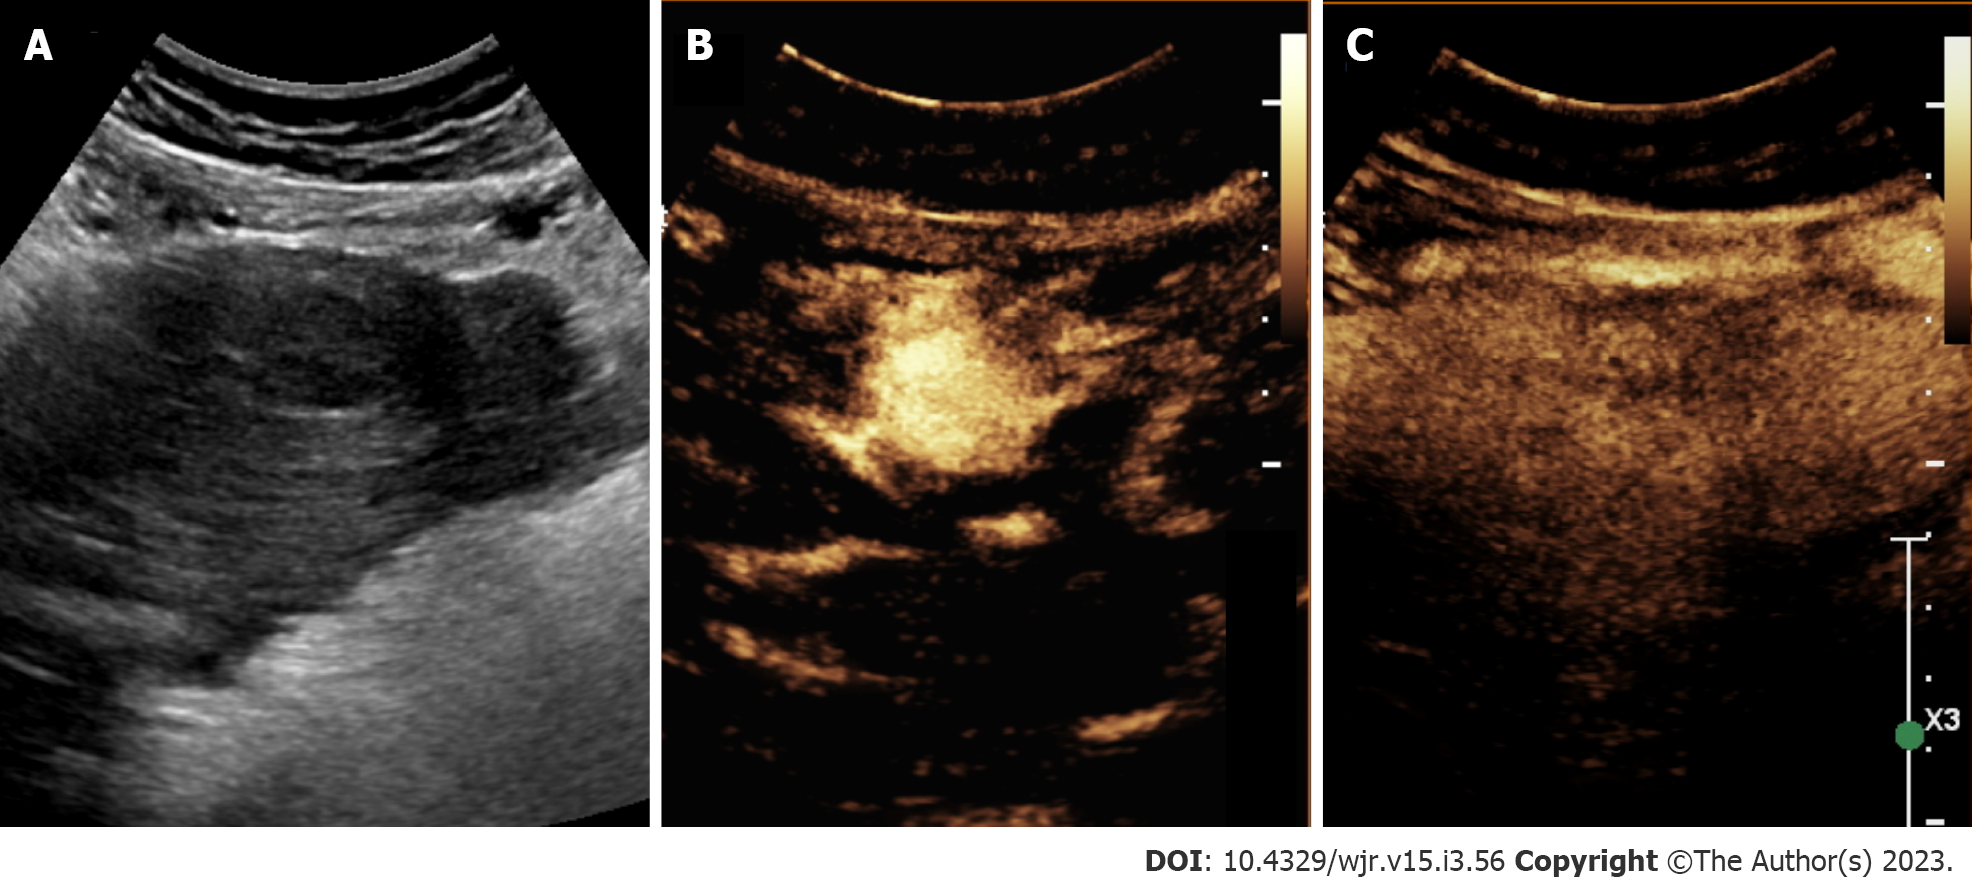
Figure 4 Contrast-enhanced ultrasound.
A: 62-year-old female with lesion in segment III with hepatocellular carcinoma; B: Gray-scale conventional ultrasound; C: Contrast-enhanced ultrasound revealing hyperechoic lesion in arterial phase with corresponding washout in venous phase.
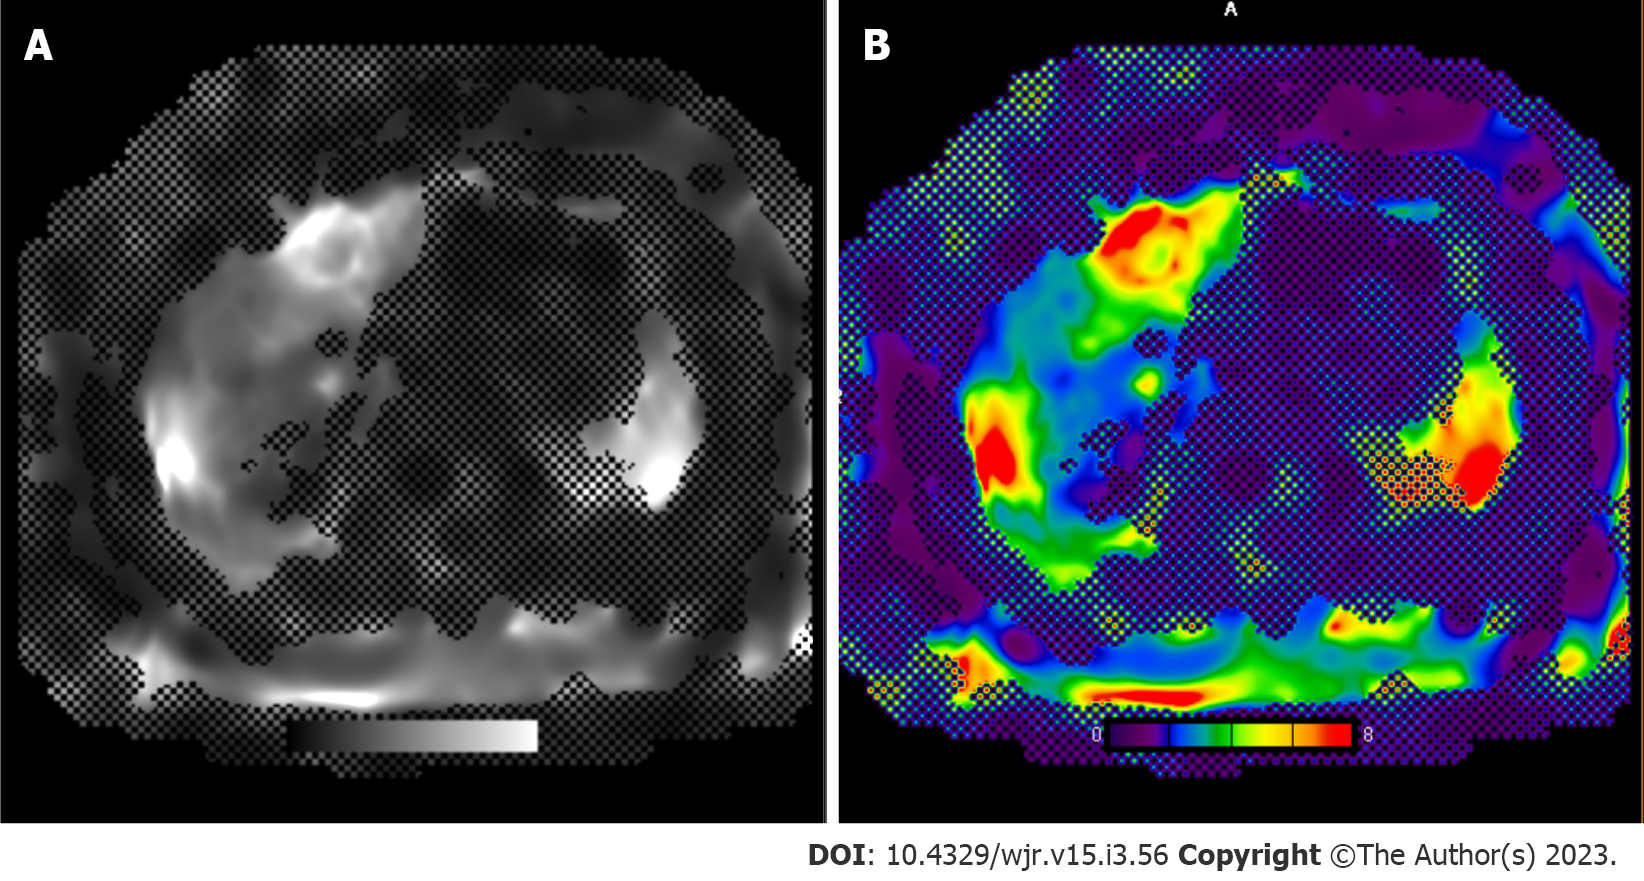
Figure 5 Magnetic resonance imaging elastography of the liver.
Resoundant driver system was used to induce acoustic vibrations in the liver, which were then tracked using magnetic resonance imaging (MRI) scanner to estimate hepatic stiffness. Gray scale and color-scale MRI elastography stiffness sequence. The mean liver stiffness is 4.0 kPa (range: 3.8-4.2 kPa). < 2.5 kPa = Normal; 0.5 to 2.93 kPa = Normal or inflammation; 2.93-3.5 kPa = Stage 1-2 fibrosis; 3.5-4 kPa = Stage 2-3 fibrosis; 4-5 kPa = Stage 3-4 fibrosis; > 5 kPa = Stage 4 or cirrhosis. A: Gray scale; B: Color-scale.
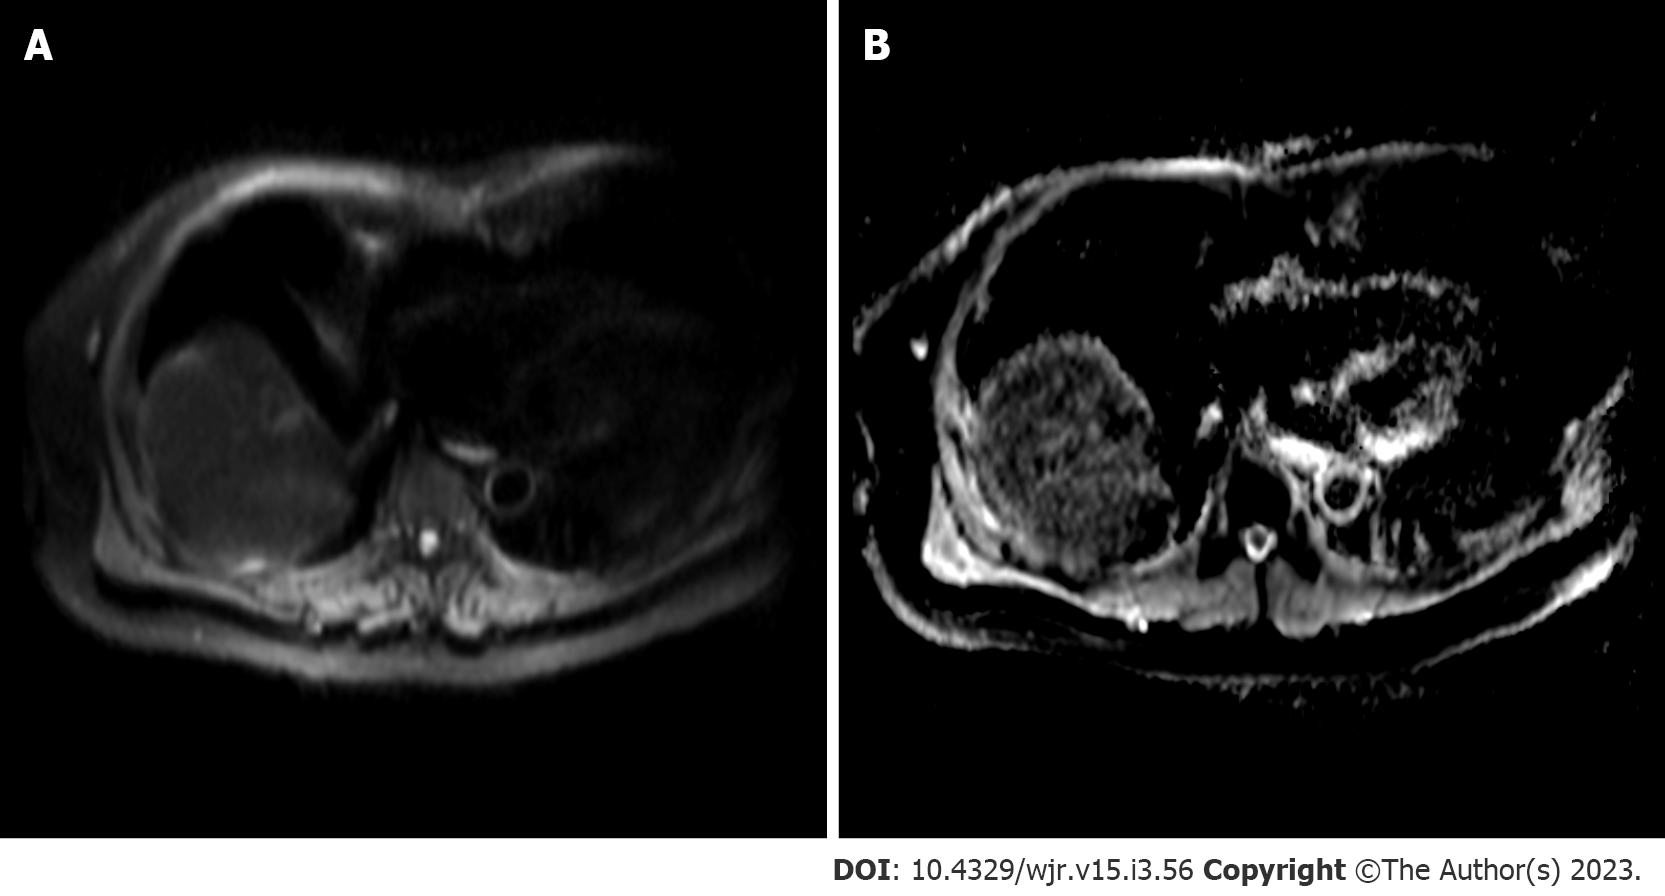
Figure 6 Diffusion-weighted imaging.
A: Diffusion-weighted imaging sequence; B: Apparent diffusion coefficient (ADC) map. Increased signal can be observed within the segment VIII lesion with corresponding hypointensity on ADC map, compatible with diffusion restriction.
- Citation: Criss C, Nagar AM, Makary MS. Hepatocellular carcinoma: State of the art diagnostic imaging. World J Radiol 2023; 15(3): 56-68
- URL: https://www.wjgnet.com/1949-8470/full/v15/i3/56.htm
- DOI: https://dx.doi.org/10.4329/wjr.v15.i3.56


