Copyright
©The Author(s) 2022.
World J Radiol. Feb 28, 2022; 14(2): 30-46
Published online Feb 28, 2022. doi: 10.4329/wjr.v14.i2.30
Published online Feb 28, 2022. doi: 10.4329/wjr.v14.i2.30
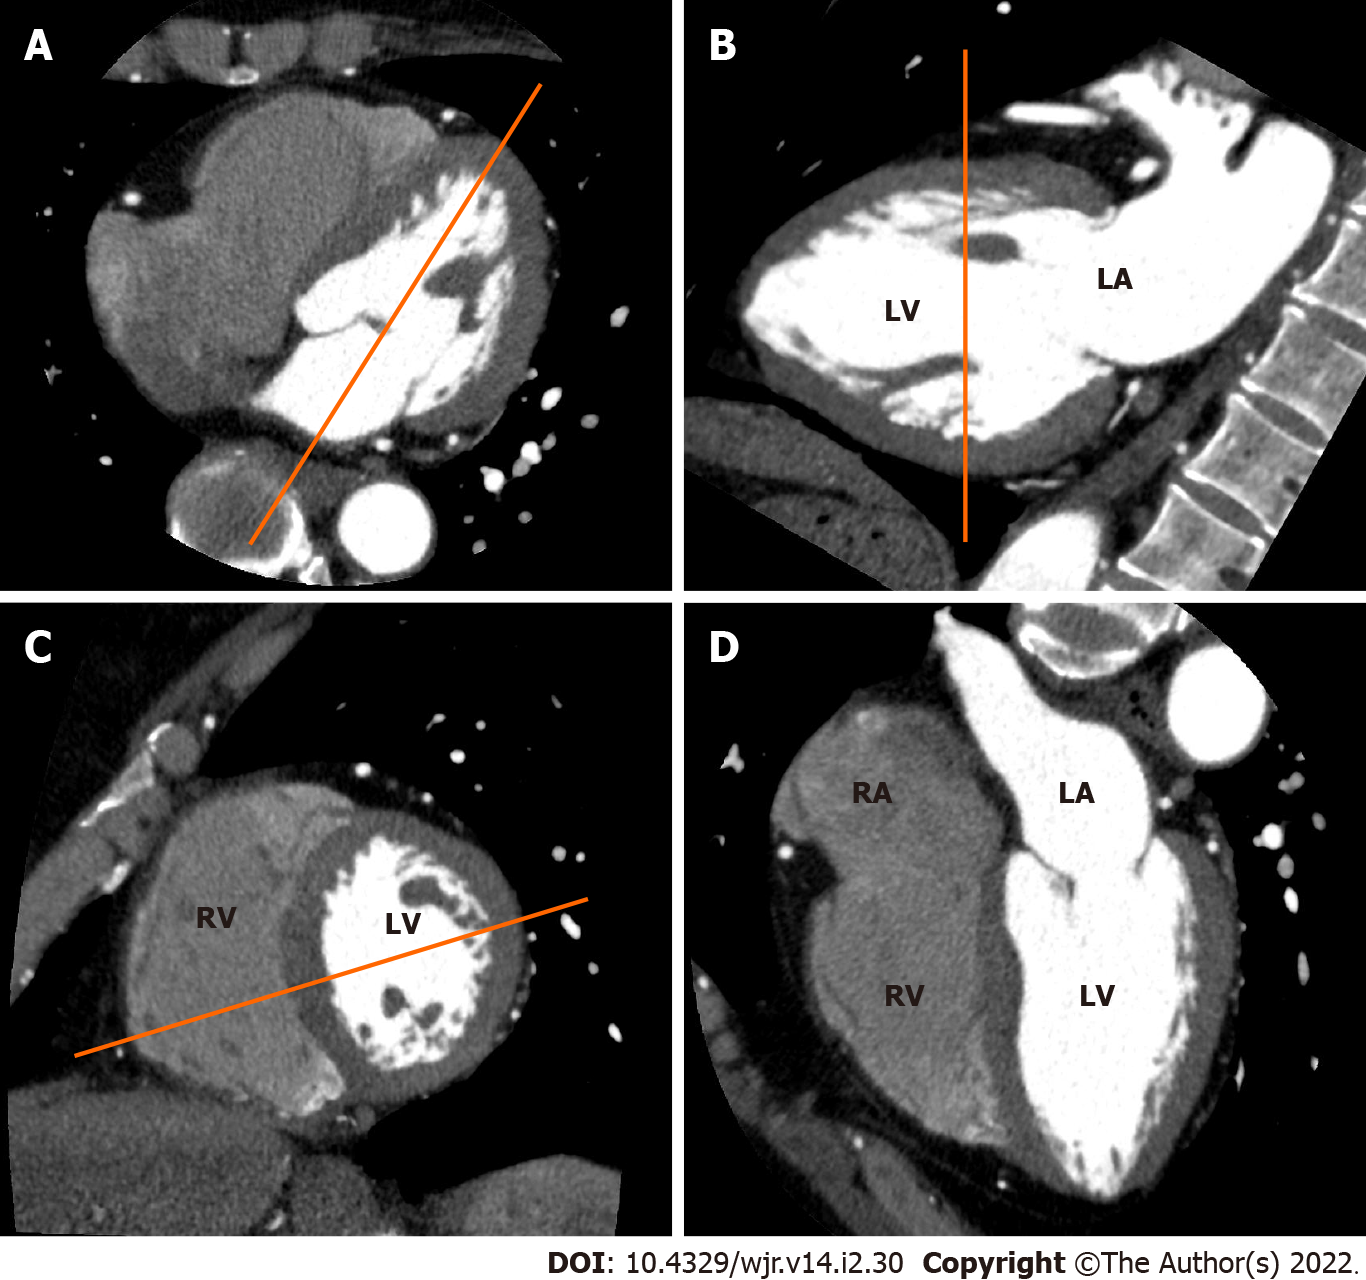
Figure 1 Electrocardiogram-gated cardiac computed tomography (CT)-based sequential approach to CT imaging of cardiac planes.
A: From an axial CT data set at the level of the mitral valve, a longitudinal plane bisecting the mitral valve and the left ventricular apex is used to create a vertical long axis view; B: From the vertical long axis view, a slice parallel to the mitral annulus at the mid ventricular level is used to obtain a short axis view; C: From the short axis view, a slice bisecting the center of the left ventricle (LV) and the intersection between the junction of the free wall and diaphragmatic wall of the right ventricle (RV) are used to obtain a horizontal long axis view. (D) Horizontal long axis view showing the left atrium, LV, right atrium and RV.
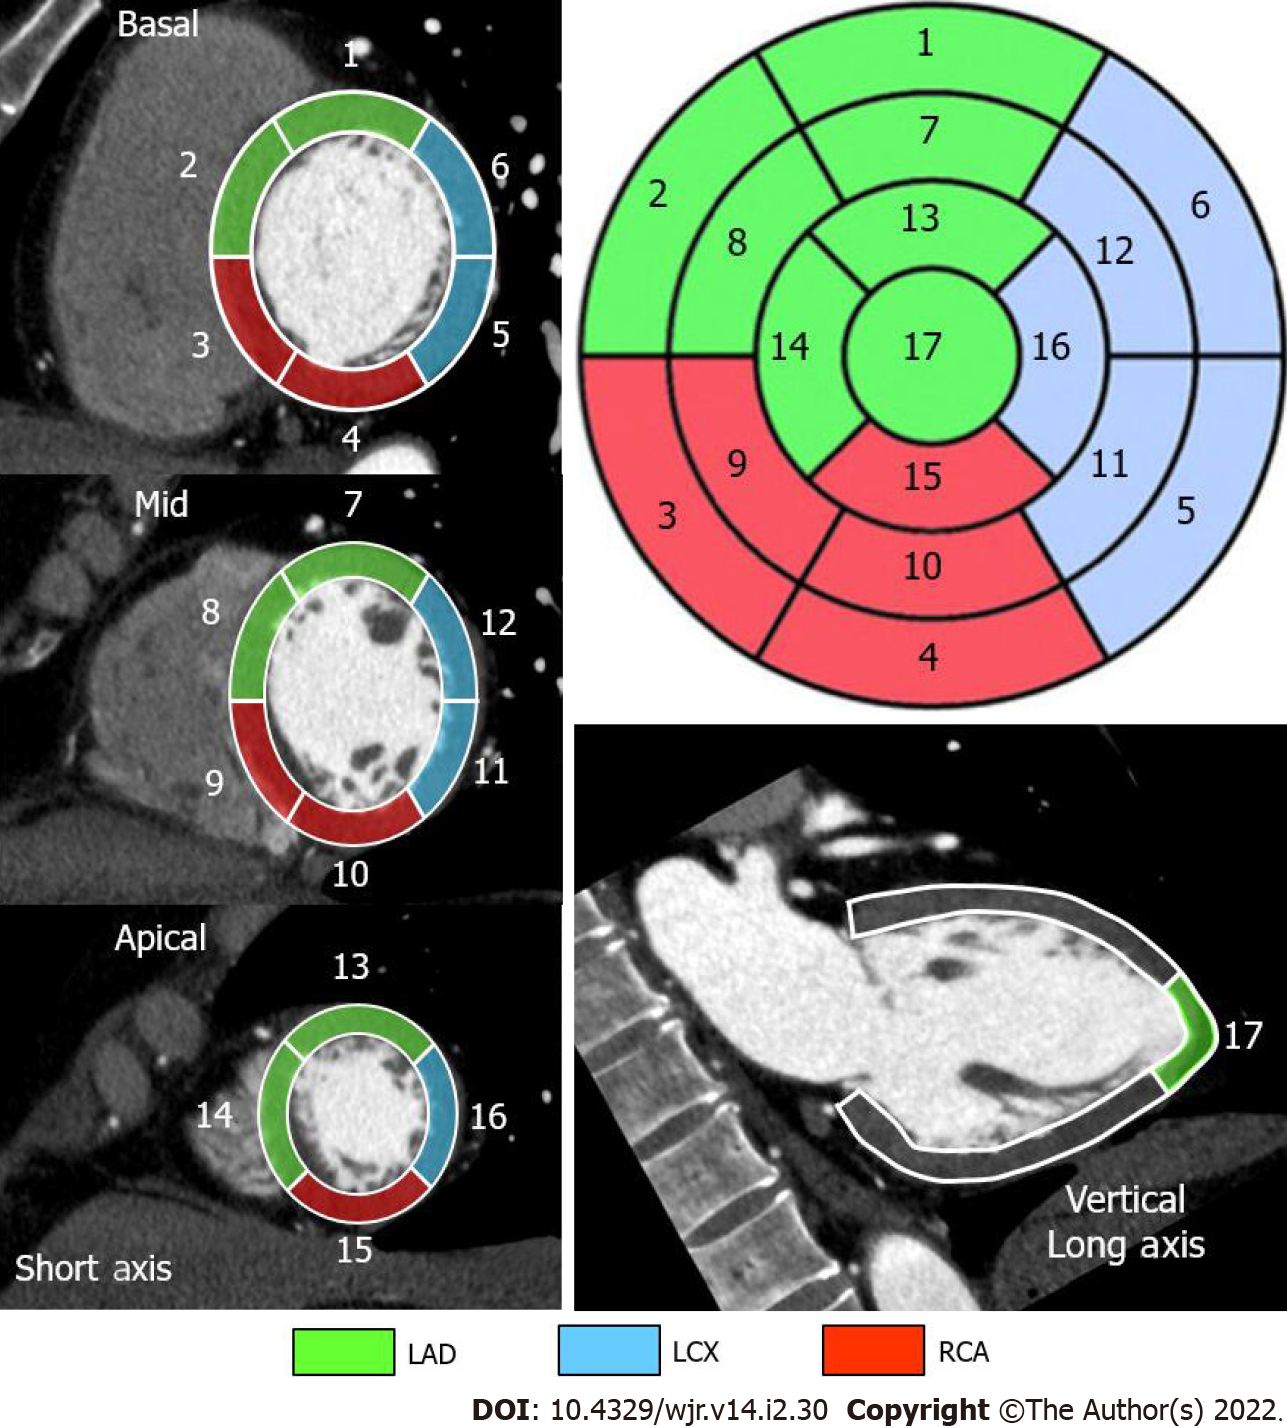
Figure 2 Standard segmental myocardial display in a 17-segment model.
Electrocardiogram-gated cardiac computed tomography-based individual assignment of left ventricular segmentation following the American Heart Association 17-segment model with corresponding color-coded coronary artery perfusion territories for a right-dominant coronary system. LAD: Left anterior descending artery in green; LCX: Left circumflex coronary artery in blue; RCA: Right coronary artery in red.
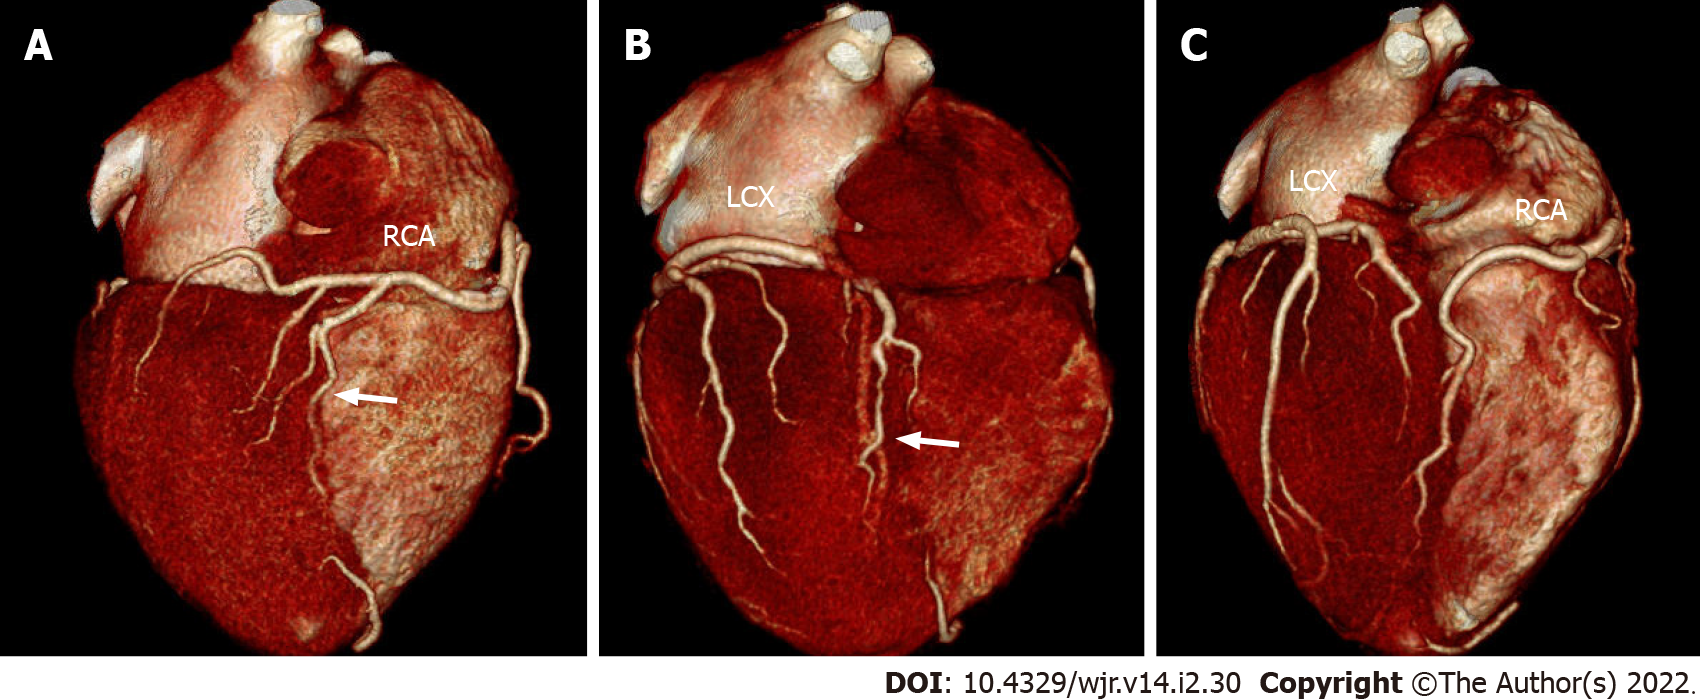
Figure 3 Variability in the coronary artery blood supply to the myocardium.
Three-dimensional volume-rendered electrocardiogram-gated cardiac computed tomography images showing the inferior surface of the heart representing different coronary anatomy variants; A: Standard, right-dominant circulation. Right coronary artery (RCA) supplies posterior descending branch (arrow). Left circumflex coronary artery (LCX) supplies only inferolateral left ventricular myocardium; B: Left-dominant circulation. LCX supplies posterior descending branch (arrow). RCA supplies only right ventricular myocardium; C: Codominant circulation. Inferior myocardium is supplied both RCA and LCX.
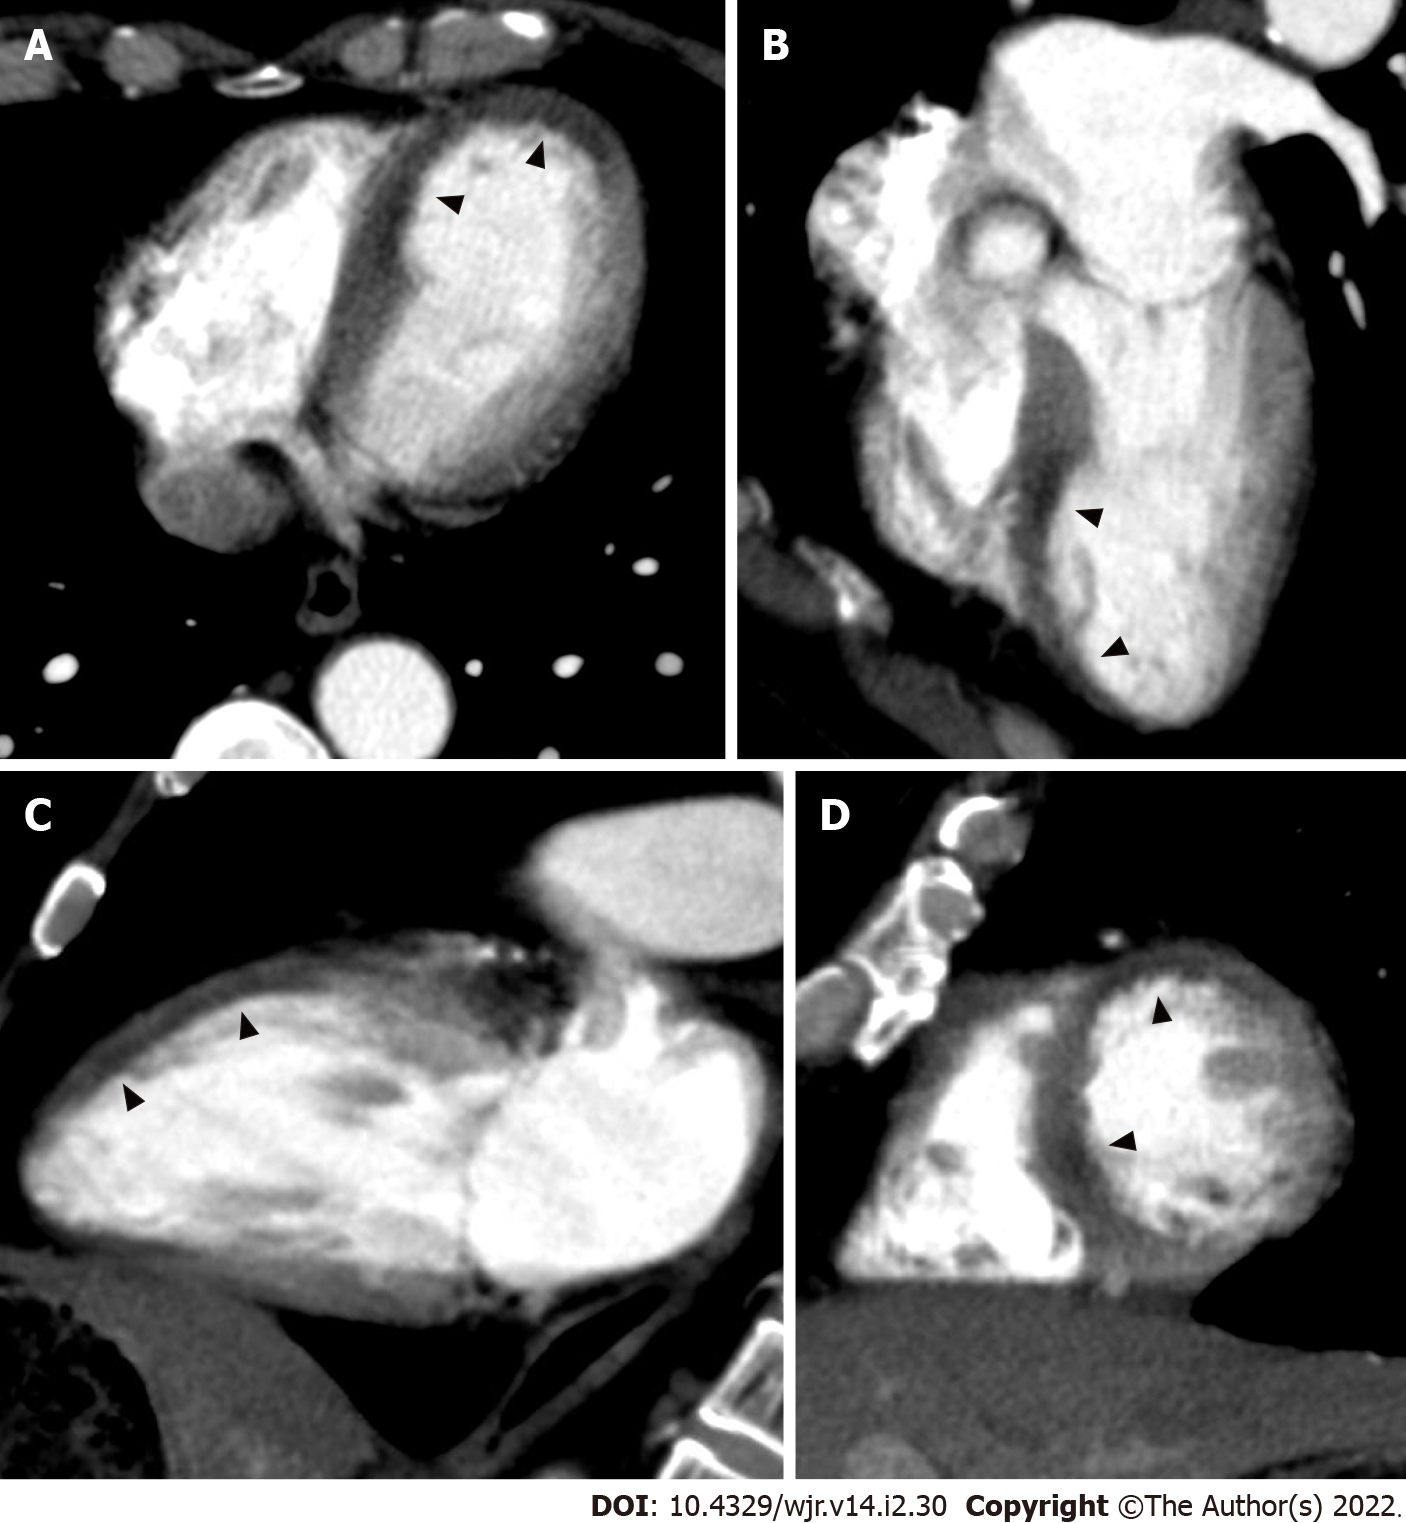
Figure 4 Non-electrocardiogram-gated contrast-enhanced computed tomography images in acute coronary syndrome of left anterior descending artery.
A 64-year-old man with chest pain underwent non-electrocardiogram (ECG)-gated contrast-enhanced computed tomography (CECT) in search of aortic dissection. Axial (A), horizontal long axis (B), vertical long axis (C), and short axis (D) reformatted non-ECG-gated CECT images acquired 29 s after contrast injection showed decreased myocardial enhancement in the mid to apical anterior wall to the septum and apex of the left ventricle (arrowheads).
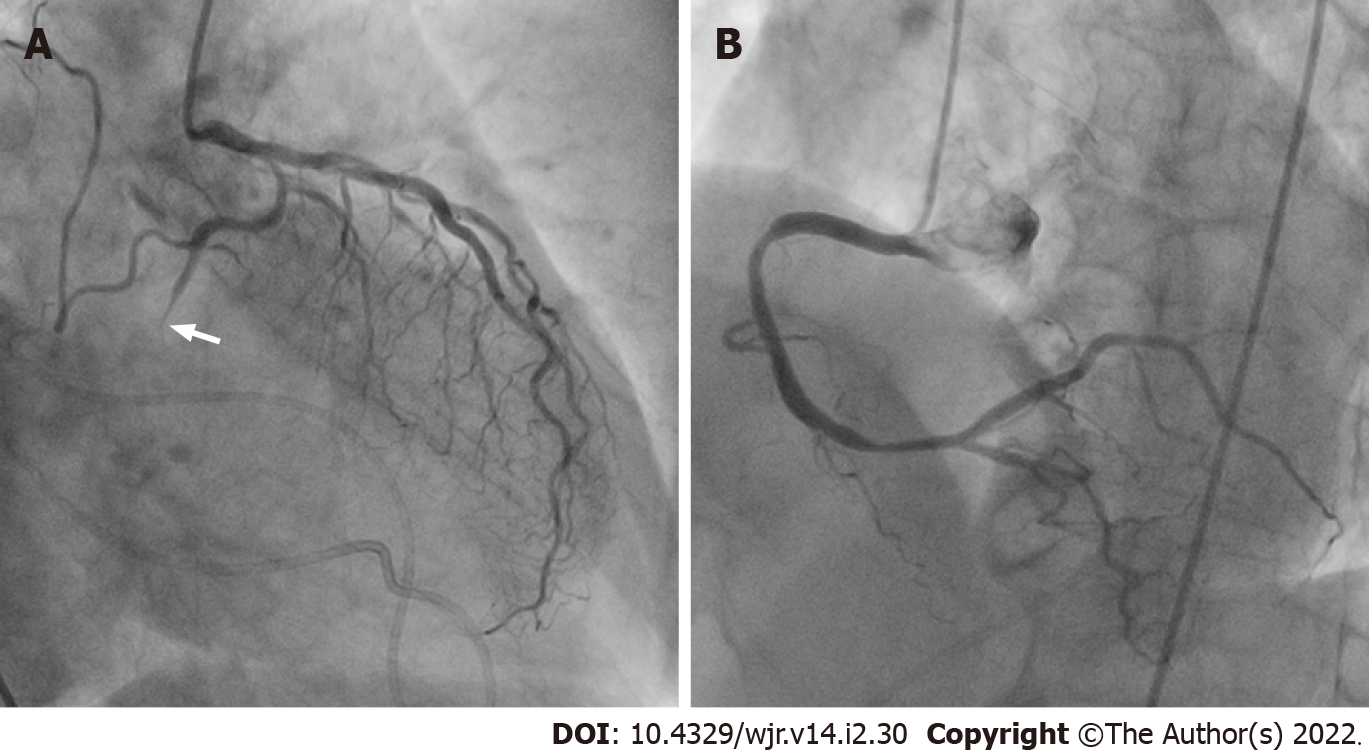
Figure 5 Corresponding invasive coronary angiography in acute coronary syndrome of left anterior descending artery.
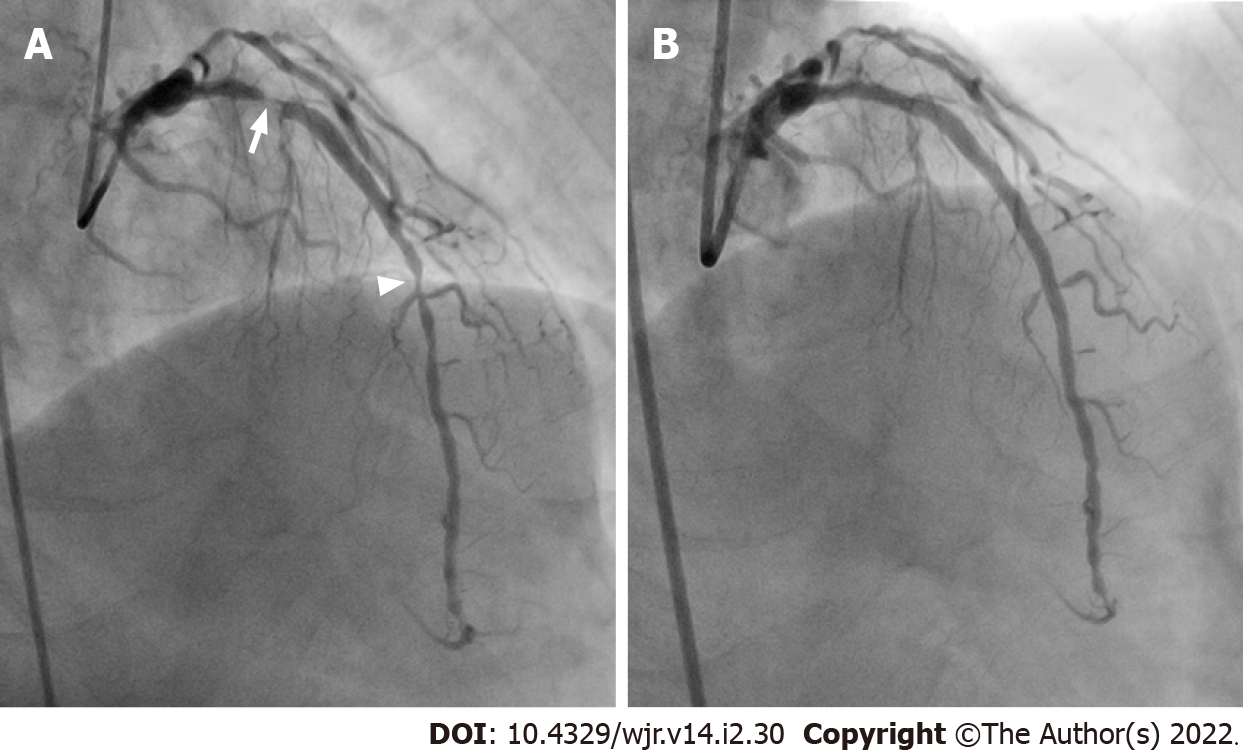
A: Same patient as Figure 4. Invasive coronary angiography showed 90% and 75% stenosis in the proximal (arrow) and mid (arrowhead) site of the left anterior descending artery; B: Subsequent percutaneous coronary intervention was performed by balloon angioplasty and stent implantation. His laboratory examination showed no elevation of cardiac biomarkers.
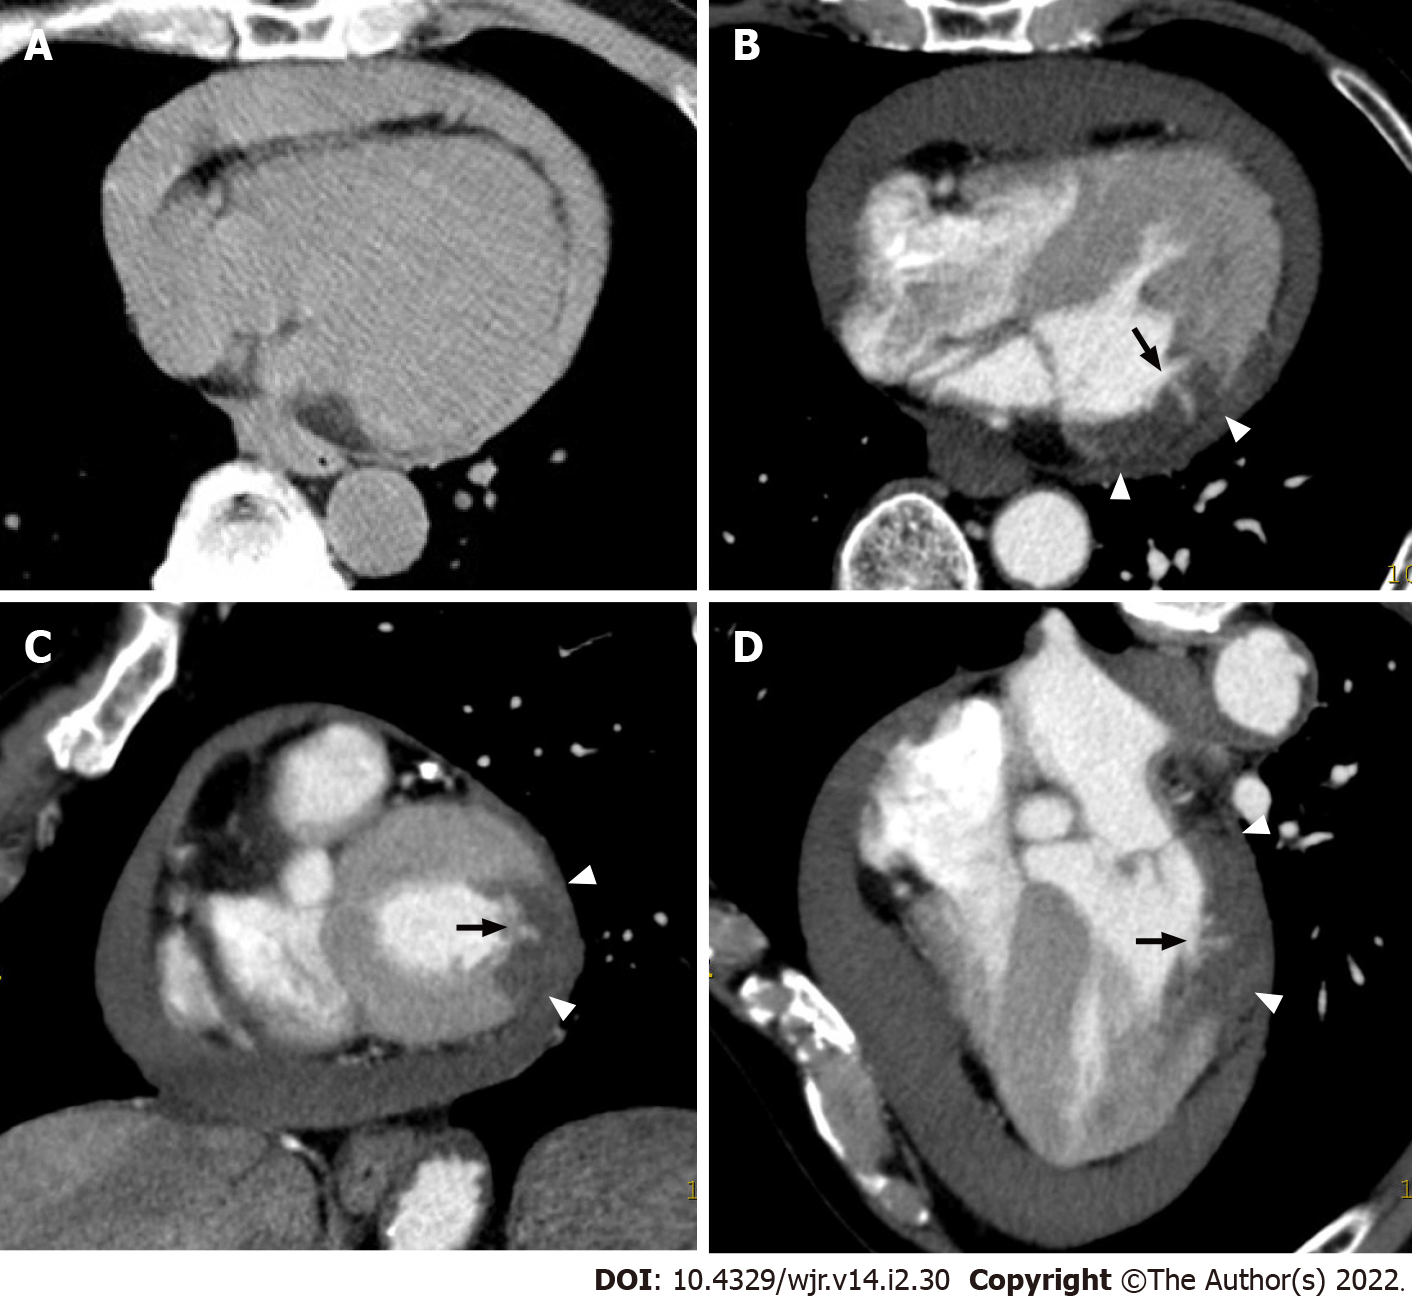
Figure 6 Non-electrocardiogram-gated contrast-enhanced computed tomography images in acute coronary syndrome of left circumflex coronary artery.
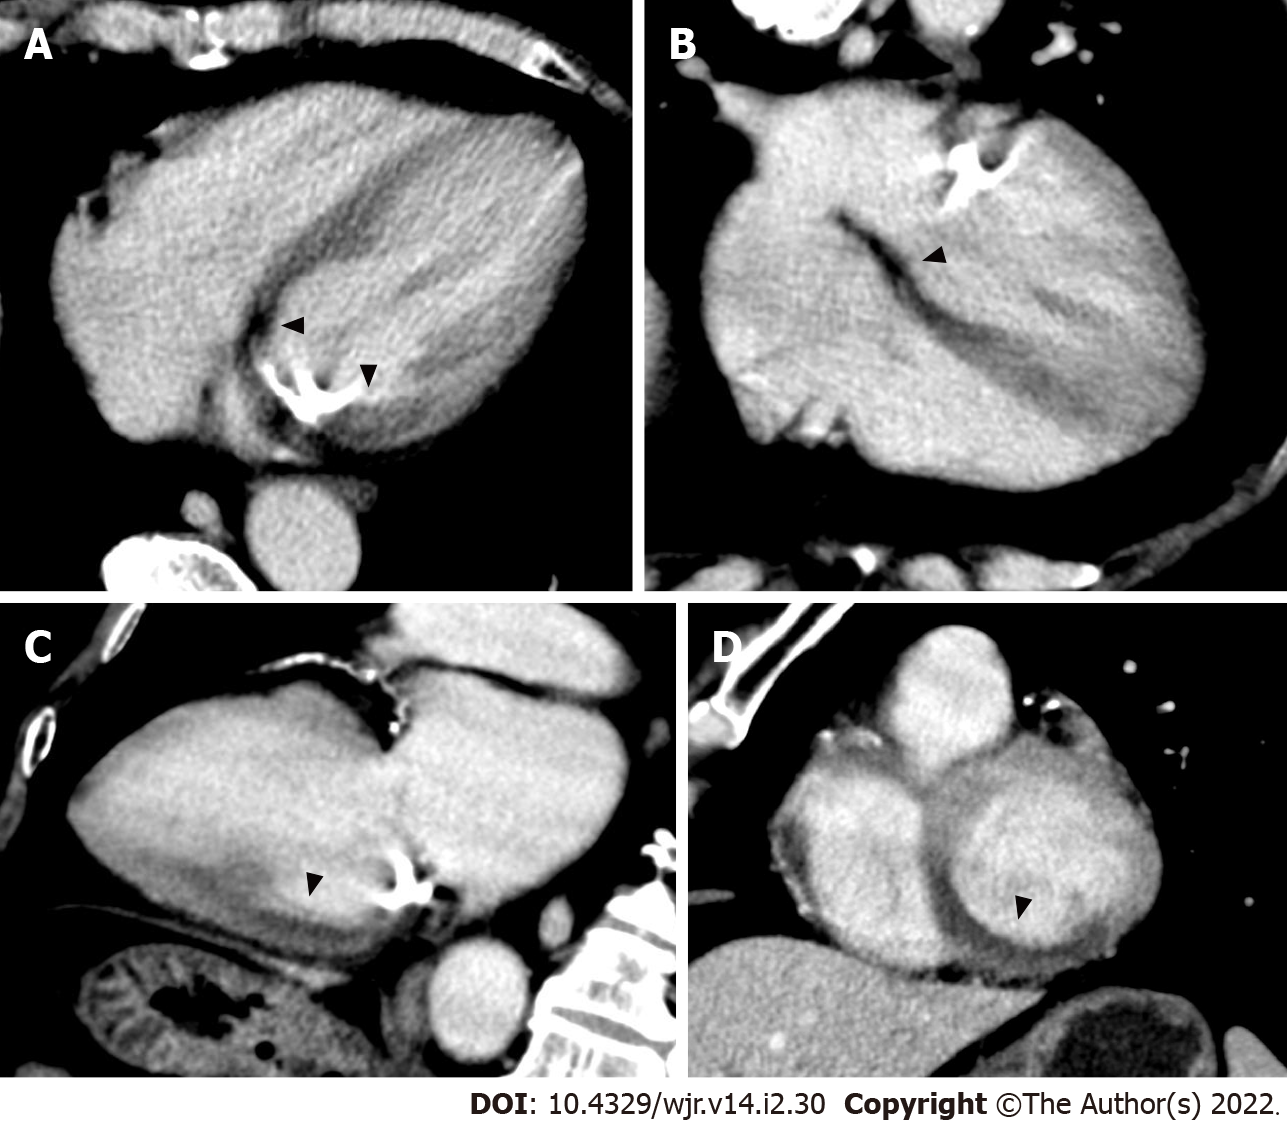
A 65-year-old man with epigastralgia underwent non-electrocardiogram (ECG)-gated contrast-enhanced computed tomography (CECT) in search of aortic dissection. Axial (A), horizontal long axis (B), and short axis (C) reformatted non-ECG-gated CECT images acquired 120 s after contrast injection showed decreased myocardial enhancement in the mid lateral wall of the left ventricle (arrowheads).
Figure 7 Corresponding invasive coronary angiography, cardiac magnetic resonance imaging and tetrofosmin single-photon emission computed tomography in acute coronary syndrome of left circumflex coronary artery.
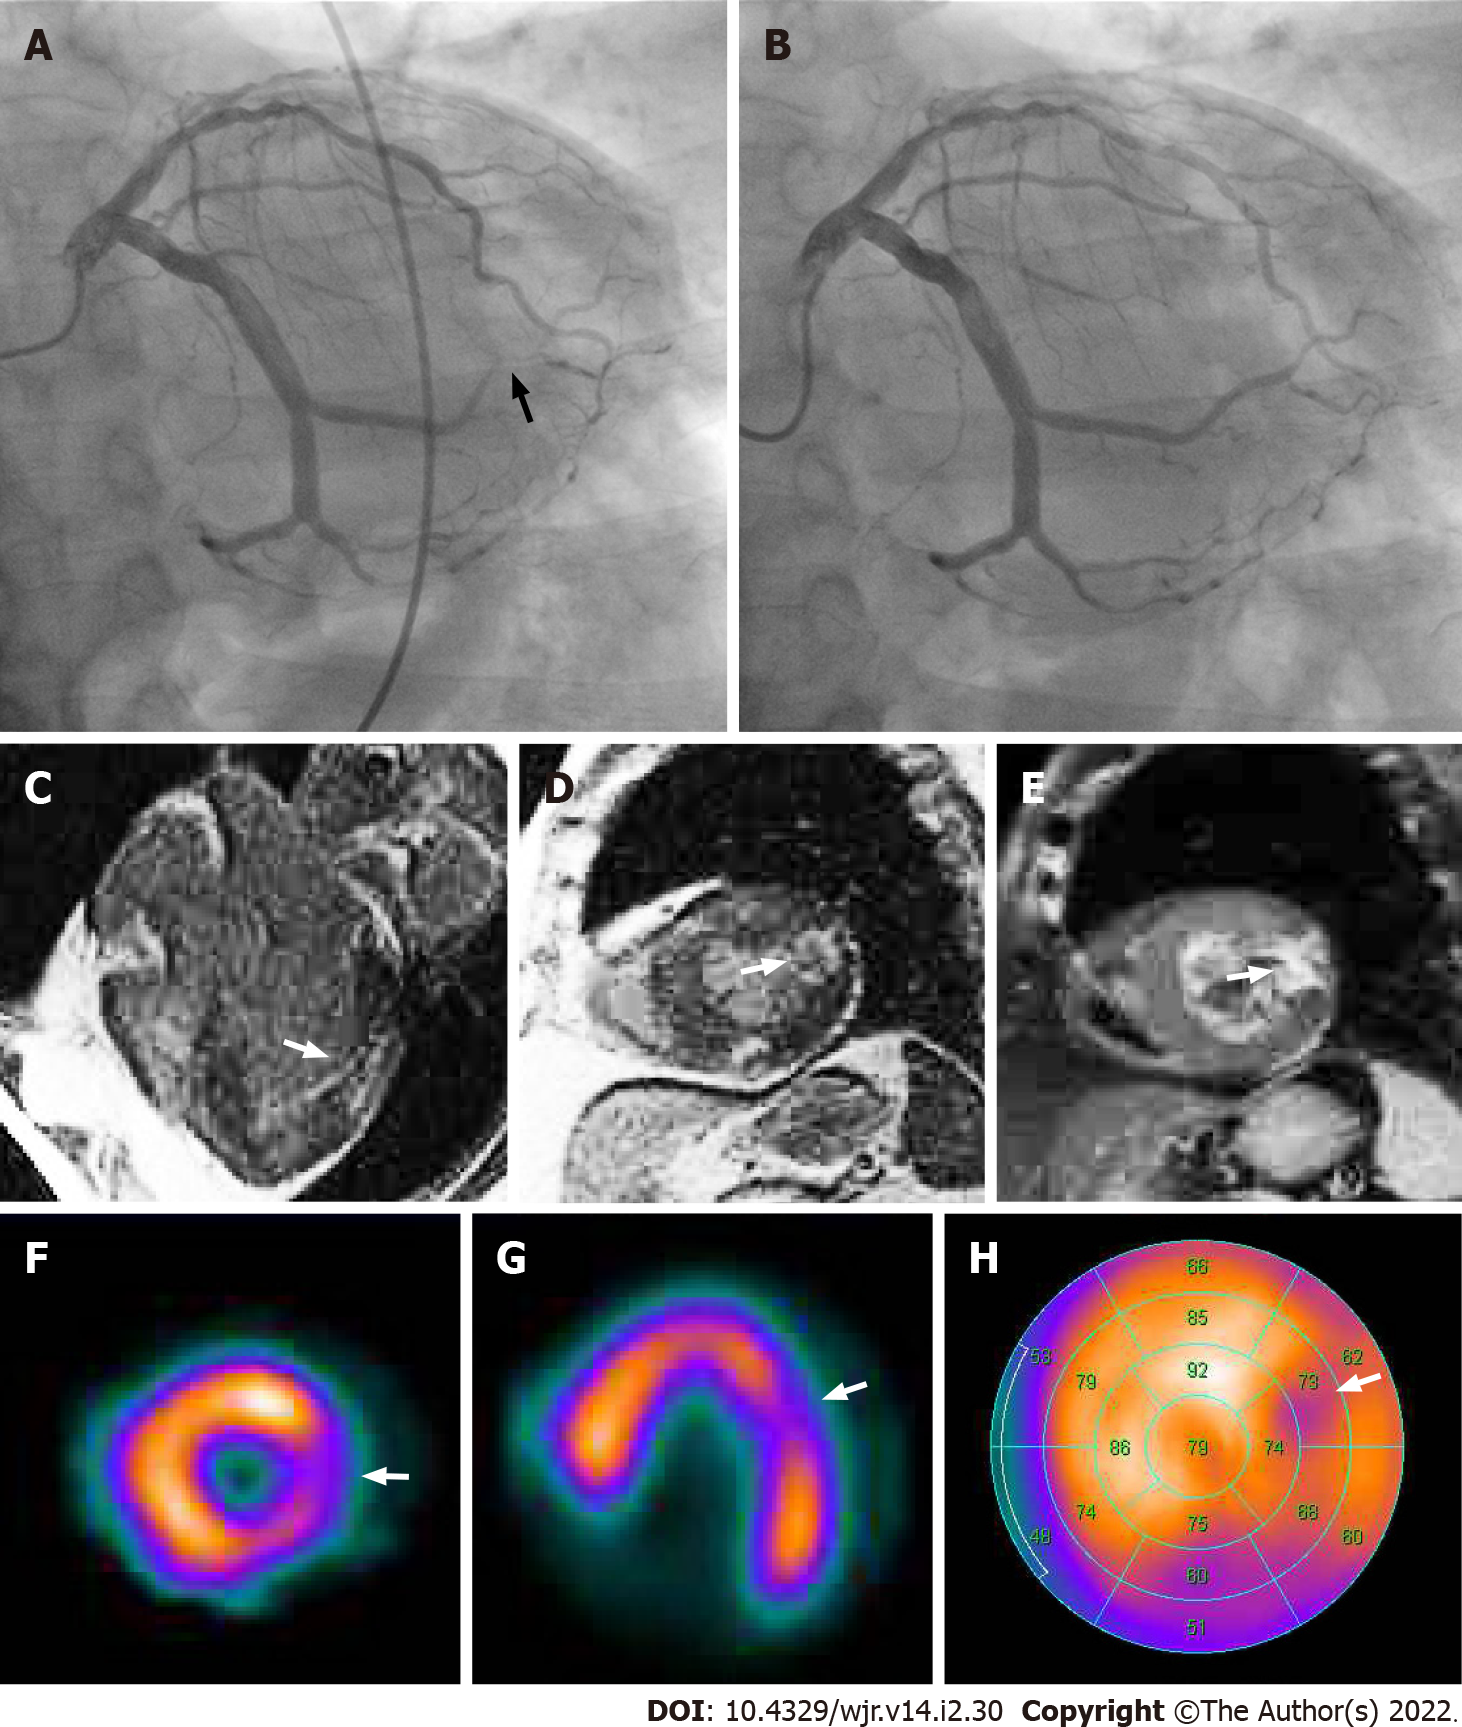
Same patient as Figure 6. A: Invasive coronary angiography showed 99% stenosis in the posterolateral branch of the left circumflex coronary artery (arrow). B: Subsequent percutaneous coronary intervention was performed by balloon angioplasty and stent implantation. His laboratory data showed elevation of cardiac biomarkers (creatine kinase 1620 IU/L, creatine kinase MB 120 IU/L). Horizontal long axis (C) and short axis (D) views of the contrast-enhanced cardiac magnetic resonance imaging (MRI) showed late gadolinium enhancement in the mid lateral wall of the left ventricle (arrow). A short axis view of the T2-weighted cardiac MRI showed high signal intensity in the mid lateral wall of the left ventricle (E, arrow). Short axis (F) and horizontal long axis (G) views and a bull’s eye polar plot (H) of rest technetium-99m tetrofosmin single-photon emission computed tomography myocardial perfusion imaging showed hypoperfusion in the mid lateral wall of the left ventricle (arrows).
Figure 8 Non-electrocardiogram-gated contrast-enhanced computed tomography images in acute coronary syndrome of right coronary artery.
A 67-year-old man with chest pain underwent non-electrocardiogram (ECG)-gated contrast-enhanced computed tomography (CECT) in search of aortic dissection. Axial (A), horizontal long axis (B), vertical long axis (C), and short axis (D) reformatted non-ECG-gated CECT images acquired 120 s after contrast injection showed decreased myocardial enhancement in the basal to mid inferior, inferolateral, and inferoseptal wall of the left ventricle (arrowheads).
Figure 9 Corresponding invasive coronary angiography and sestamibi single-photon emission computed tomography in acute coronary syndrome of right coronary artery.
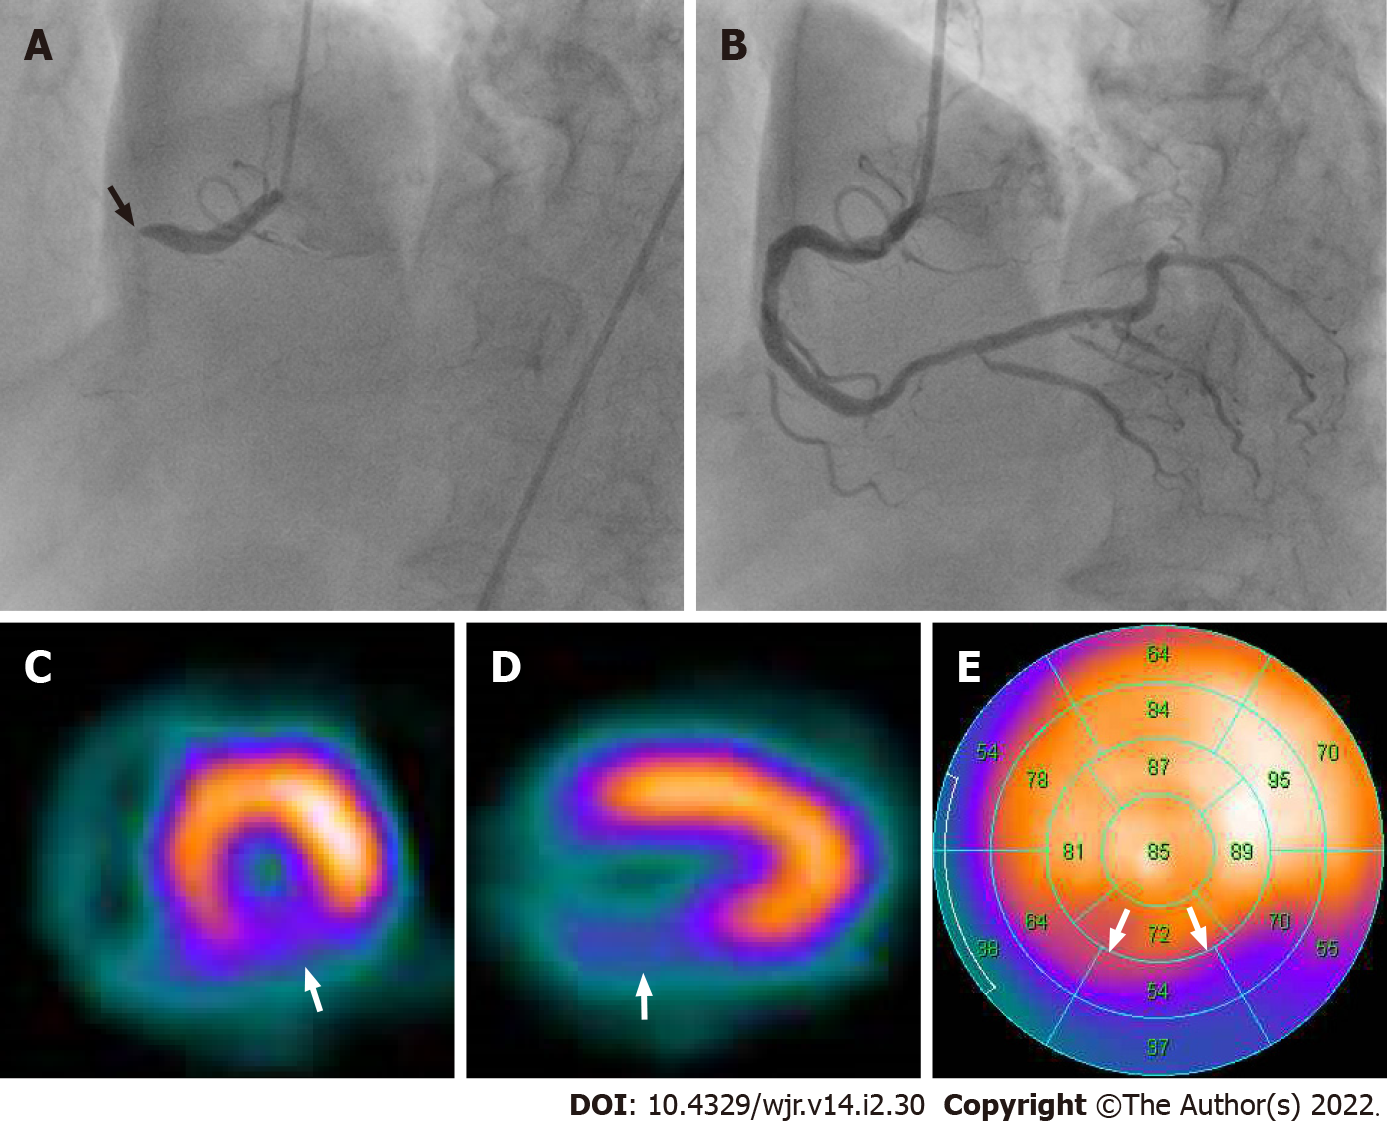
Same patient as Figure 8. A: Invasive coronary angiography showed total occlusion in the proximal site of the right coronary artery (arrow); B: Subsequent percutaneous coronary intervention was performed by balloon angioplasty and stent implantation. His laboratory data showed elevation of cardiac biomarkers (creatine kinase 1620 IU/L, creatine kinase MB 239 IU/L). Short axis (C) and vertical long axis (D) views and a bull’s eye polar plot (E) of rest technetium-99m sestamibi single-photon emission computed tomography myocardial perfusion imaging showed perfusion defect in the basal to mid inferior, inferolateral and inferoseptal wall of the left ventricle (arrows).
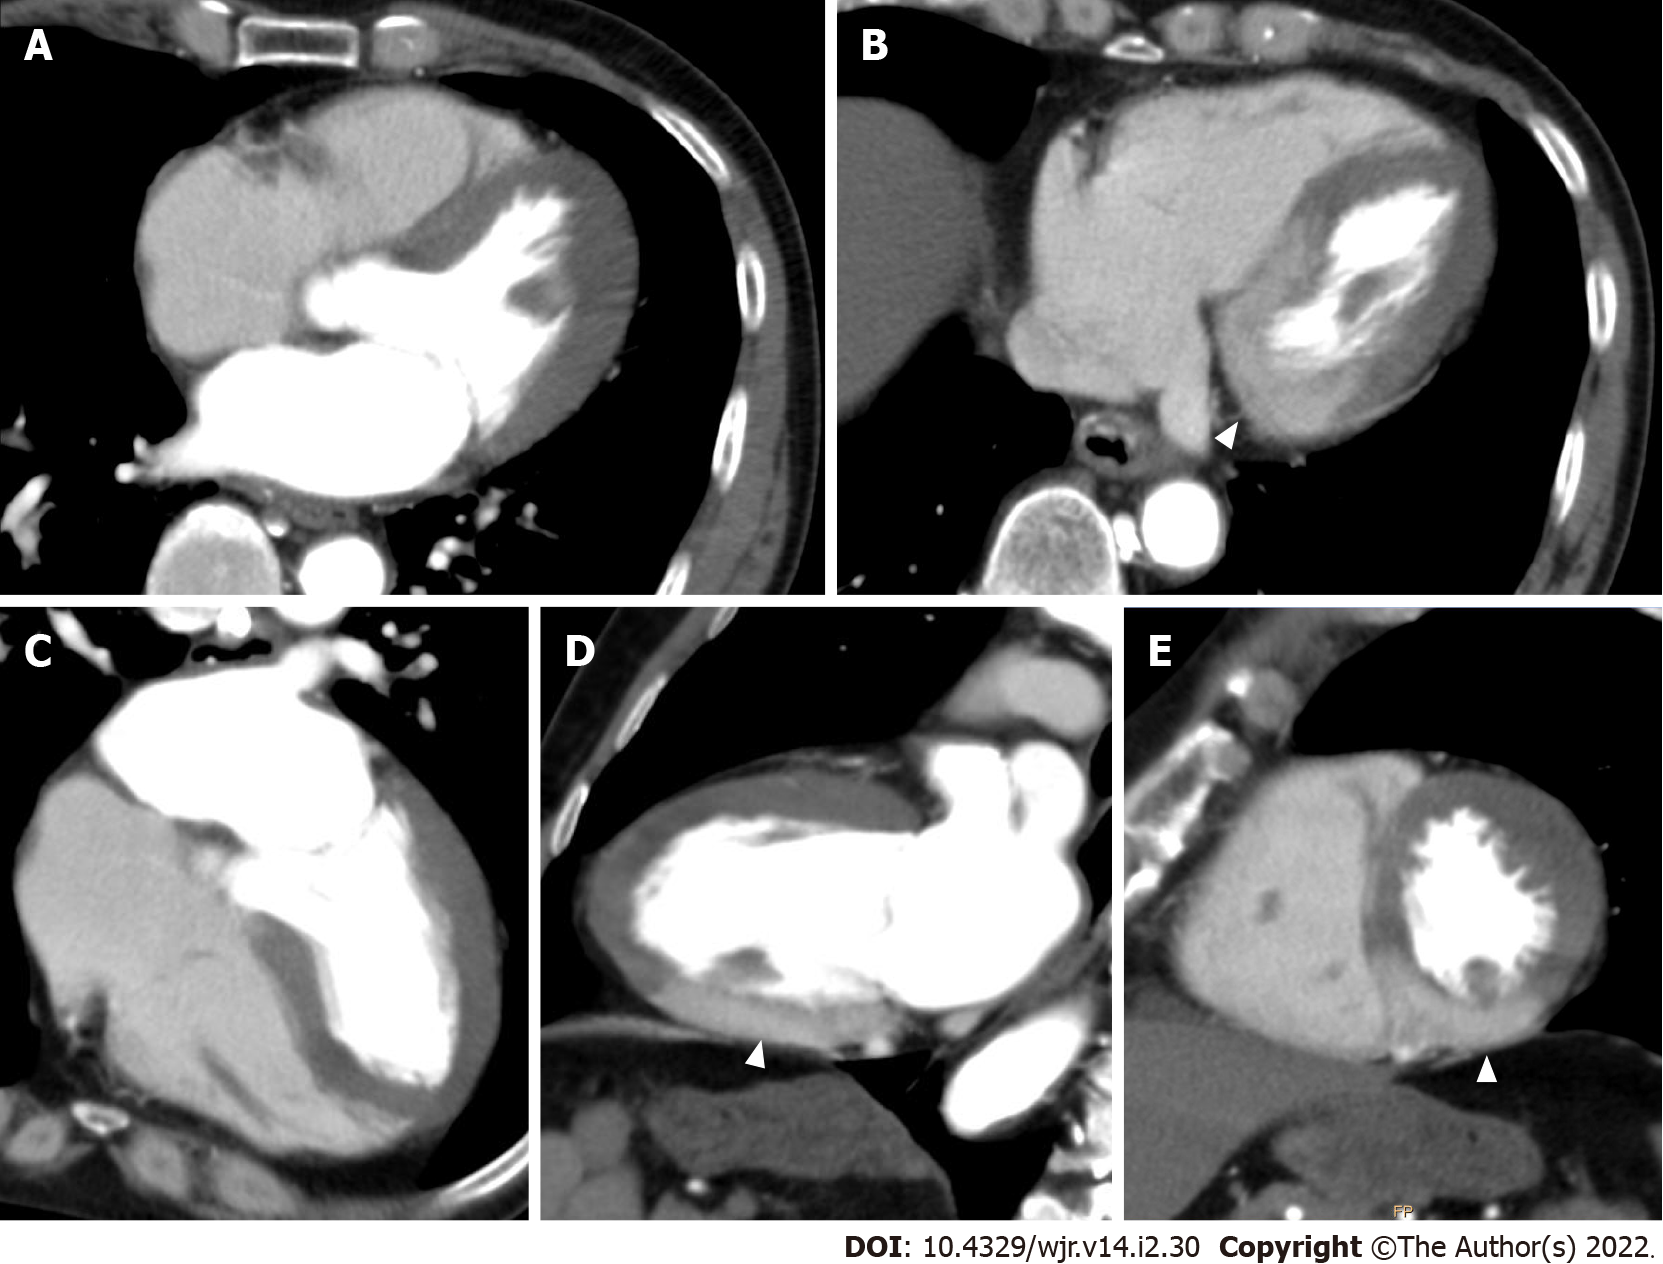
Figure 10 Non-electrocardiogram-gated contrast-enhanced computed tomography images in acute coronary syndrome of left main trunk.
A 70-year-old man with severe dyspnea underwent non-electrocardiogram (ECG)-gated contrast-enhanced computed tomography (CECT) for discriminating acute pulmonary thromboembolism. Axial (A, B), horizontal long axis (C), vertical long axis (D), and short axis (E) reformatted non-ECG-gated CECT images acquired 120 s after contrast injection showed localized myocardial enhancement only in the basal to mid inferior wall of the left ventricle (arrowheads).
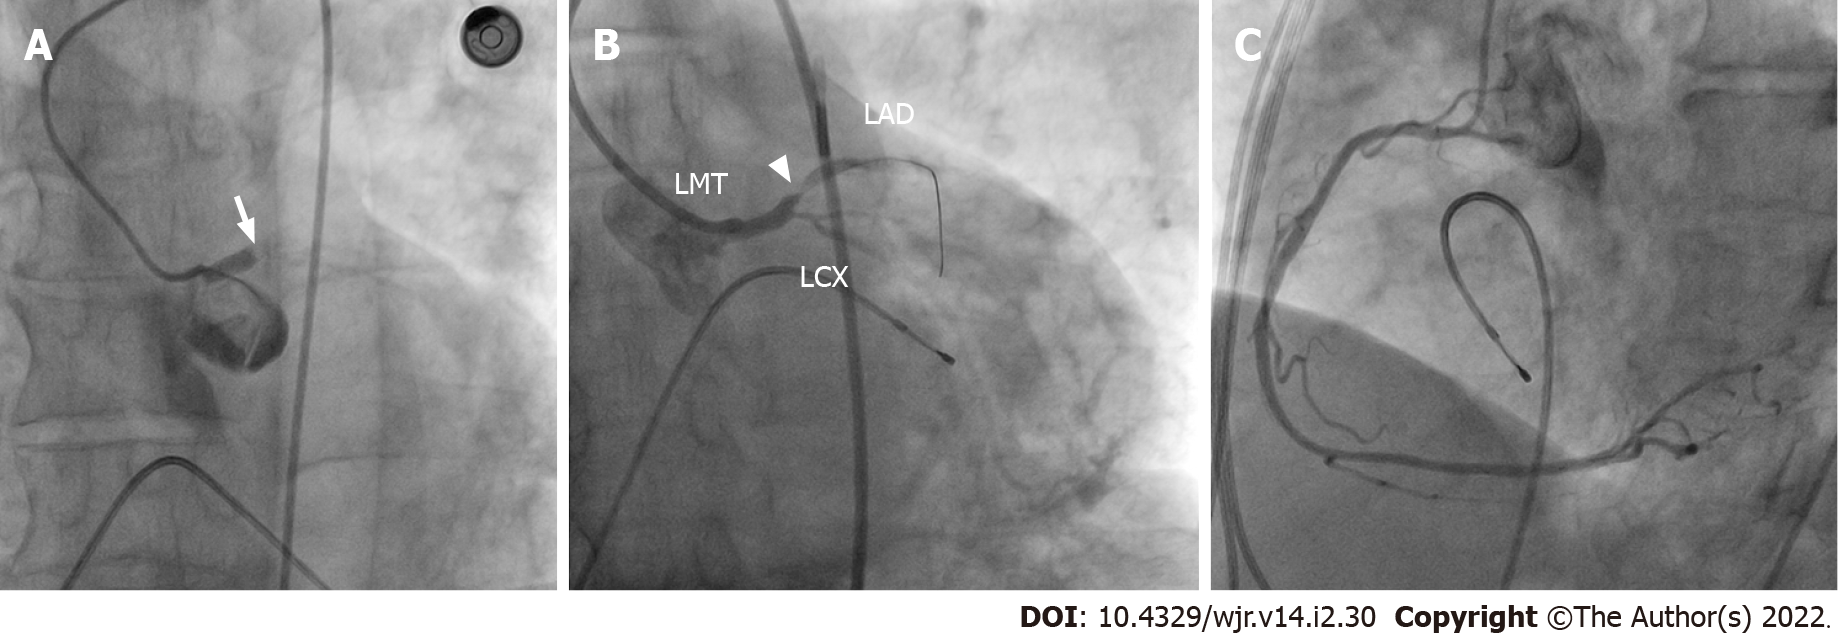
Figure 11 Corresponding invasive coronary angiography in acute coronary syndrome of left main trunk.
Same patient as Figure 10. A: Invasive coronary angiography showed thrombotic occlusion in the left main trunk (arrow). Subsequent percutaneous coronary intervention (PCI) was tried. B: After guidewire was crossed to the left anterior descending artery, there was minimal improvement in flow and 99% stenosis in the proximal site of the left anterior descending artery appeared (arrowhead); C: The right coronary artery showed no significant stenosis. The patient died during PCI because of uncontrollable ventricular fibrillation. LMT: Left main trunk; LAD: Left anterior descending artery; LCX: Left circumflex coronary artery.
Figure 12 Non-electrocardiogram-gated contrast-enhanced computed tomography images in postinfarct cardiac free wall rupture.
A: An 81-year-old man with syncope first underwent non-electrocardiogram (ECG)-gated non-contrast whole body computed tomography (CT), and moderate pericardial effusion was found. The attenuation value of the pericardial effusion was about 50 Hounsfield units. Subsequently, non-ECG-gated contrast-enhanced CT (CECT) was performed in search of ascending aortic dissection. Axial (B), short axis (C), and horizontal long axis (D) reformatted non-ECG-gated CECT images acquired 120 s after contrast injection showed decreased myocardial enhancement in the basal to mid lateral wall of the left ventricle (arrowheads) and a small myocardial defect (arrow).
Figure 13 Corresponding invasive coronary angiography in postinfarct cardiac free wall rupture.
Same patient as Figure 12. A: Invasive coronary angiography showed total occlusion in the distal site of the left circumflex coronary artery (arrow); B: The right coronary artery showed no significant stenosis. The patient subsequently underwent a surgical operation. After removal of the large clot within the pericardium, a small perforation was found in the lateral wall of the left ventricle, confirming a definitive diagnosis of left ventricular free wall rupture.
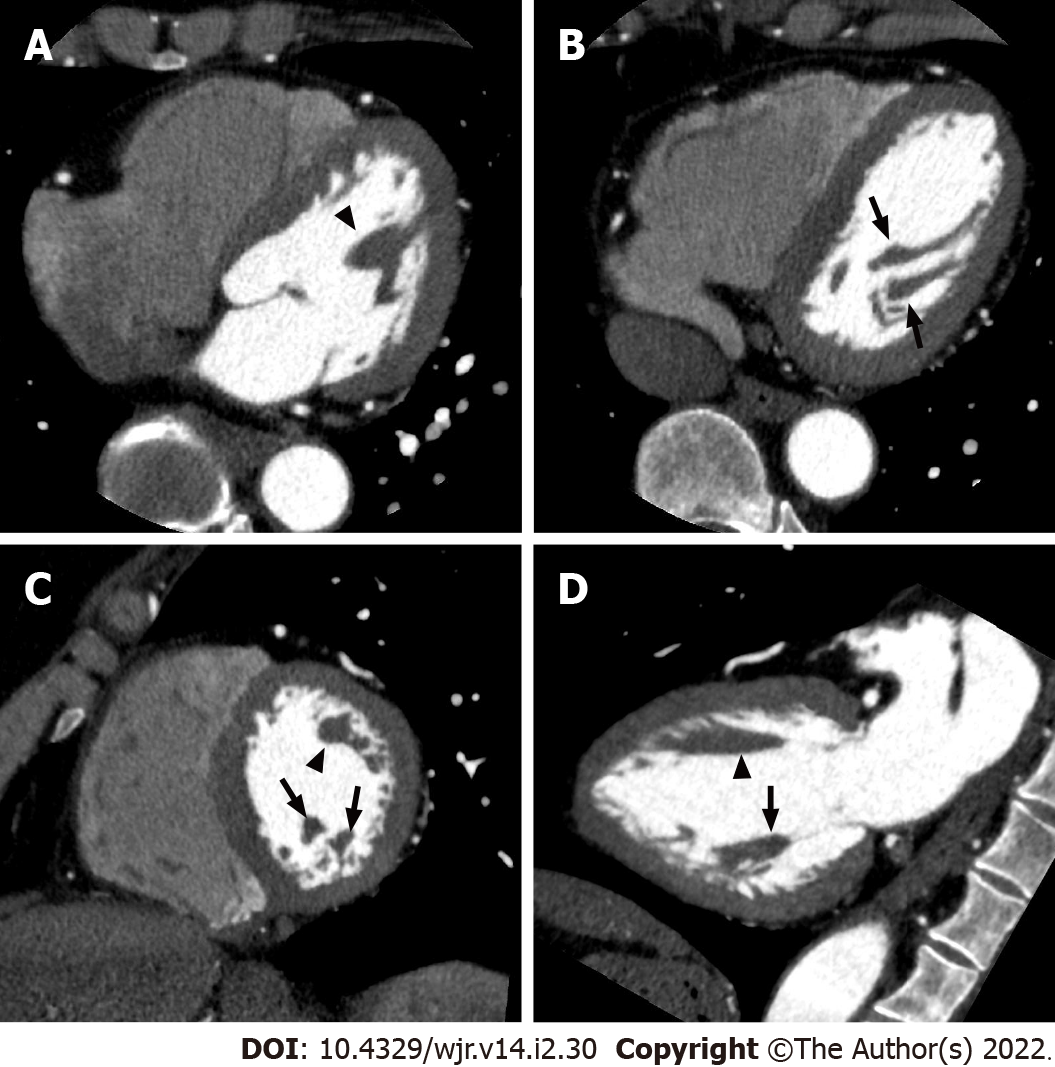
Figure 14 Left ventricular papillary muscles.
Axial (A, B), short axis (C), and vertical long axis (D) reformatted electrocardiogram-gated cardiac CT images showing the anatomy of the left ventricular chamber of the normal heart. The anterolateral (arrowheads) and posteromedial (arrows) papillary muscles manifest as filling defects within the contrast-filled left ventricular lumen.
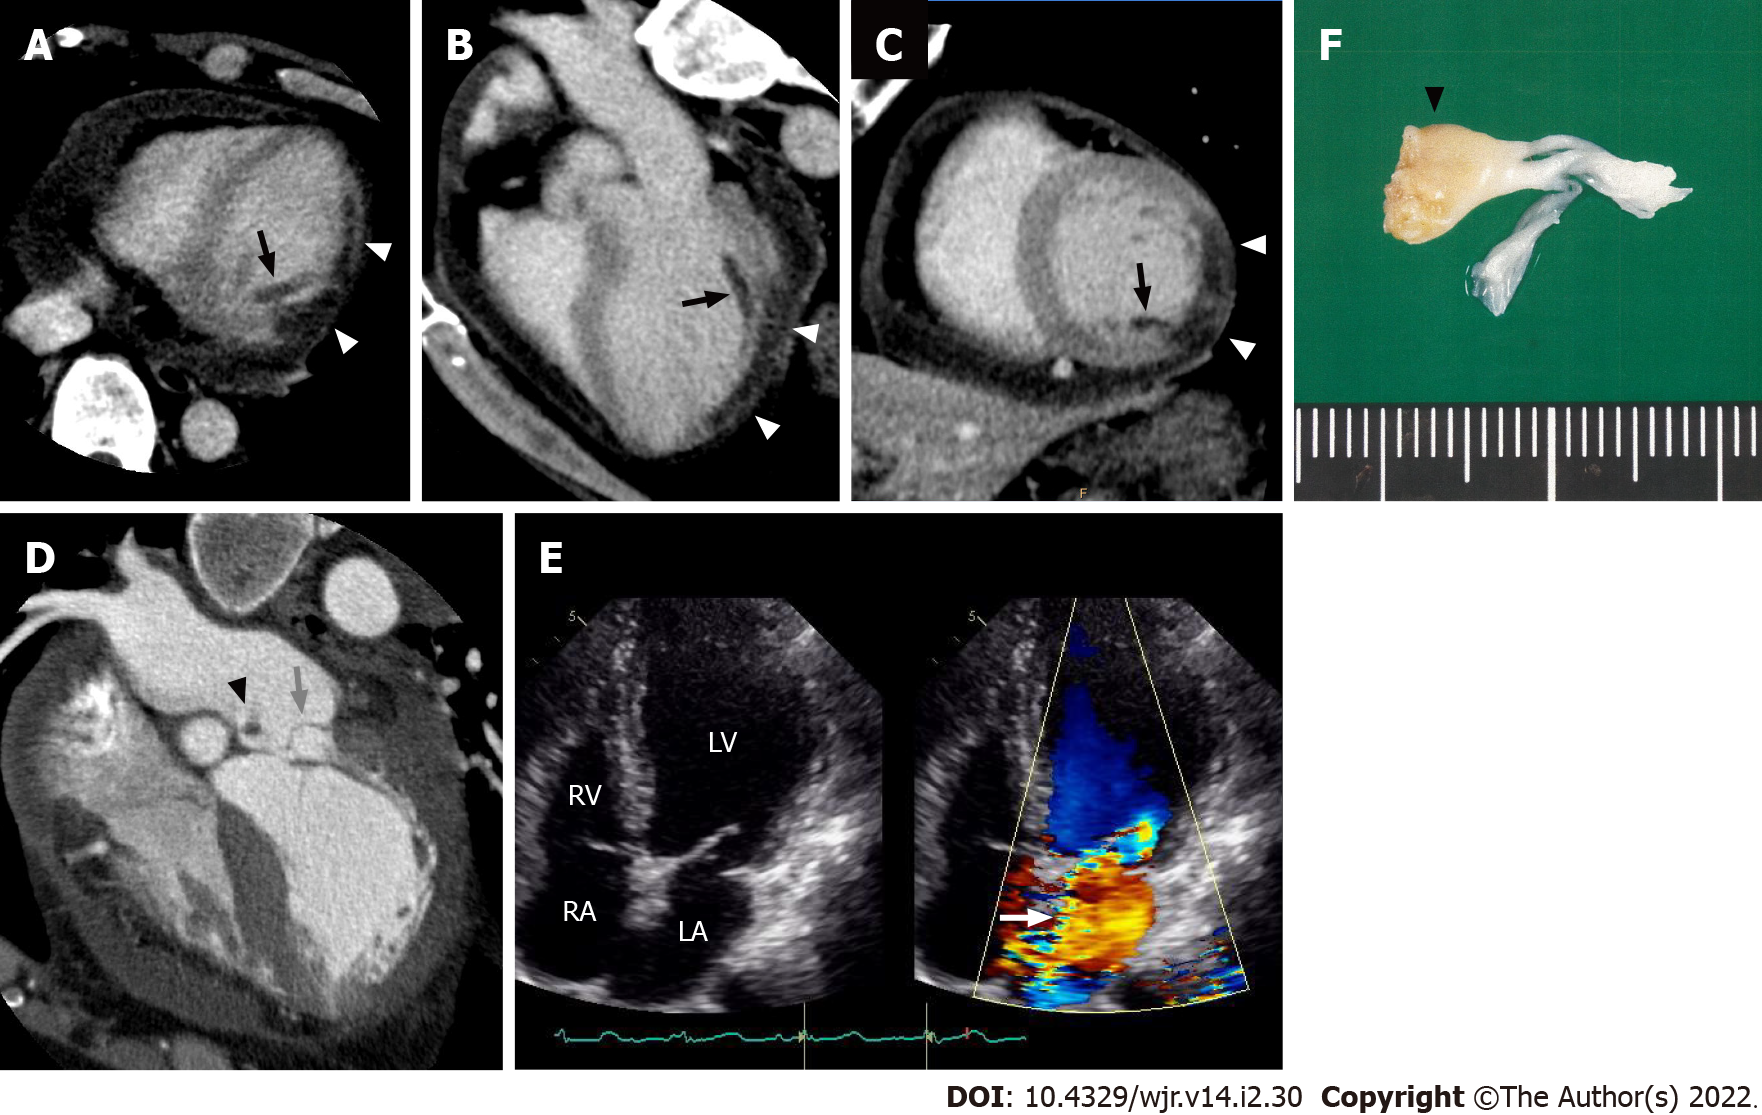
Figure 15 Postinfarct left ventricular papillary muscle rupture.
Electrocardiogram-gated cardiac CT images from a 61-year-old man with posteromedial papillary muscle rupture complicated by acute ST elevation myocardial infarction due to total occlusion of the left circumflex coronary artery. Axial (A), three-chamber (B), and short axis (C) reformatted cardiac CT images showed decreased myocardial enhancement in the inferolateral wall (white arrowheads) and posteromedial papillary muscle (black arrows) of the left ventricle. A horizontal long axis image (D) showed severe prolapse of the posterior mitral valve leaflet into the left atrium (grey arrow) with discernible papillary muscle attachment (black arrowhead). An apical four-chamber color Doppler image of the transthoracic echocardiogram showed severe mitral regurgitation during ventricular systole extending to the posterior left atrial wall (E, white arrow). The patient subsequently underwent a mitral valve replacement. Surgical specimen showed posteromedial papillary muscle attached to the resected posterior mitral leaflet (F, black arrowhead). LV: Left ventricle; LA: Left atrium; RV: Right ventricle; RA: Right atrium.
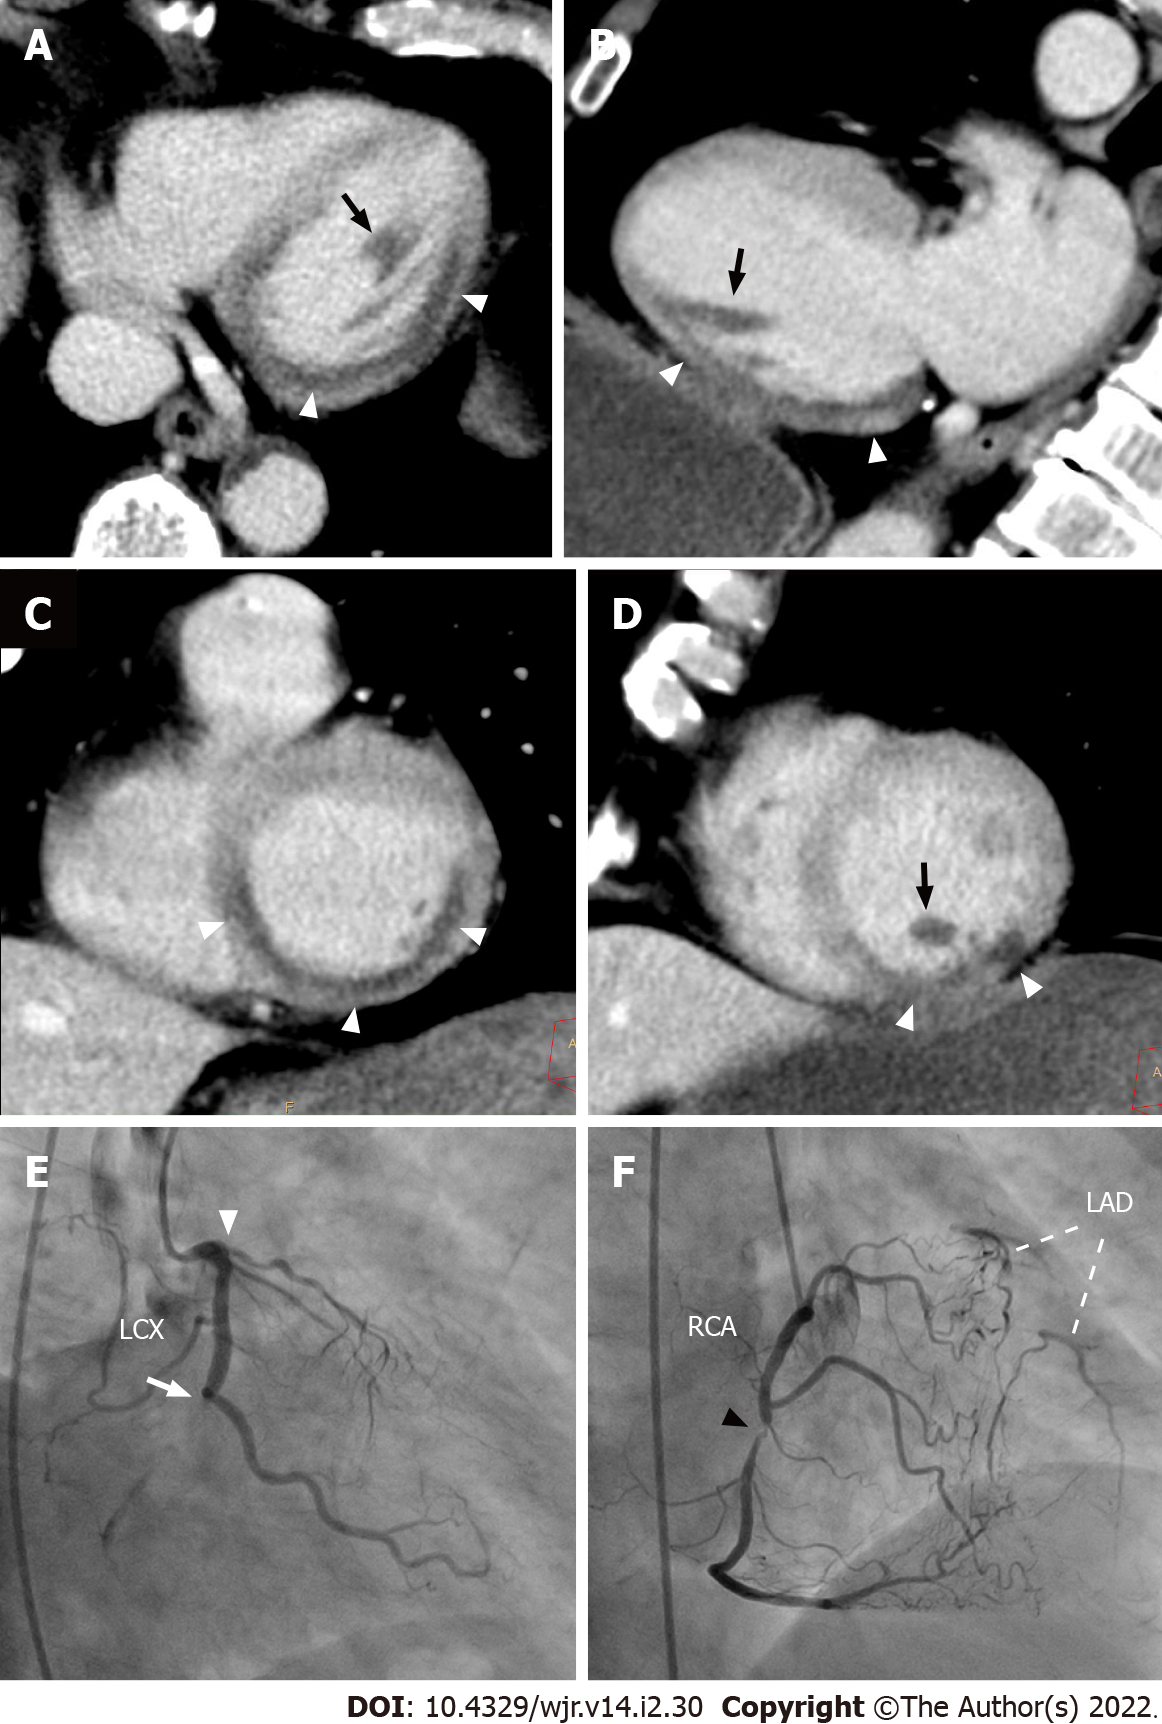
Figure 16 Myocardial perfusion defect of the posteromedial papillary muscle on non-electrocardiogram-gated contrast-enhanced computed tomography.
A 68-year-old man with right anterior chest pain underwent non-electrocardiogram (ECG)-gated contrast-enhanced computed tomography (CECT) in search of aortic dissection. Axial (A), vertical long axis (B), and short axis (C, D) reformatted non-ECG-gated CECT images acquired 120 s after contrast injection showed decreased myocardial enhancement in the basal to mid inferior, inferolateral, and inferoseptal walls of the left ventricle (arrowheads). Decreased myocardial enhancement was also recognized in the posteromedial papillary muscle (arrows). Invasive coronary angiography showed total occlusion in the distal site of the left circumflex coronary artery (E, arrow), total occlusion in the proximal site of the left anterior descending artery (E, arrowhead), and 90% stenosis in the mid site of the right coronary artery (F, arrowhead), which provides abundant collateral flow to the left anterior descending artery. The patient subsequently underwent an emergent coronary artery bypass grafting. LAD: Left anterior descending artery; LCX: Left circumflex coronary artery; RCA: Right coronary artery.
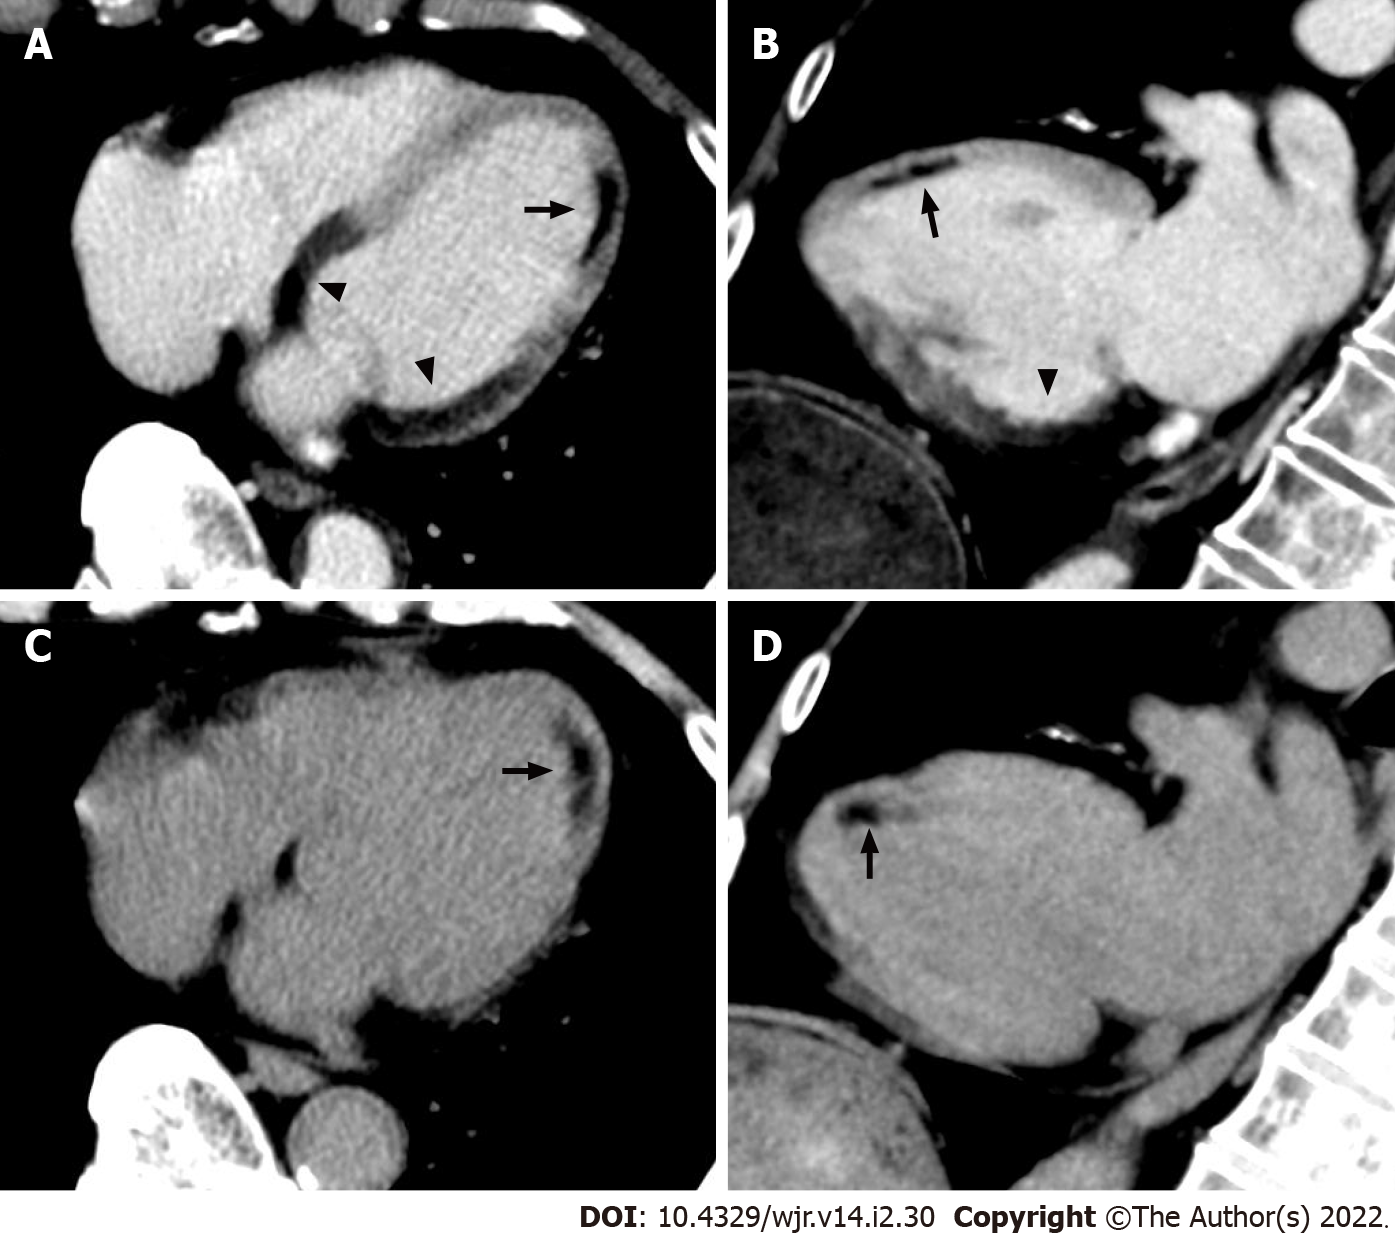
Figure 17 Non-electrocardiogram-gated contrast-enhanced computed tomography images in acute coronary syndrome of right coronary artery complicated with anterior old myocardial infarction.
An 82-year-old man with back pain underwent non-electrocardiogram (ECG)-gated contrast-enhanced computed tomography (CECT) in search of aortic dissection. Axial (A) and vertical long axis (B) reformatted non-ECG-gated CECT images acquired 120 s after contrast injection showed decreased myocardial enhancement in the basal to mid inferior, inferolateral, and inferoseptal walls of the left ventricle (arrowheads). Non-ECG-gated CECT images also showed decreased myocardial enhancement in the mid anterior wall of the left ventricle apart from the above-mentioned area (arrow). Axial (C) and vertical long axis (D) reformatted non-ECG-gated non-contrast CT images showed subendocardial low attenuation less than 0 Hounsfield units only in the mid anterior wall of the left ventricle, which is consistent with myocardial fatty degeneration associated with the old myocardial infarction (arrow).
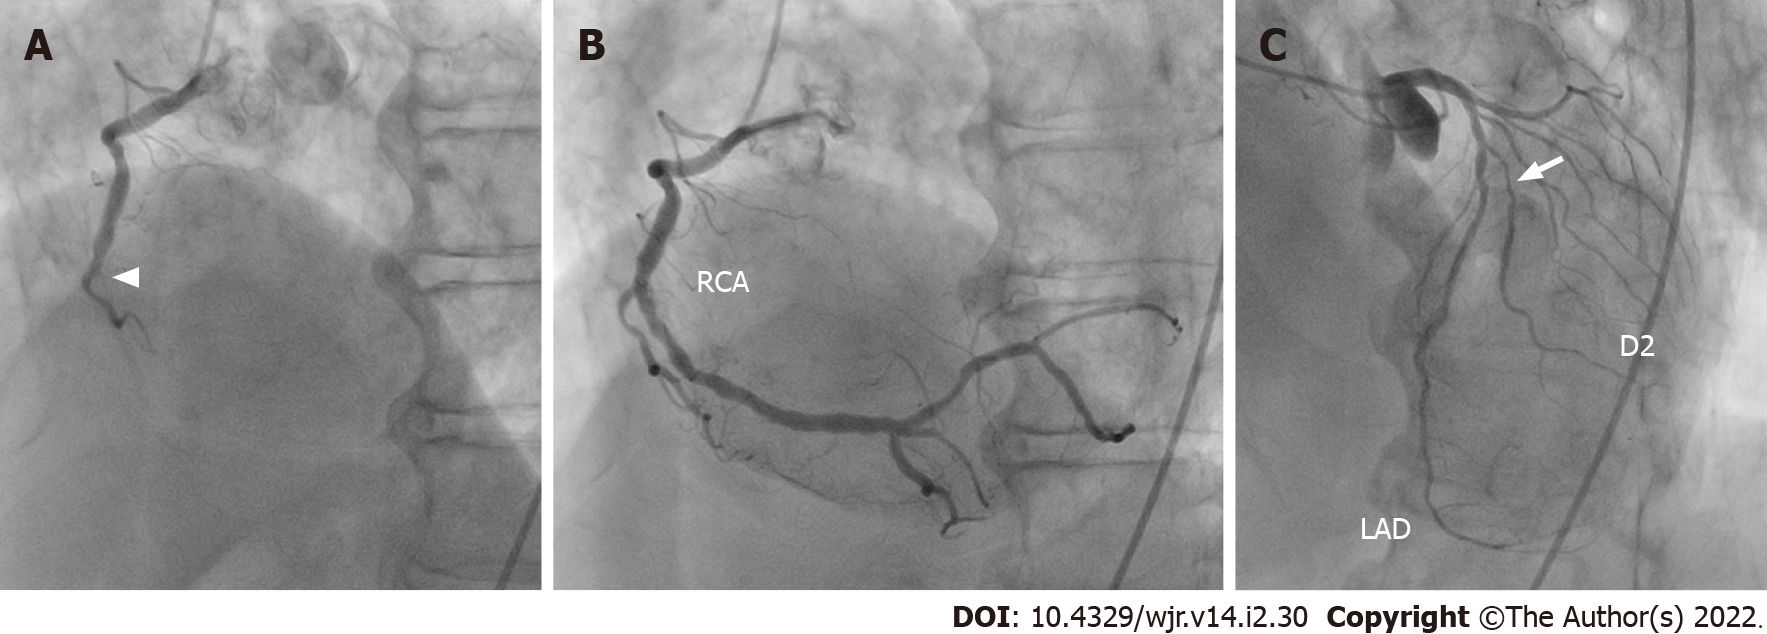
Figure 18 Corresponding invasive coronary angiography in acute coronary syndrome of right coronary artery complicated with anterior old myocardial infarction.
Same patient as Figure 17. A: Invasive coronary angiography showed total occlusion in the mid site of the right coronary artery (arrowhead); B: Subsequent percutaneous coronary intervention was performed by balloon angioplasty and stent implantation. C: Invasive coronary angiography also showed 75% stenosis in the proximal site of the second diagonal branch (arrow). RCA: Right coronary artery; LAD: Left anterior descending artery; D2: Second diagonal branch.
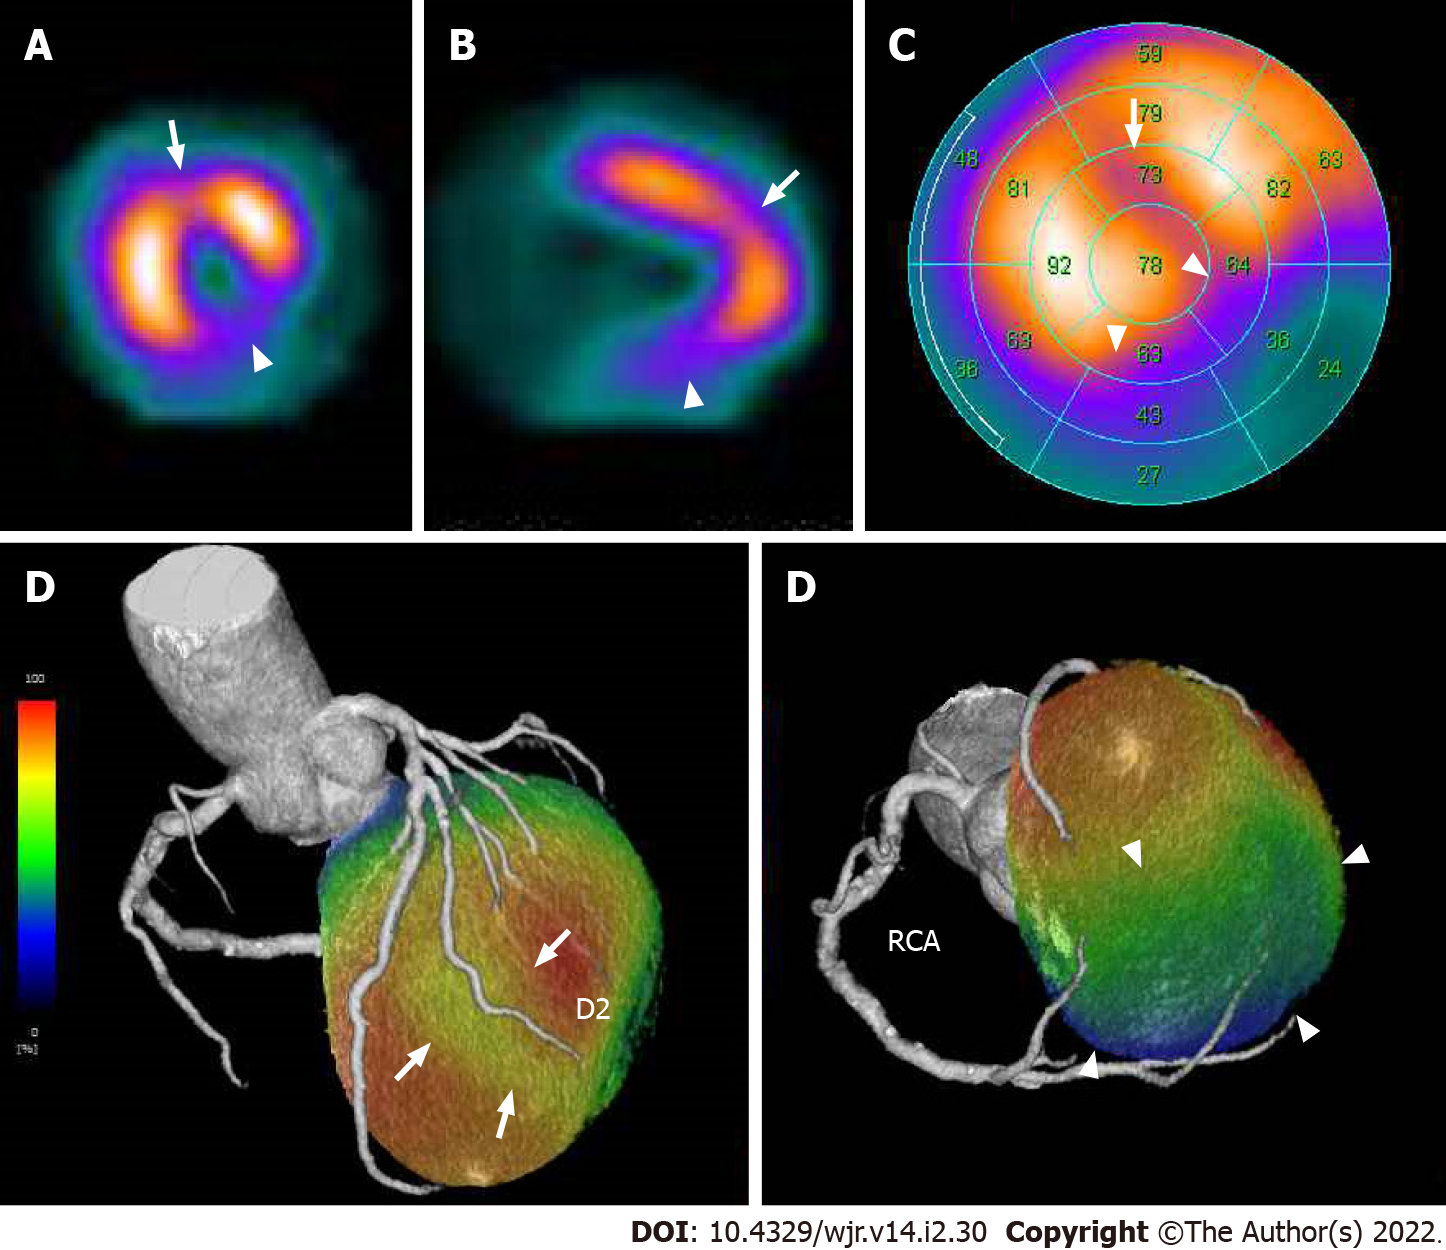
Figure 19 Corresponding sestamibi single-photon emission computed tomography in acute coronary syndrome of right coronary artery complicated with anterior old myocardial infarction.
Same patient as Figures 17 and 18. Rest technetium-99m sestamibi single-photon emission computed tomography (SPECT) myocardial perfusion imaging (MPI) are shown. Short axis (A) and vertical long axis (B) views and a bull’s eye polar plot (C) of rest technetium-99m sestamibi SPECT MPI showed perfusion defects in the basal to mid inferior, inferolateral, and inferoseptal walls of the left ventricle (arrowheads). In addition, SPECT MPI also showed hypoperfusion in the mid anterior wall of the left ventricle (arrows). The volume-rendered, coregistered SPECT MPI, and cardiac CT images demonstrated that hypoperfusion in the mid anterior wall of the left ventricle seen on the SPECT MPI corresponded with the territory of the second diagonal branch (D, arrows), whereas the perfusion defects in the basal to mid inferior, inferolateral, and inferoseptal walls of the left ventricle seen on the SPECT MPI corresponded with the territory of the right coronary artery (D, arrowheads). LAD: Left anterior descending artery, D2: Second diagonal branch; RCA: Right coronary artery.
- Citation: Yoshihara S. Acute coronary syndrome on non-electrocardiogram-gated contrast-enhanced computed tomography. World J Radiol 2022; 14(2): 30-46
- URL: https://www.wjgnet.com/1949-8470/full/v14/i2/30.htm
- DOI: https://dx.doi.org/10.4329/wjr.v14.i2.30


