©The Author(s) 2020.
World J Radiol. May 28, 2020; 12(5): 76-86
Published online May 28, 2020. doi: 10.4329/wjr.v12.i5.76
Published online May 28, 2020. doi: 10.4329/wjr.v12.i5.76
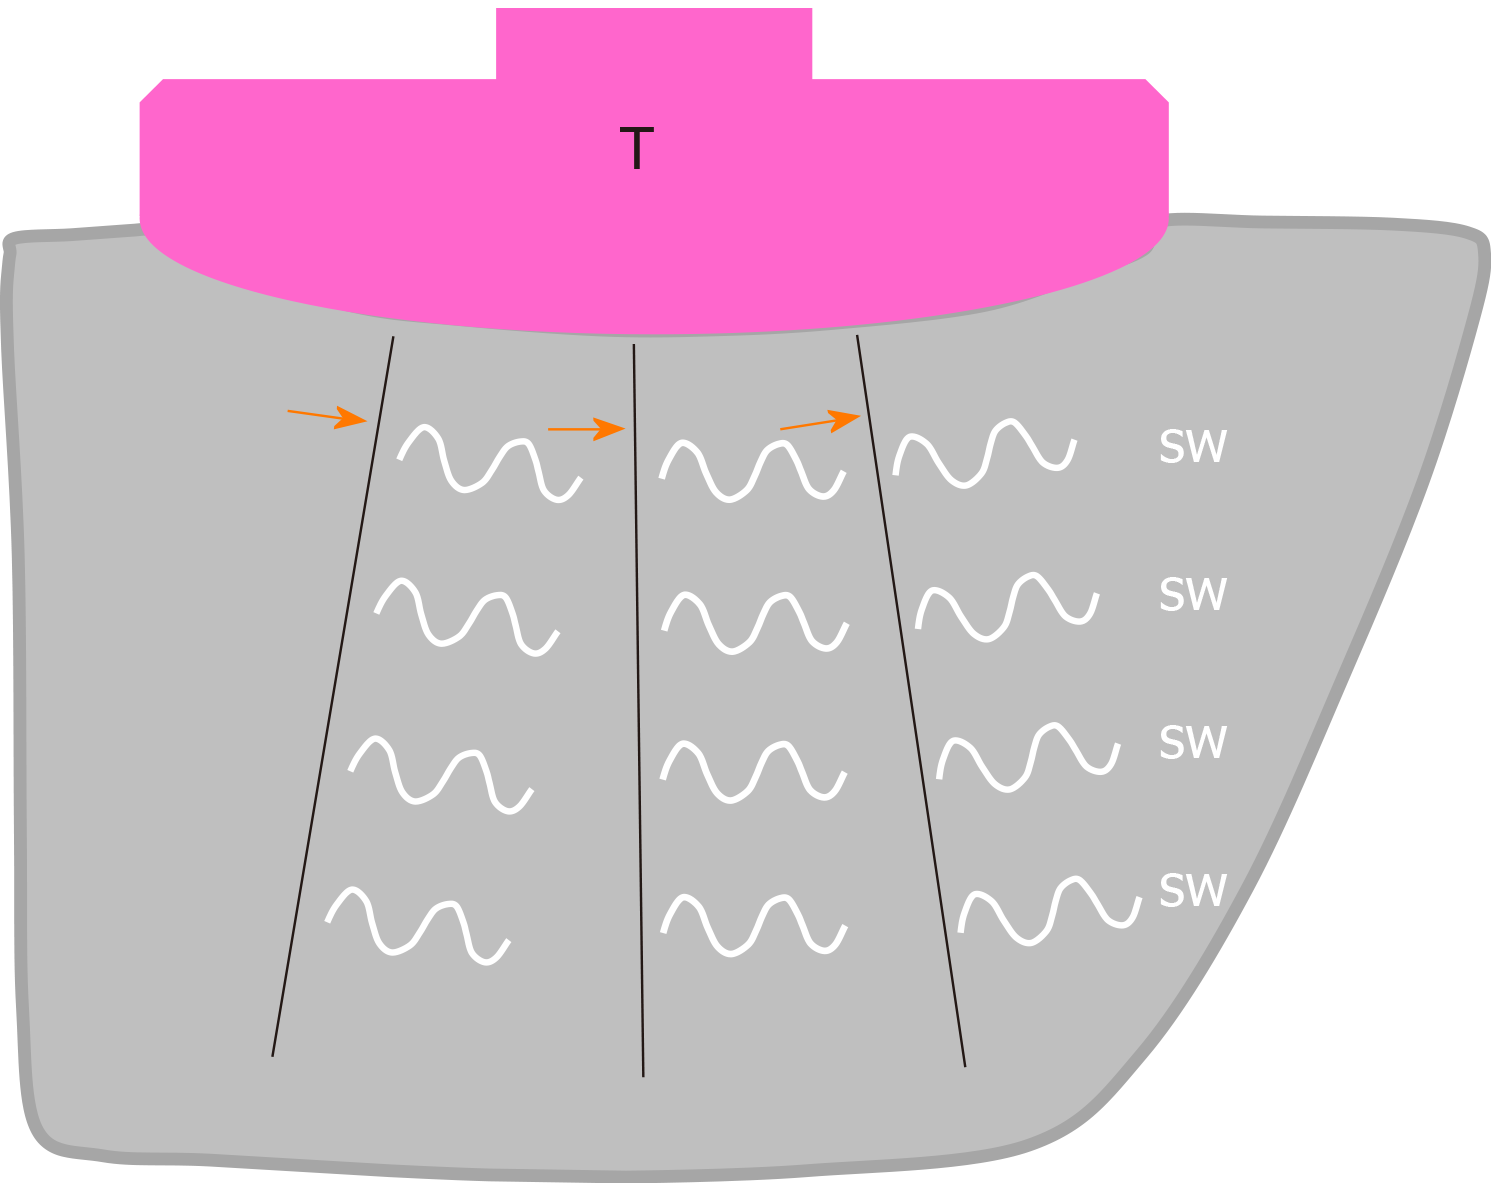
Figure 1 Schematic drawing of two-dimensional shear wave elastography in a healthy individual.
Multiple push-pulses (arrows) are emitted from the transducer to create shear waves. T: Transducer; SW: Shear wave.
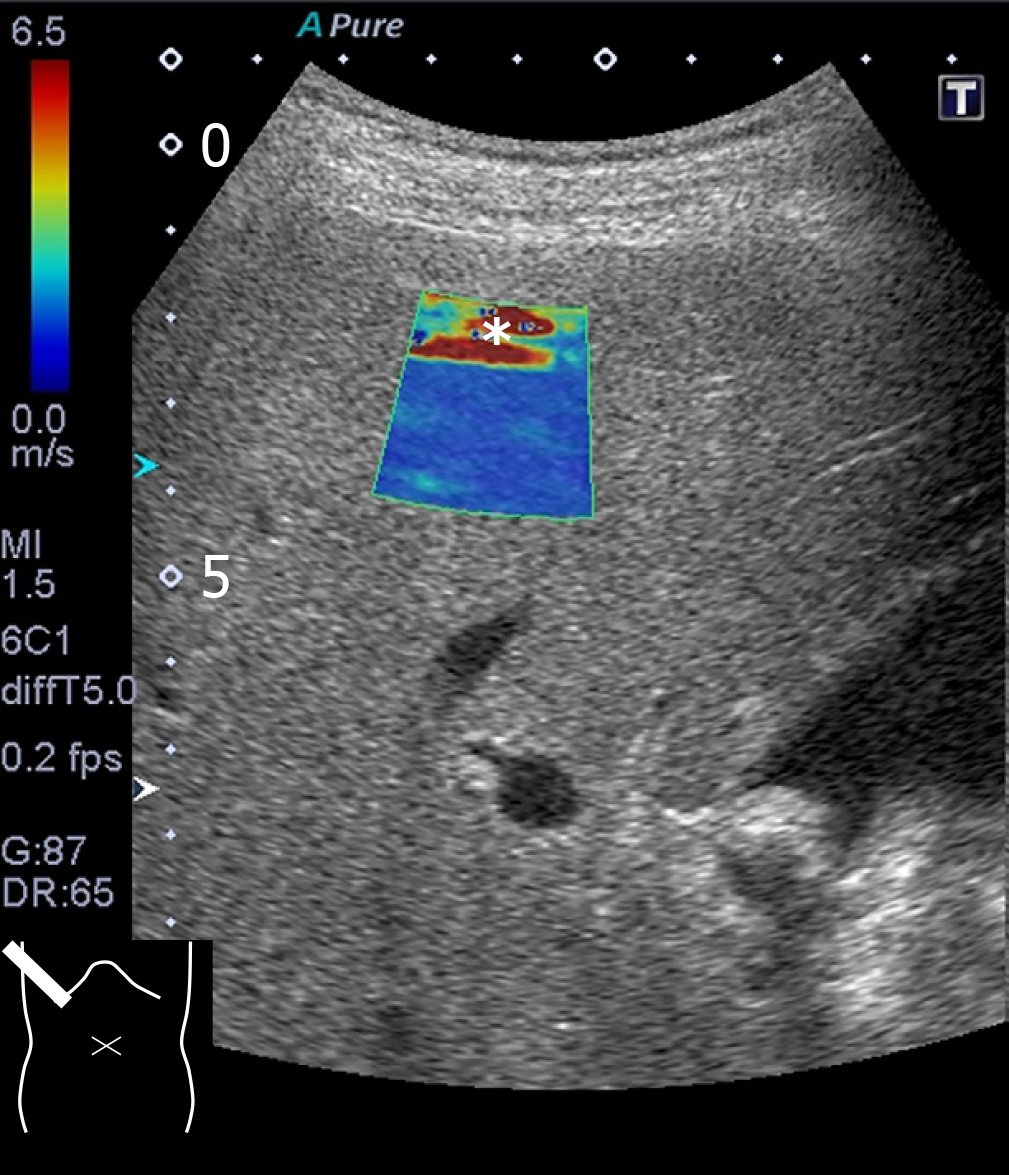
Figure 2 Reverberation artifact.
The cursor contains a red (falsely increased shear wave) area (asterisk) at the top.
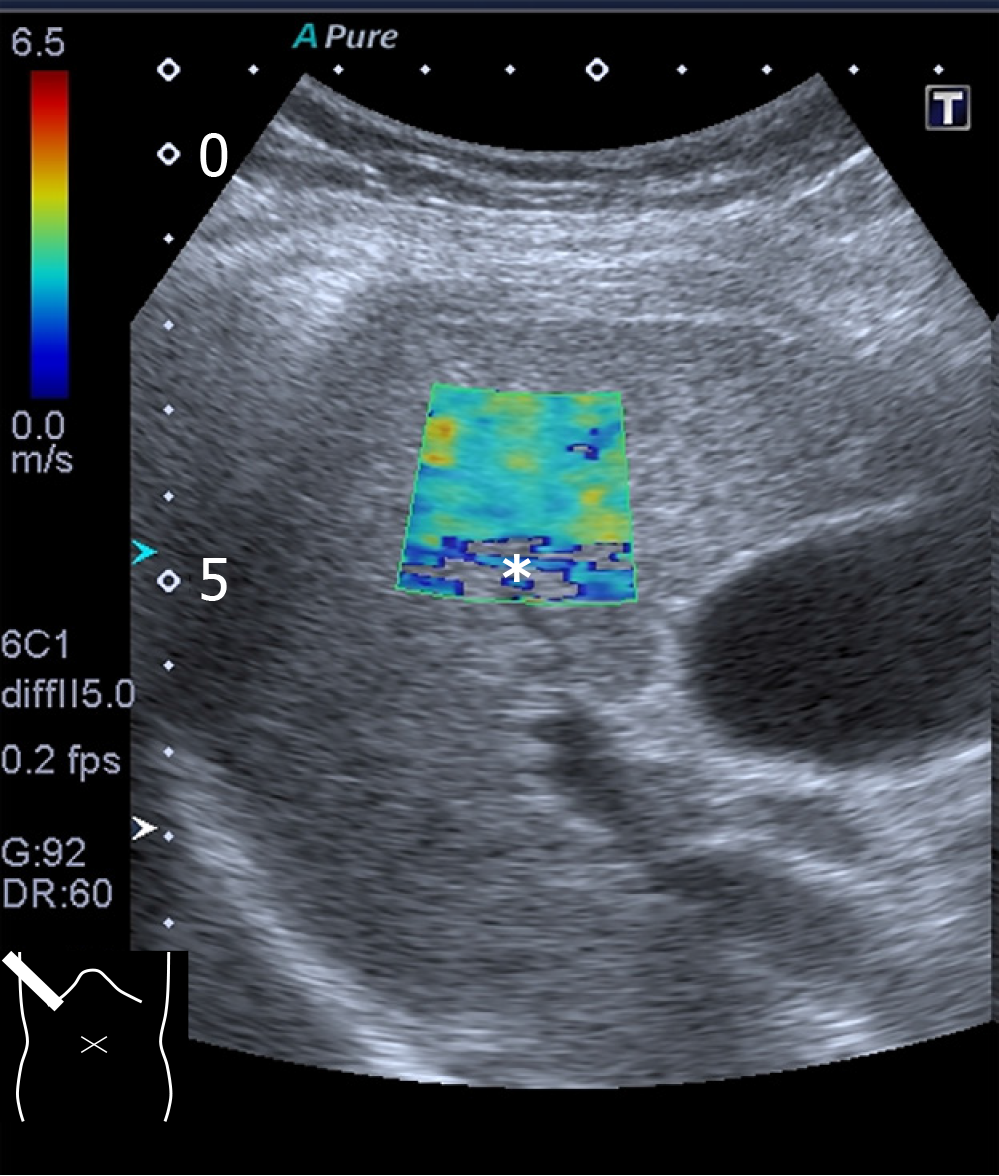
Figure 3 Attenuation artifact.
The cursor includes a colorless area (asterisk indicating poor acquisition of shear wave data) at the bottom.
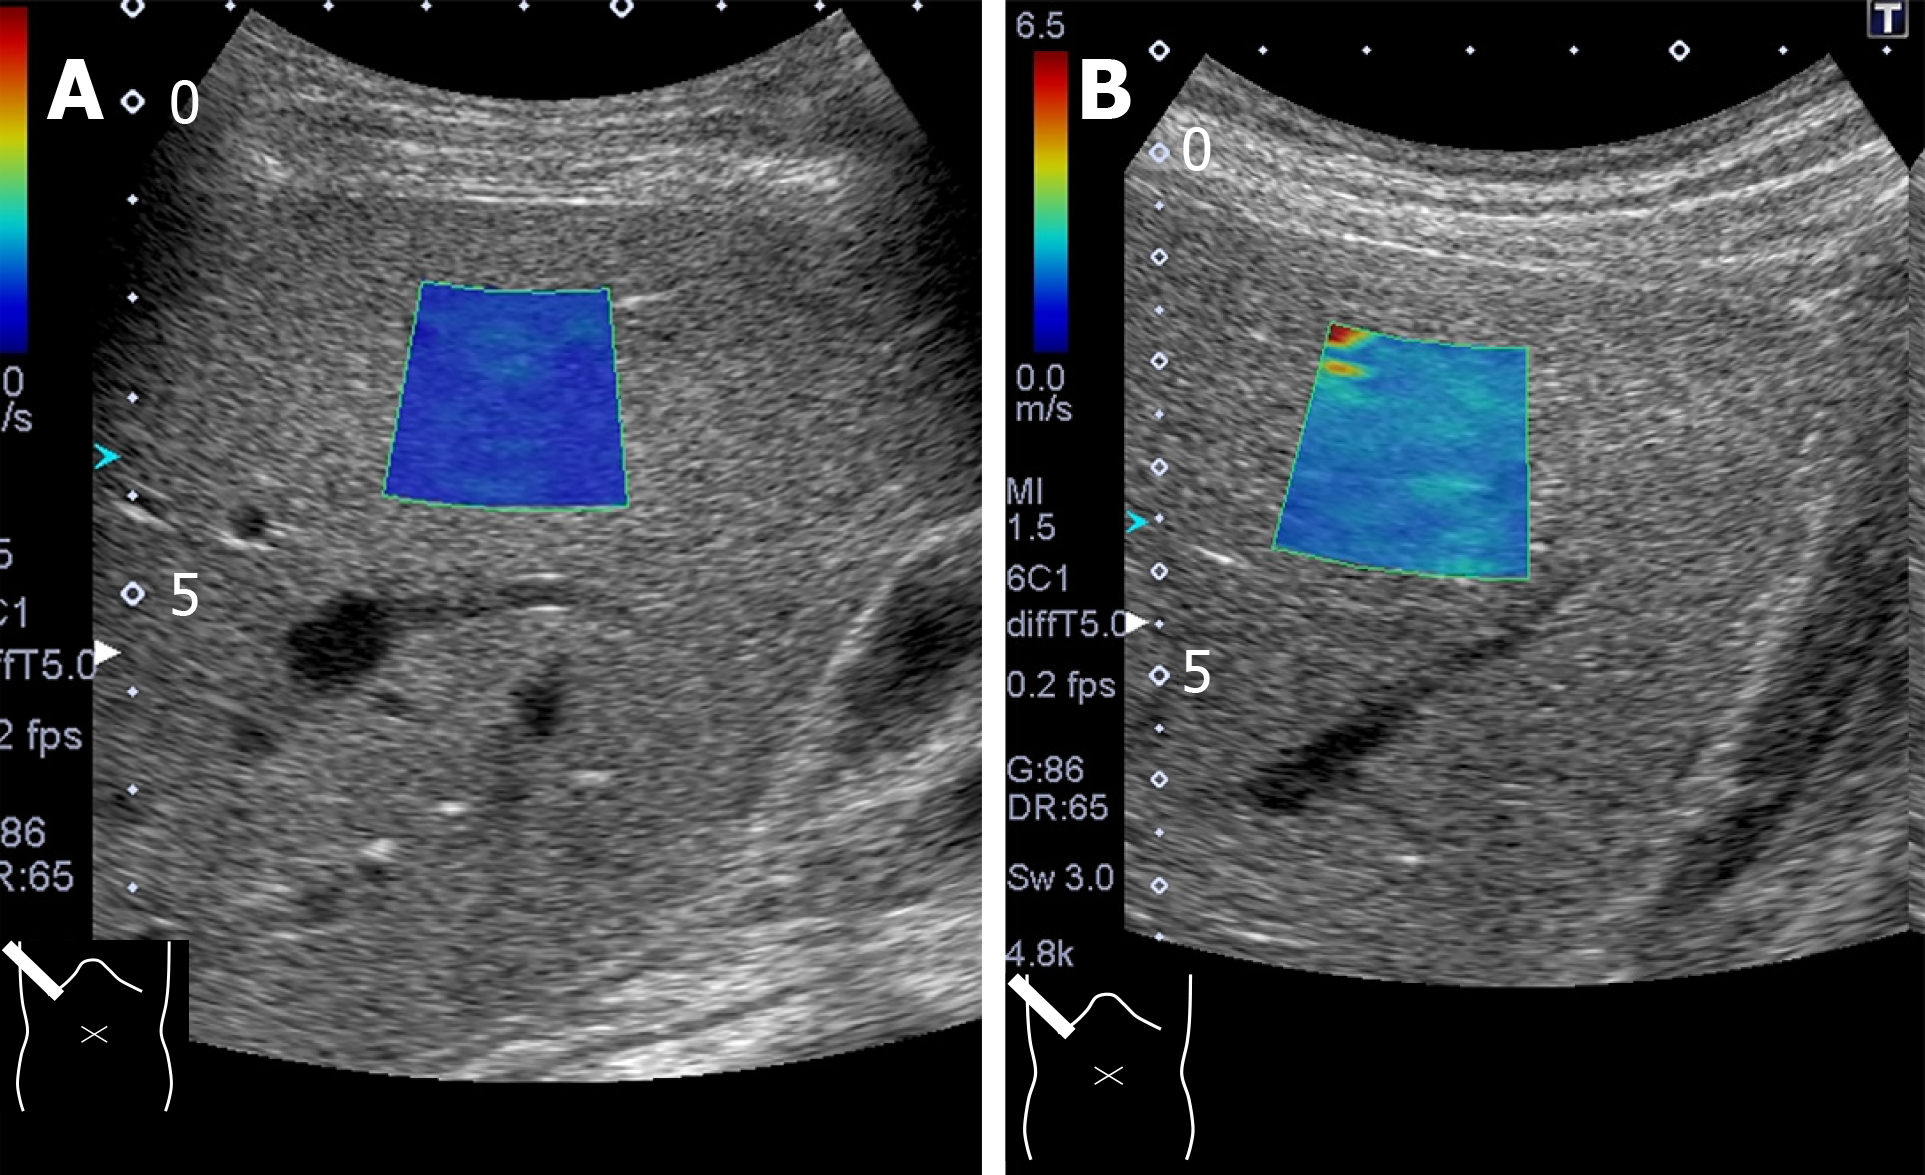
Figure 4 Probe compression artifact.
Excessive probe compression gives rise to falsely increased shear wave values. A: Note that shear wave speed is 1.2 ± 0.06 m/s measured through an intercostal space; B: Changes to 2.0 ± 0.13 m/s through subcostal scanning under probe compression.
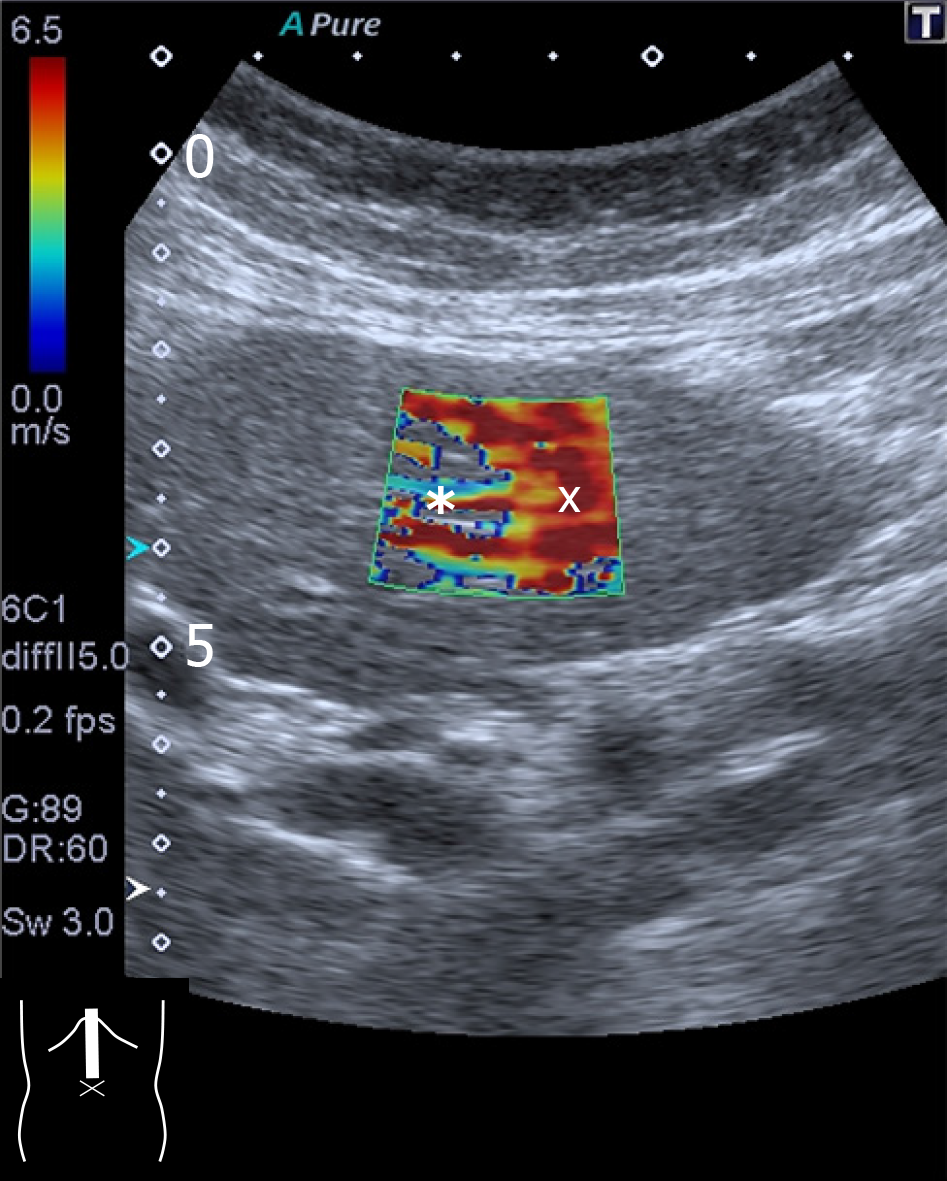
Figure 5 Motion artifact.
Two-dimensional shear wave elastography of the liver left lobe shows this characteristic finding of a colorless area (asterisk), suggesting inaccurate measurement of shear wave values. The reddish part (×) of the cursor is also unreliable.
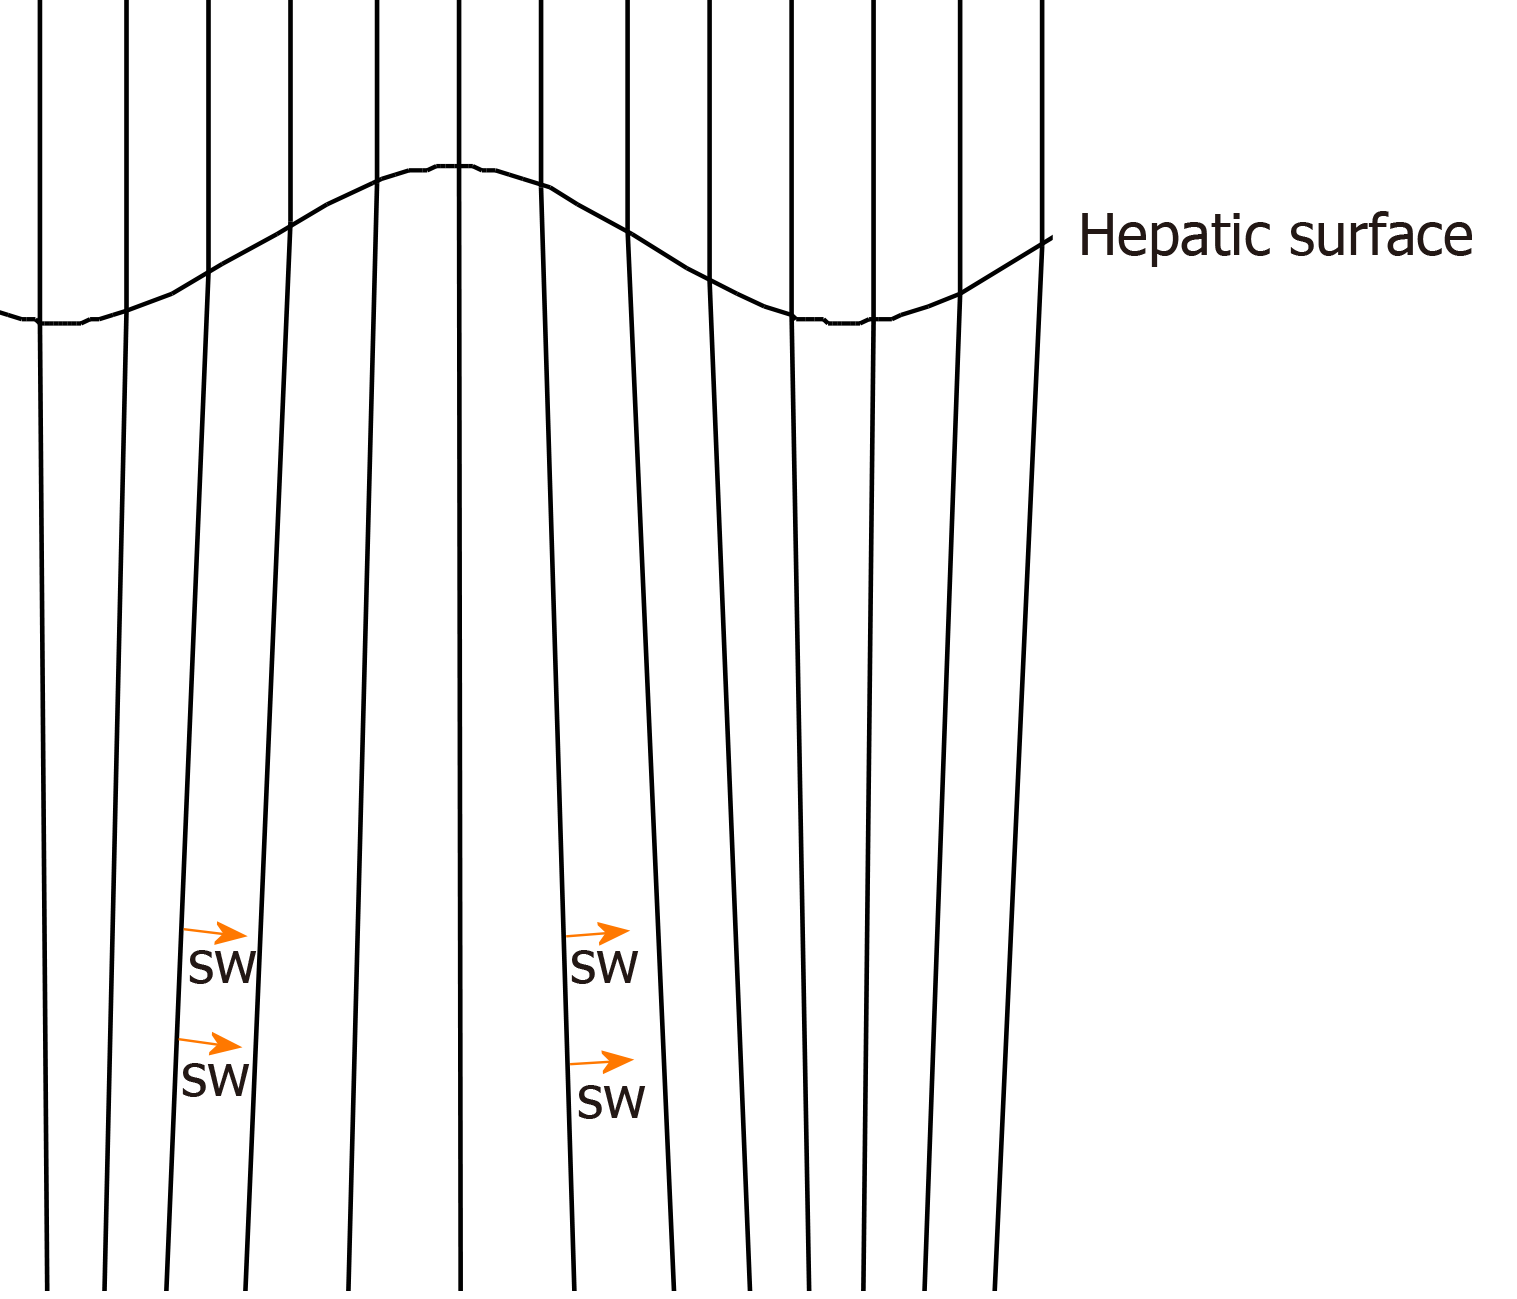
Figure 6 Computer simulation model of push-pulses in a cirrhotic patient.
Push-pulses change direction at the irregular hepatic surface, according to Snell’s law. Shear wave (arrow). SW: Shear wave.
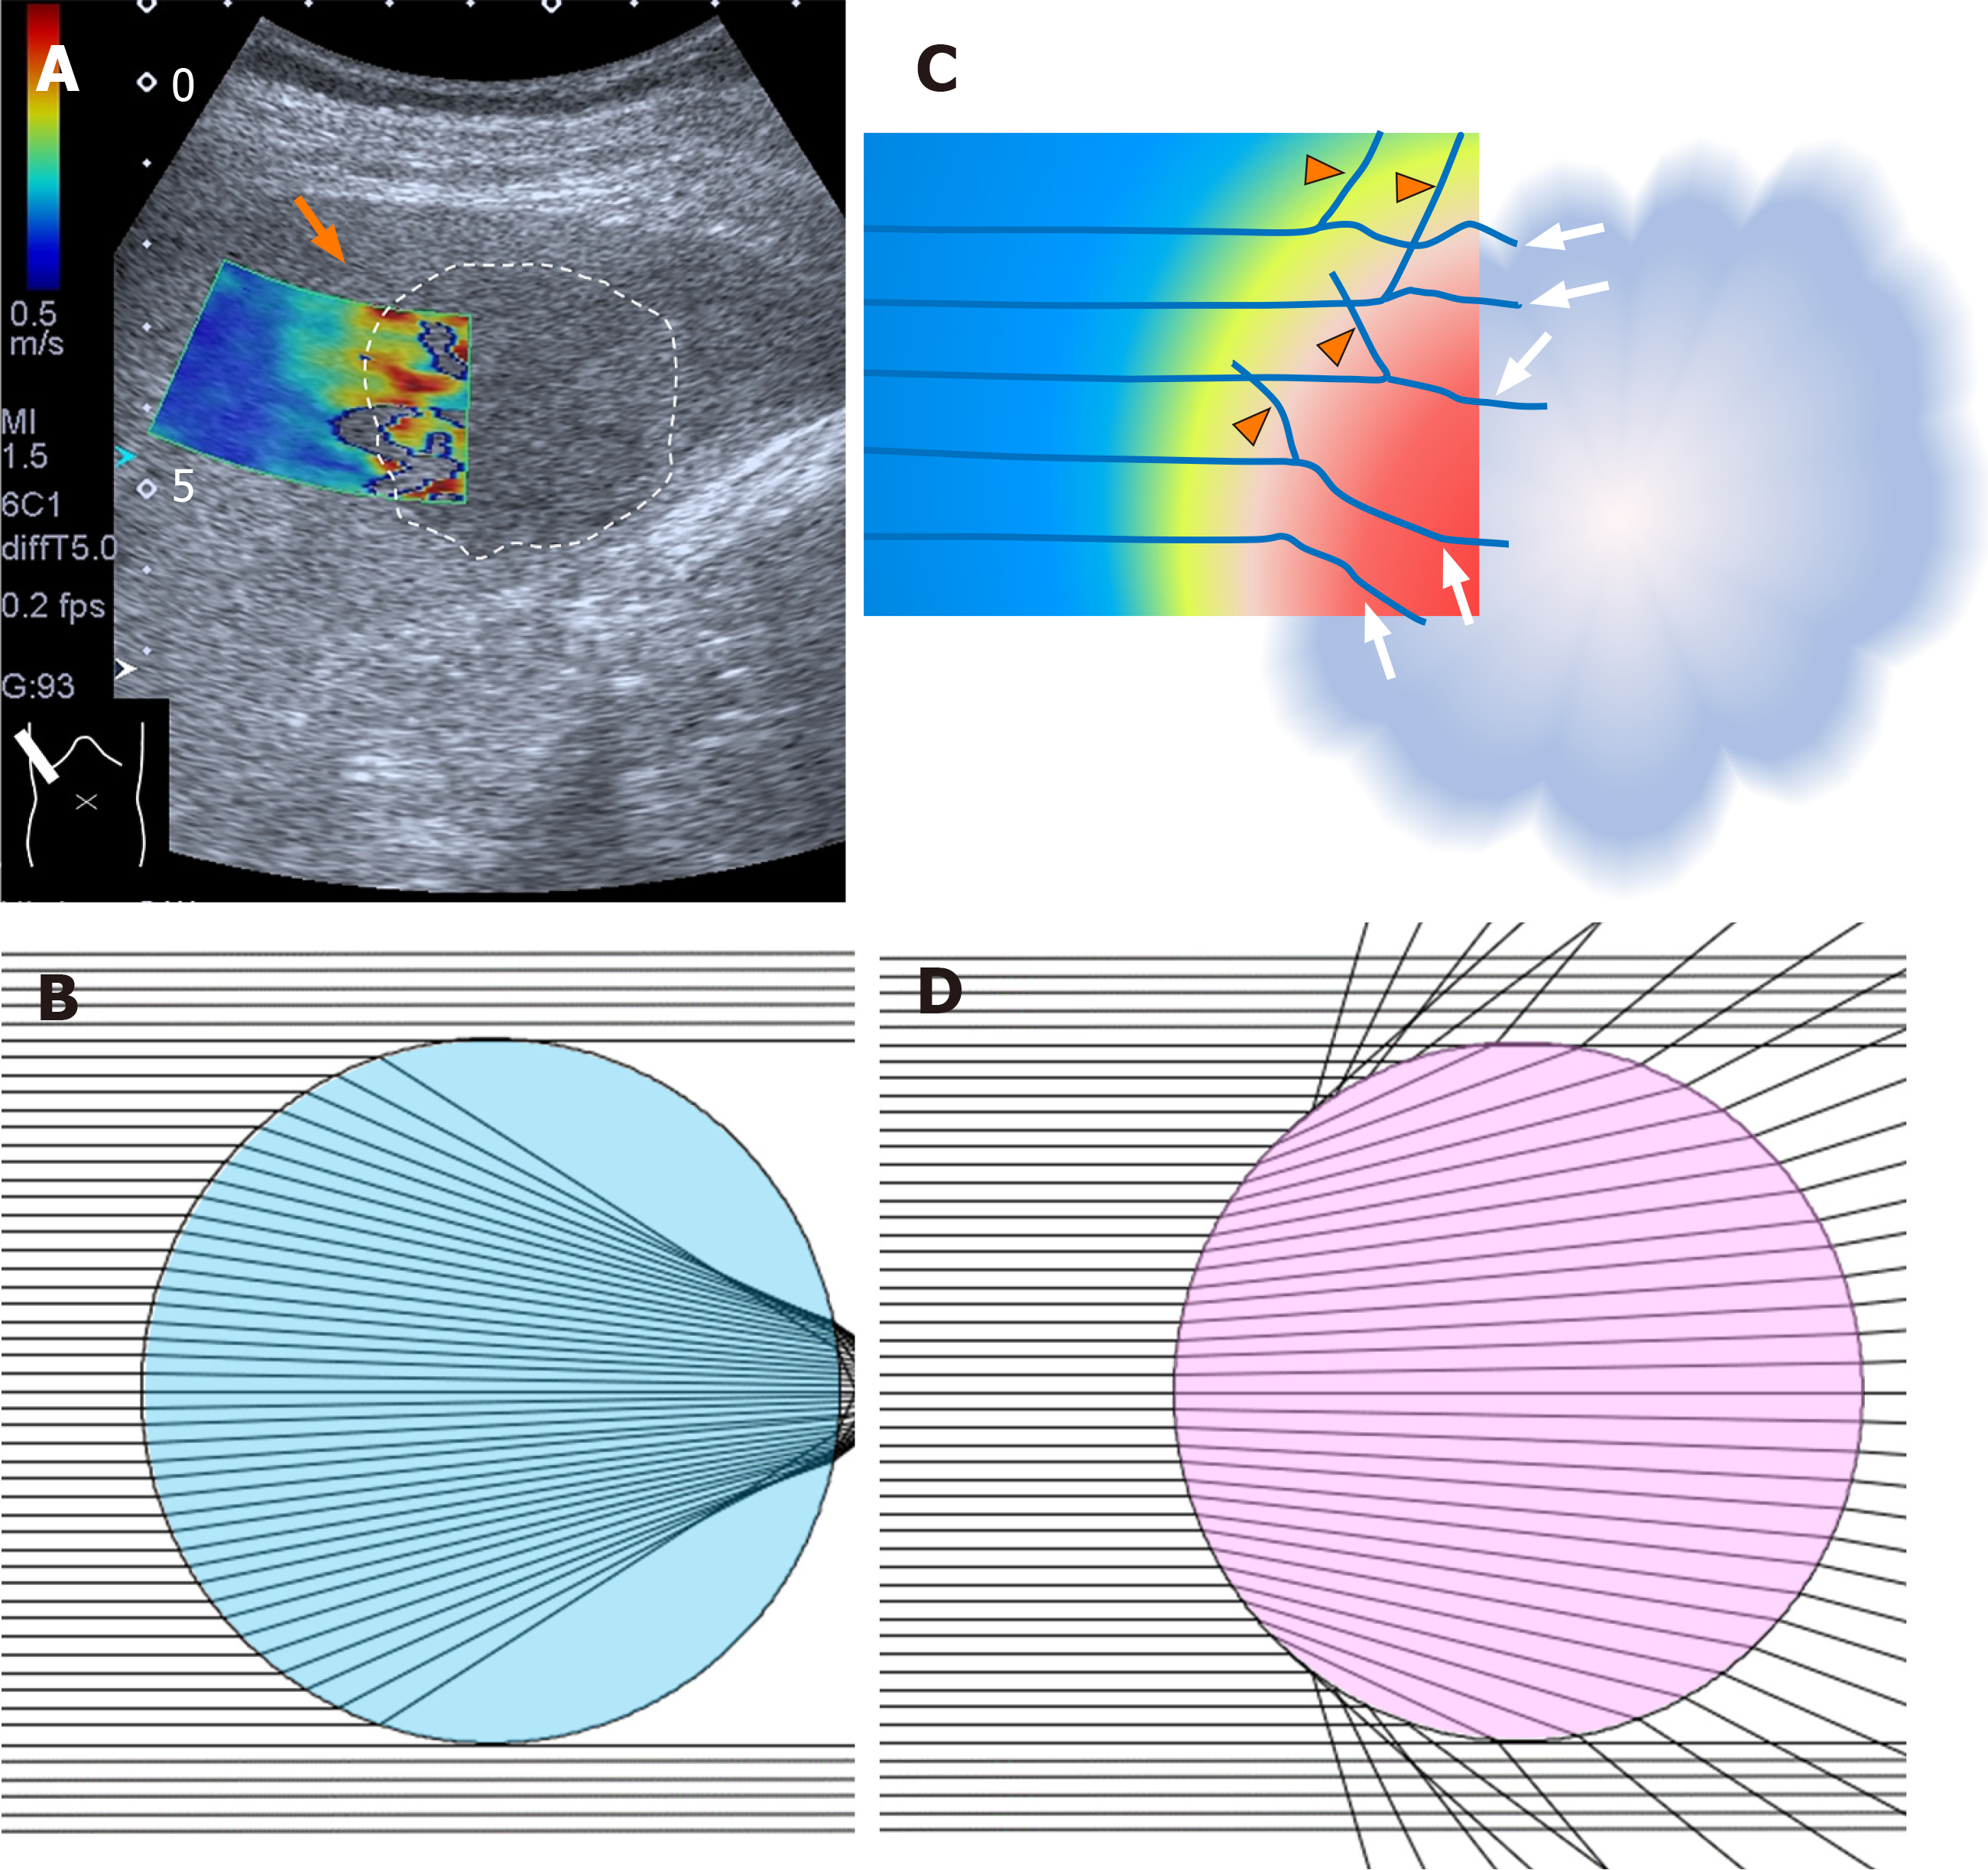
Figure 7 Two-dimensional shear wave elastography of liver tumor.
A: Two-dimensional SW elastography of a liver tumor (encircled area) shows an irregular-shaped round area consisting of multiple layers of different colors (arrows); B: When the tumor has a lesser SW value than the surrounding tissue. Computer simulation model shows that all SWs deviate largely at the surrounding tissue (in this case, SW velocity 1.5 m/s) -liver tumor (in this case, SW velocity 1.0 m/s) interface; C: When the tumor has a greater SW value than the surrounding tissue. Computer simulation model shows that all SWs deviate largely at the surrounding tissue (in this case, SW velocity 1.5 m/s) -liver tumor (in this case, SW velocity 2.0 m/s) interface; D: Schematic drawing of mode of SWs around the surrounding tissue-liver tumor interface (arrows: deviated SWs; arrow heads: reflected SWs). SW: Shear wave.
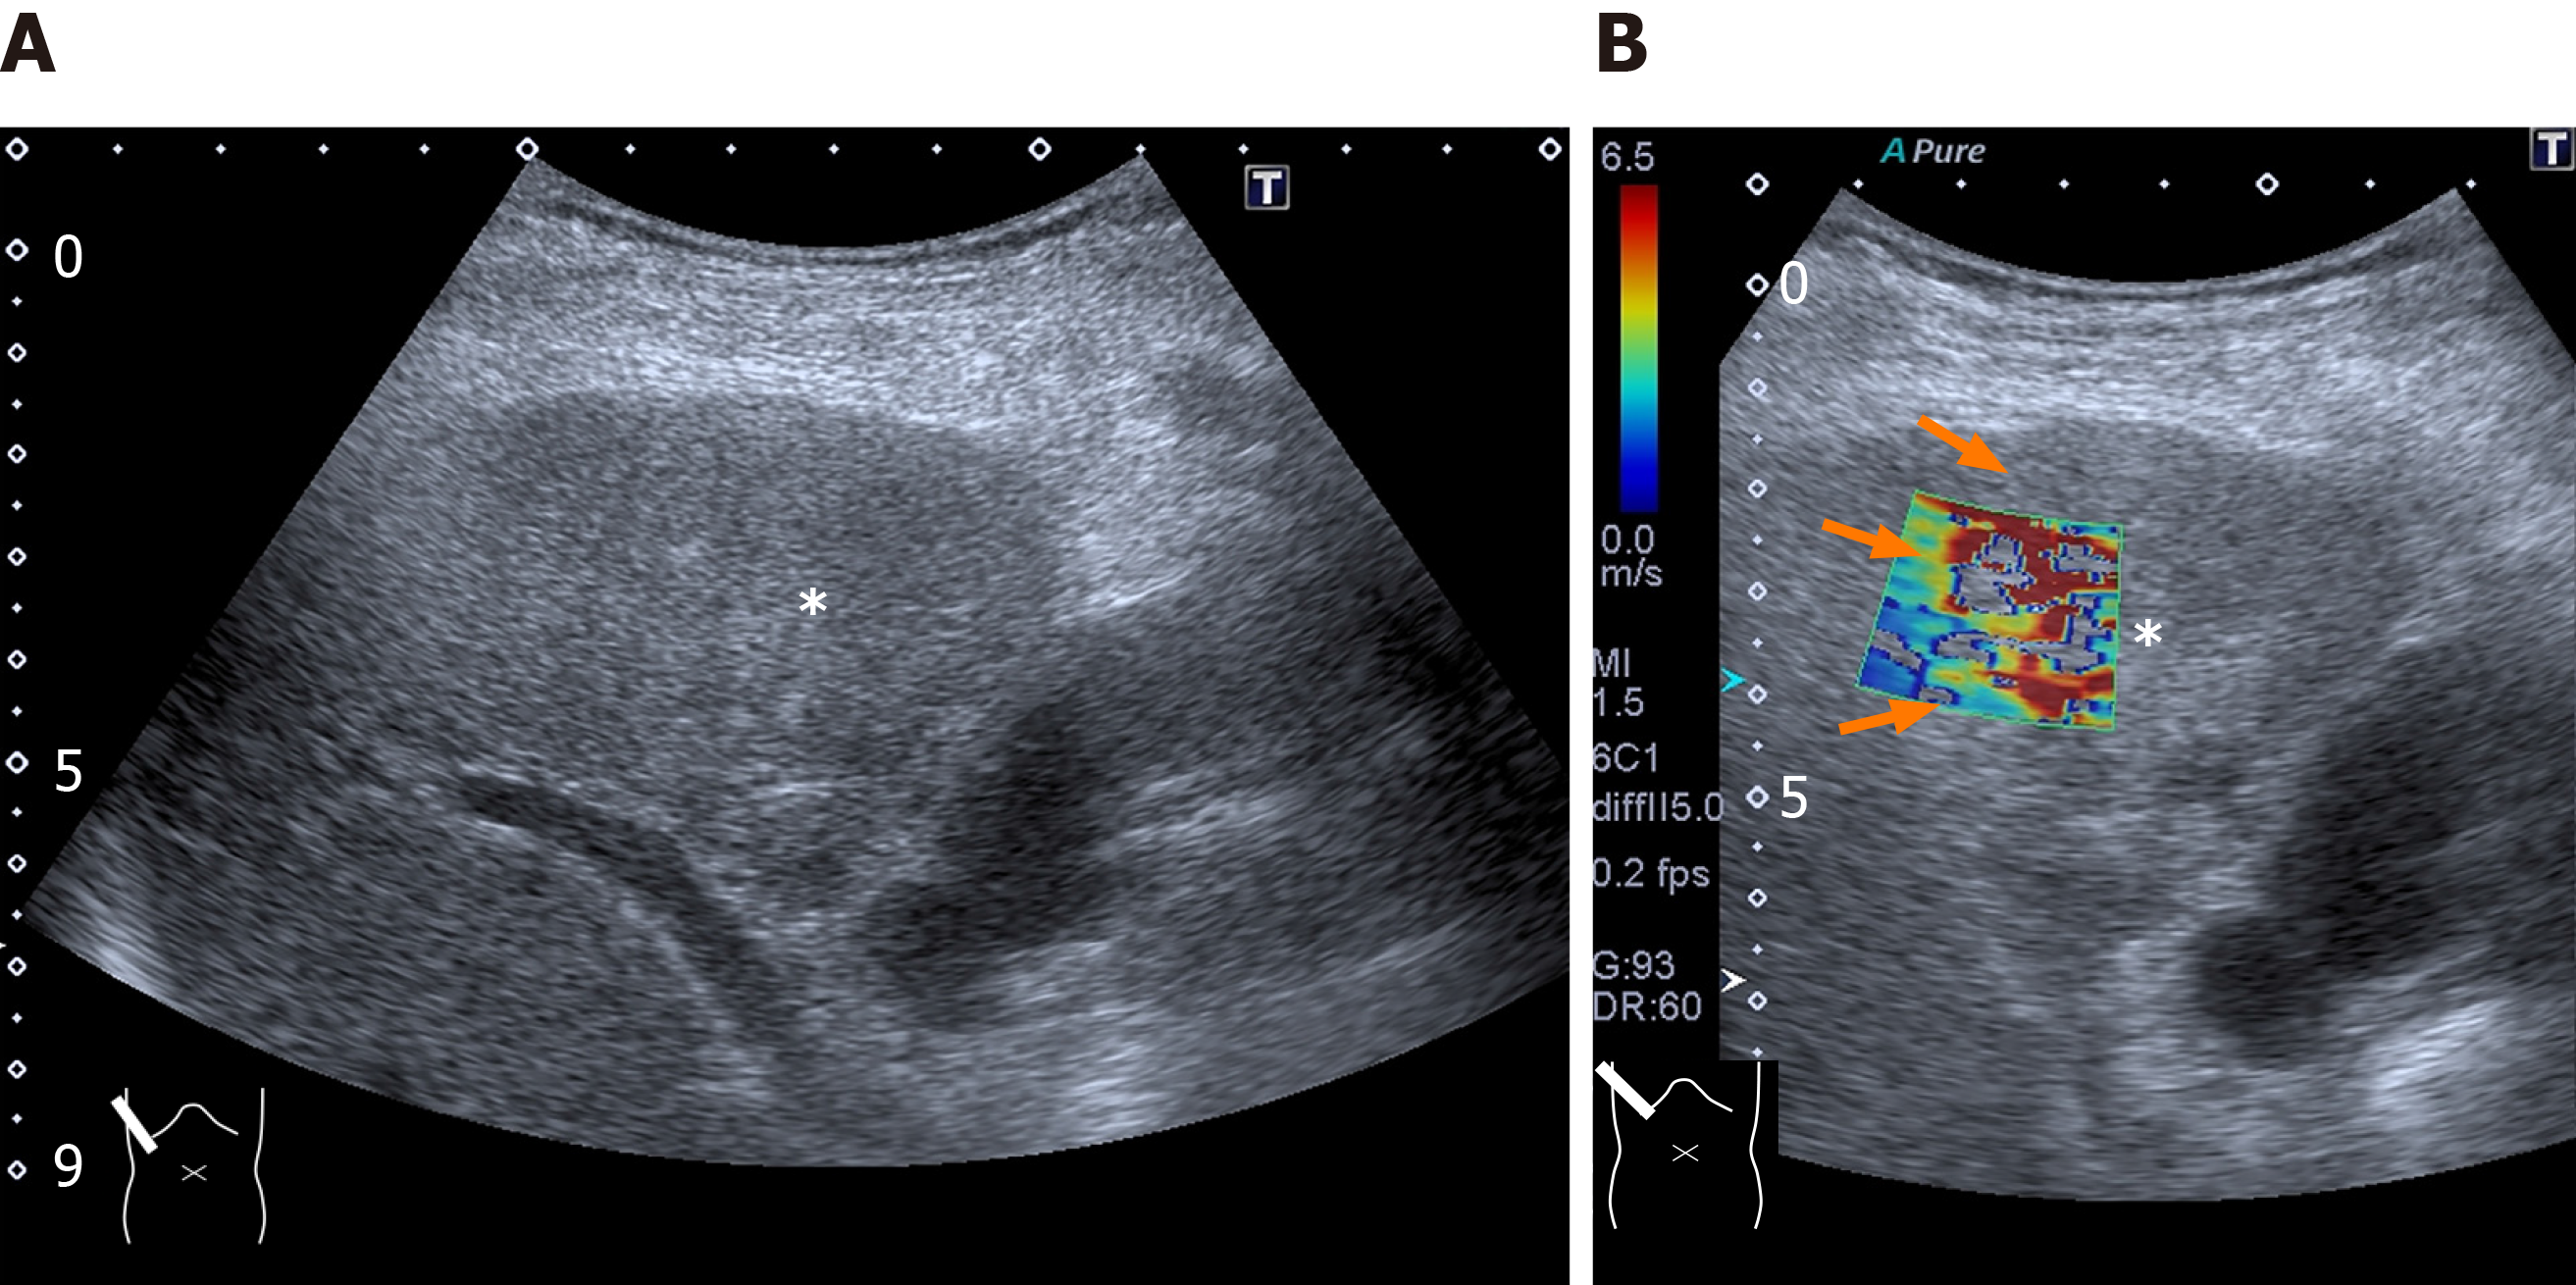
Figure 8 Representative case: intrahepatic cholangiocellular carcinoma.
A and B: The lesion (asterisk) is poorly visible on B-mode (A) but it is well demarcated on two-dimensional shear wave elastography (B, arrow).
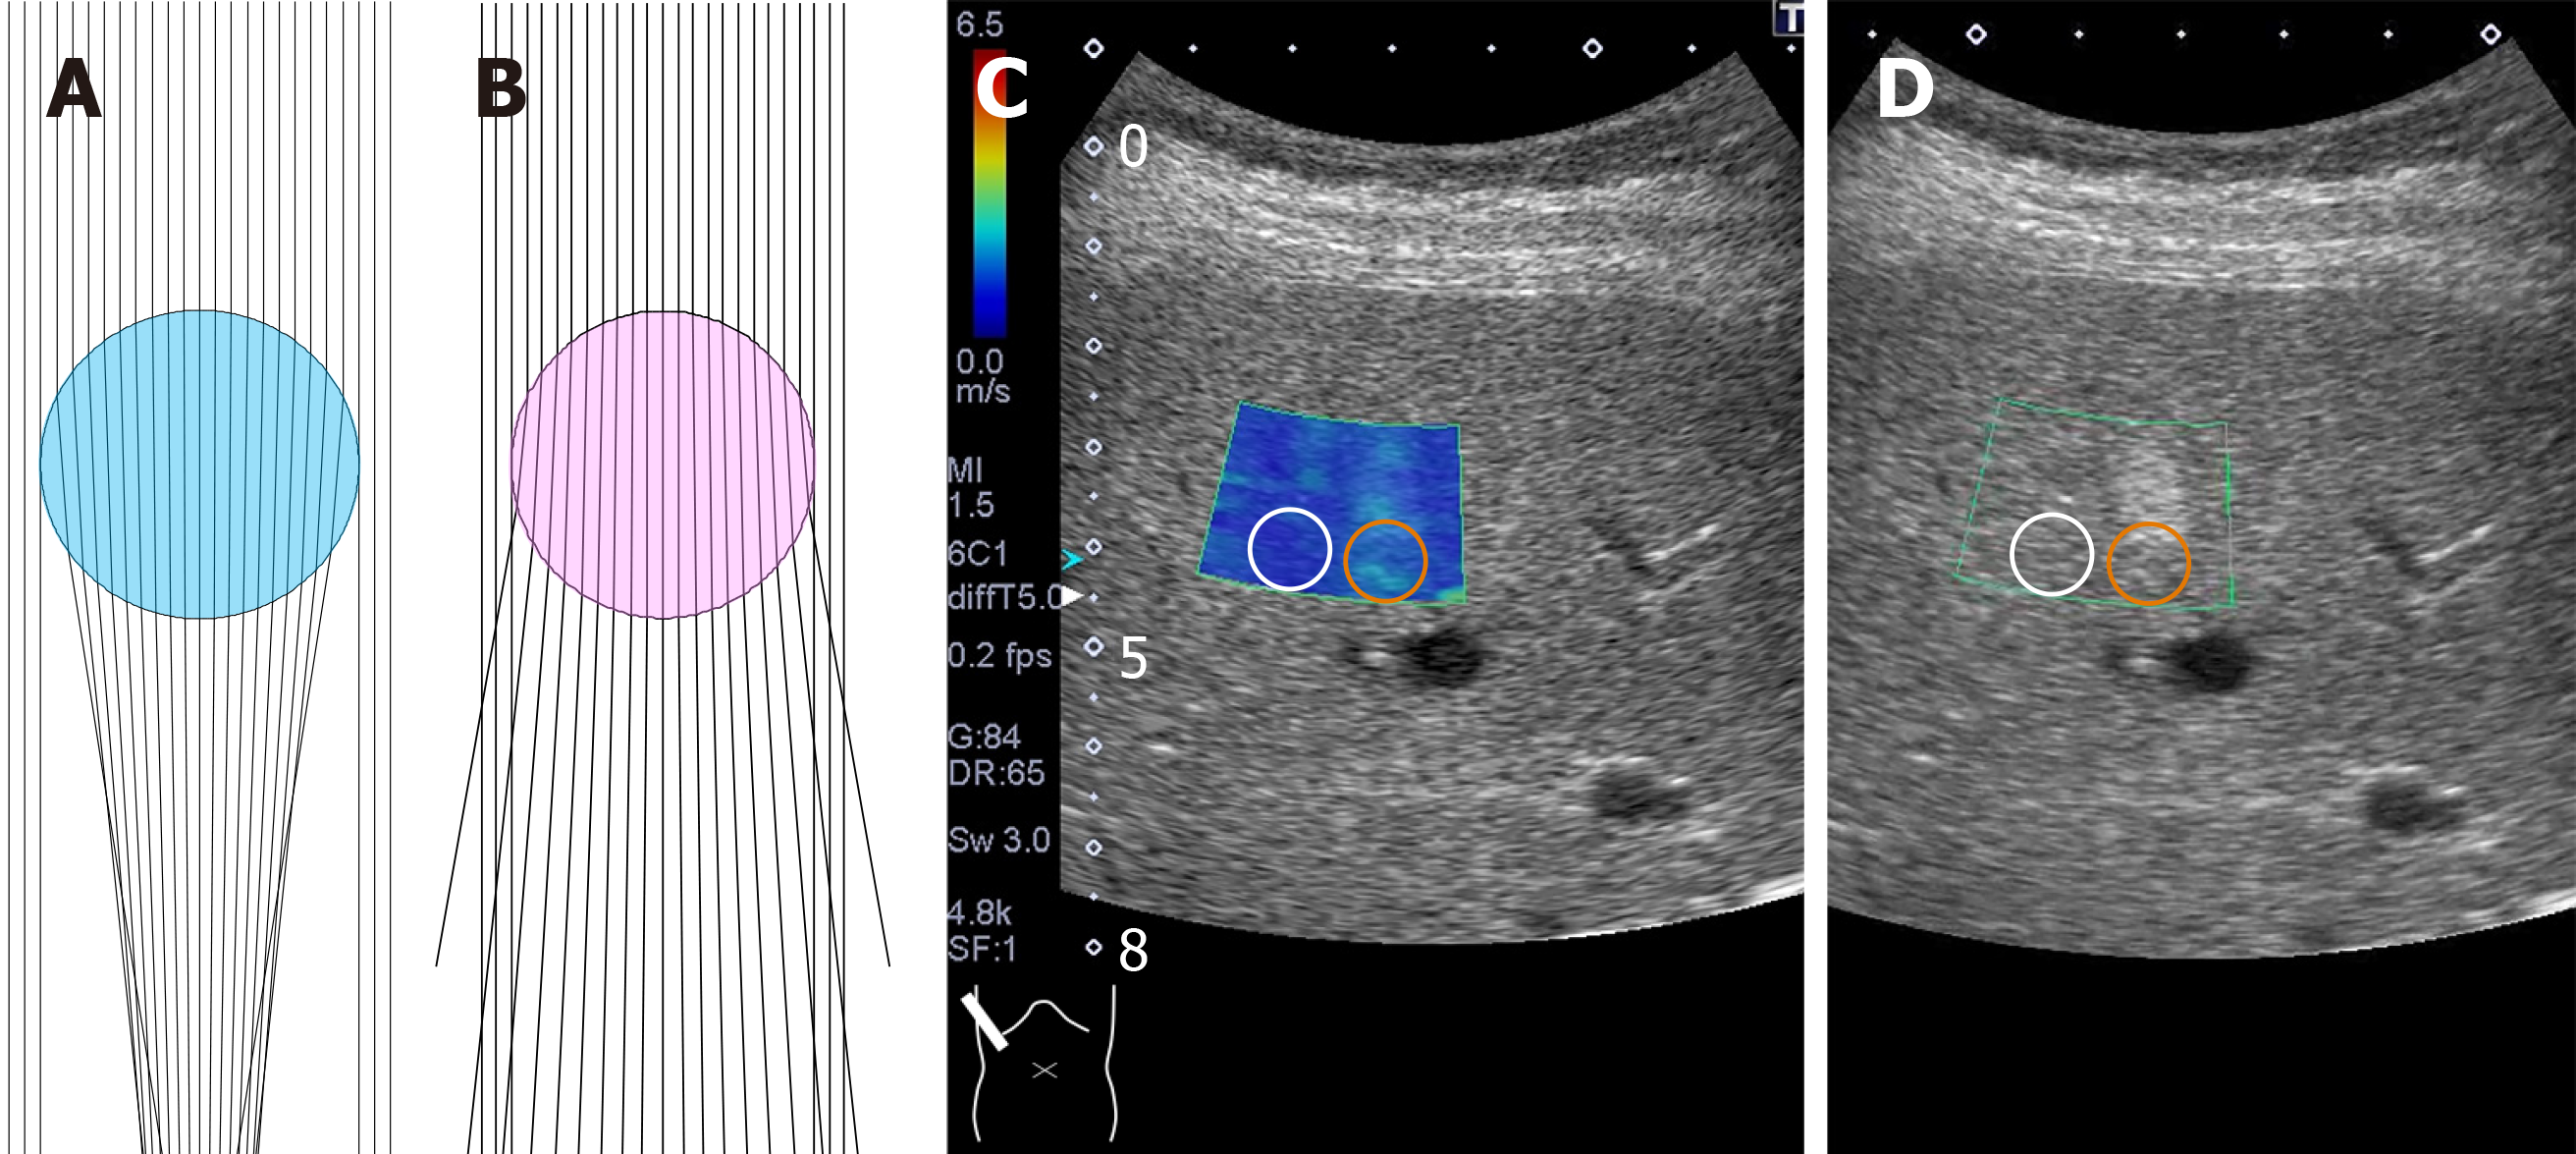
Figure 9 Computer simulation model of deviated push-pulses.
A: Surrounding tissue acoustic speed is 1540 m/s and that of tumor (blue) is 1480 m/s; B: Surrounding tissue acoustic speed is 1540 m/s and that of tumor (pink) is 1600 m/s [A and B — the push-pulses change direction twice at two interfaces (upper and lower) of the surface of the lesion]; C: Two-dimensional shear wave elastography shows the posterior zone behind the lesion (red circle) to have a greater shear wave velocity (1.67 ± 0.19 m/s) than the surrounding hepatic tissue (1.07 ± 0.08 m/s) (white circle); D: Hepatic ultrasound reveals a 2 cm × 2 cm echogenic mass (hemangioma) in segment 5.
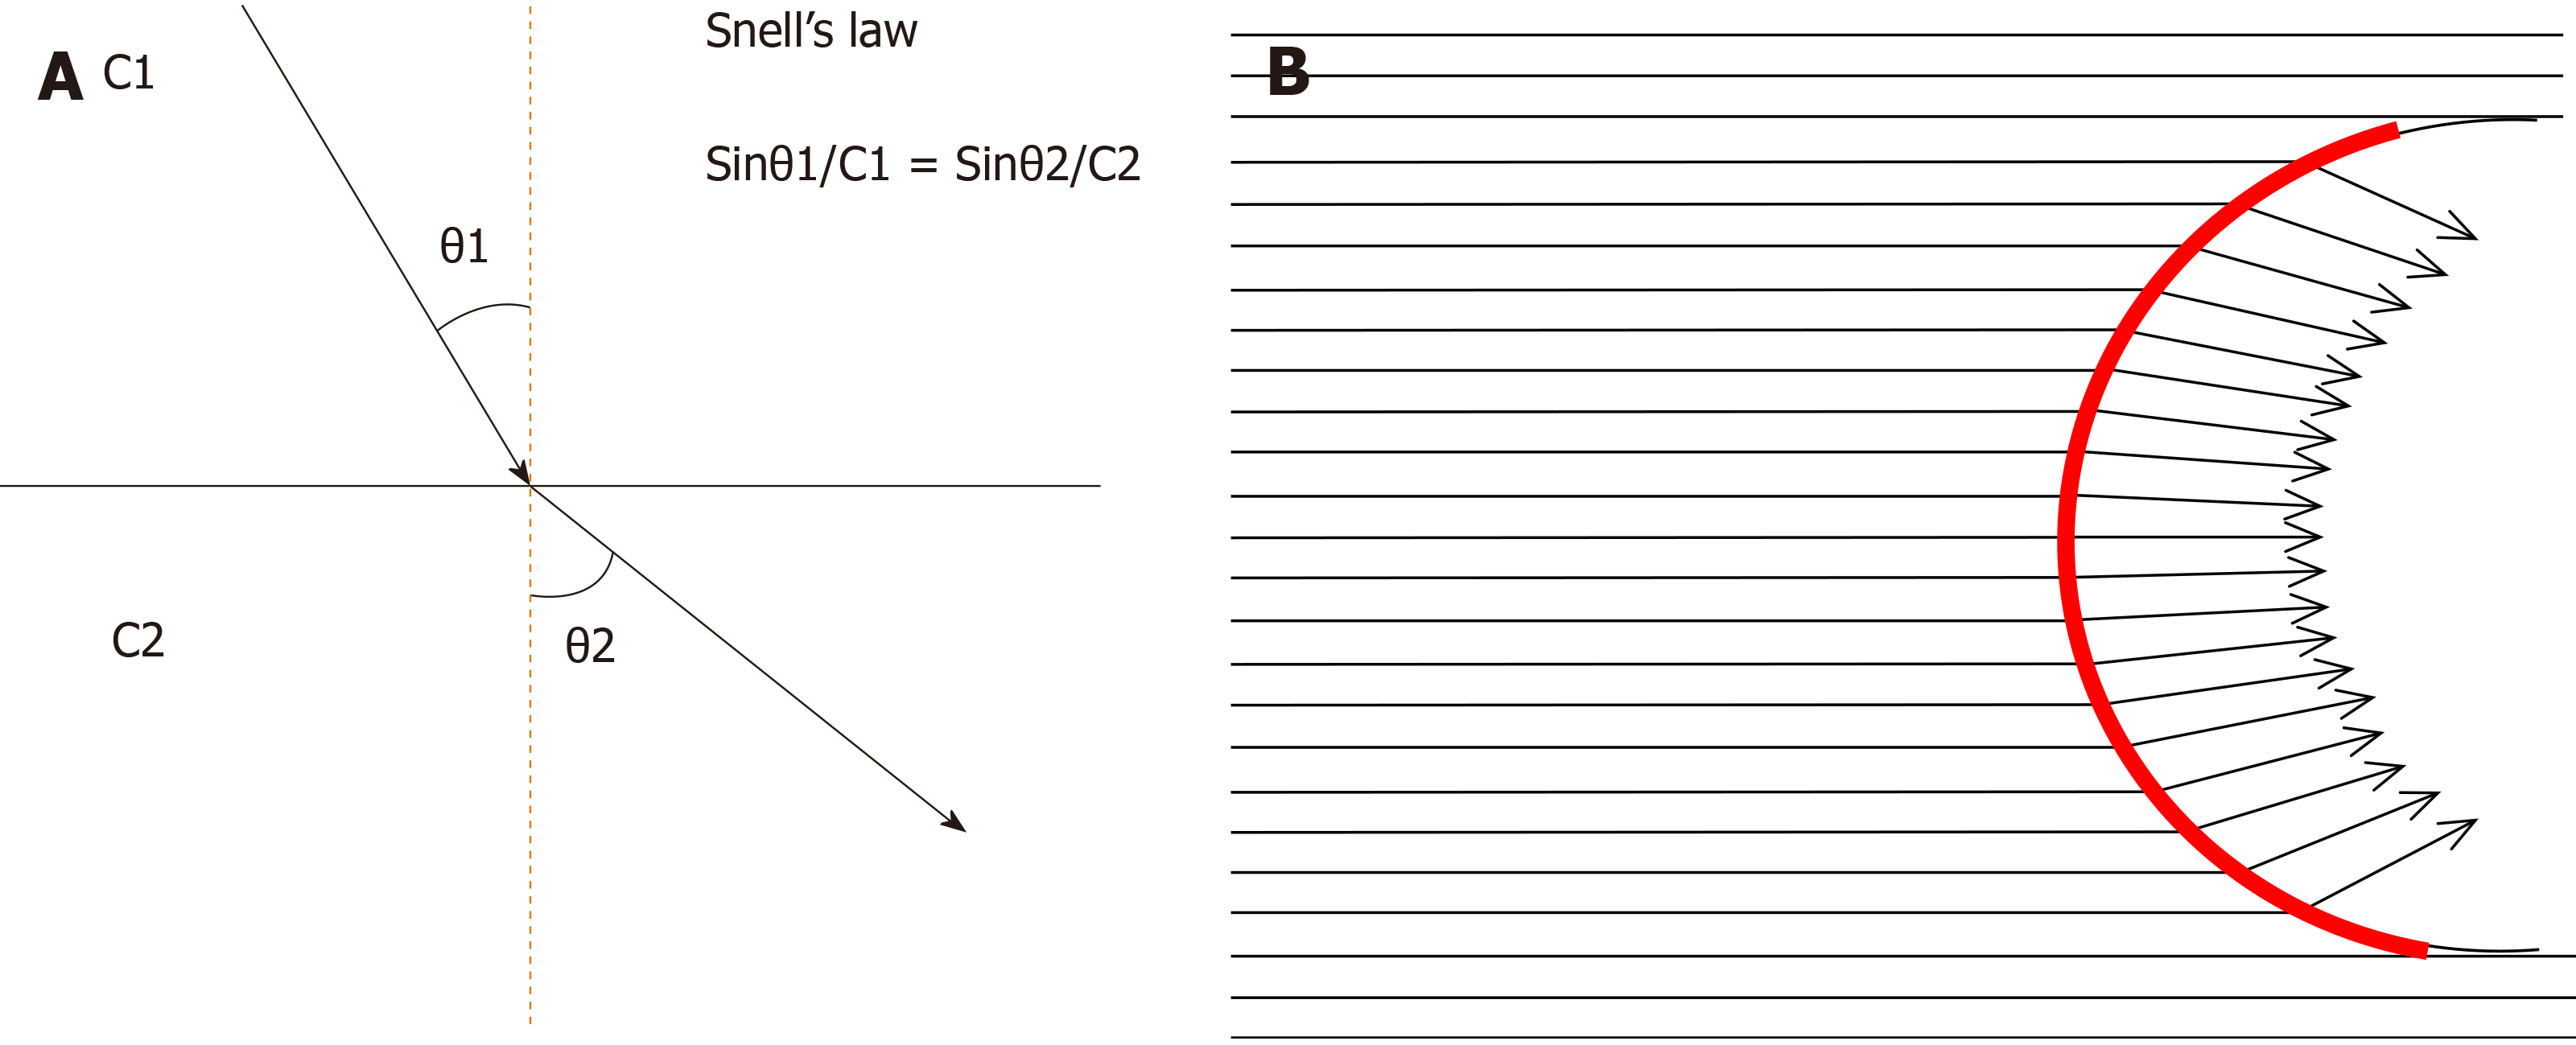
Figure 10 Sound refraction at the interface.
A: Sound (or shear wave) refraction occurs at the straight interface between two structures of different acoustic (or shear wave) velocities, depending on Snell’s law. The degree of refraction is always the same. θ1: Angle of incidence, θ2: Angle of refraction, C1: Sound (or shear wave) velocity in tissue 1, C2: Sound (or shear wave) velocity in tissue 2; B: Sound (or shear wave) refraction at the curved interface. As the tumor (or cirrhotic liver surface) has a curved interface, the angle of incidence changes according to the incidental point. Thus, the angle of refraction changes also according to the incidental point. Red line: Curved interface.
- Citation: Naganuma H, Ishida H, Uno A, Nagai H, Kuroda H, Ogawa M. Diagnostic problems in two-dimensional shear wave elastography of the liver. World J Radiol 2020; 12(5): 76-86
- URL: https://www.wjgnet.com/1949-8470/full/v12/i5/76.htm
- DOI: https://dx.doi.org/10.4329/wjr.v12.i5.76


