©The Author(s) 2019.
World J Radiol. Sep 28, 2019; 11(9): 116-125
Published online Sep 28, 2019. doi: 10.4329/wjr.v11.i9.116
Published online Sep 28, 2019. doi: 10.4329/wjr.v11.i9.116
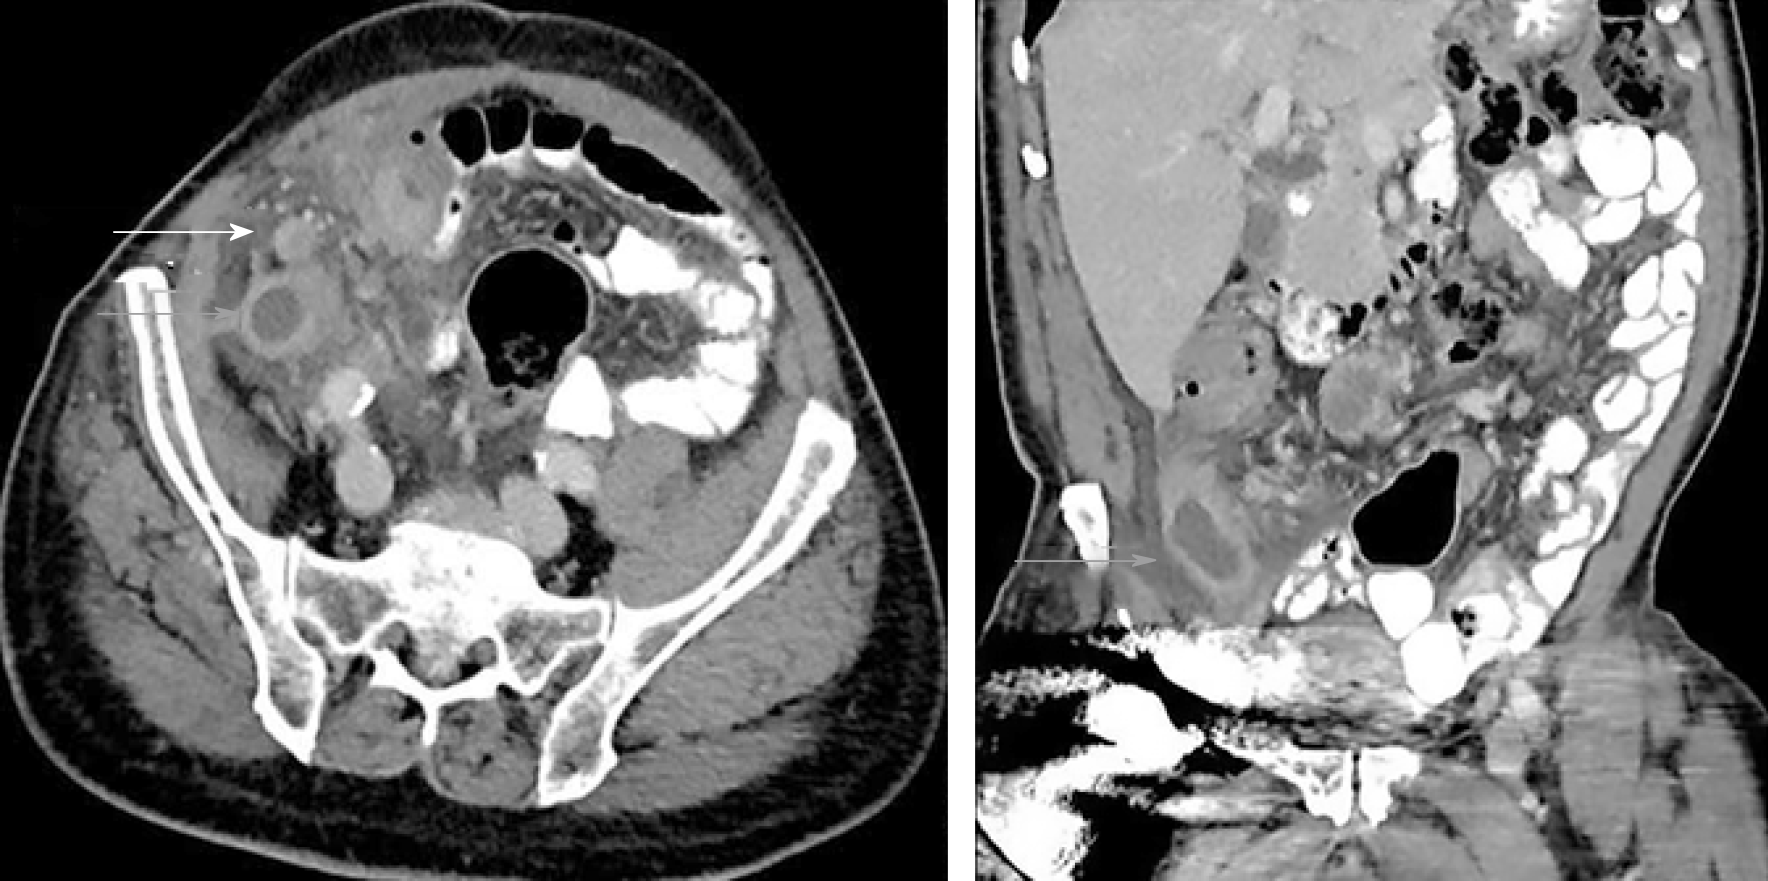
Figure 1 Axial and coronal abdominal contrast enhanced computed tomography images depict a fluid filled and dilated appendix (gray arrows) and adenopathy (white arrow).
Surrounding inflammatory changes present.
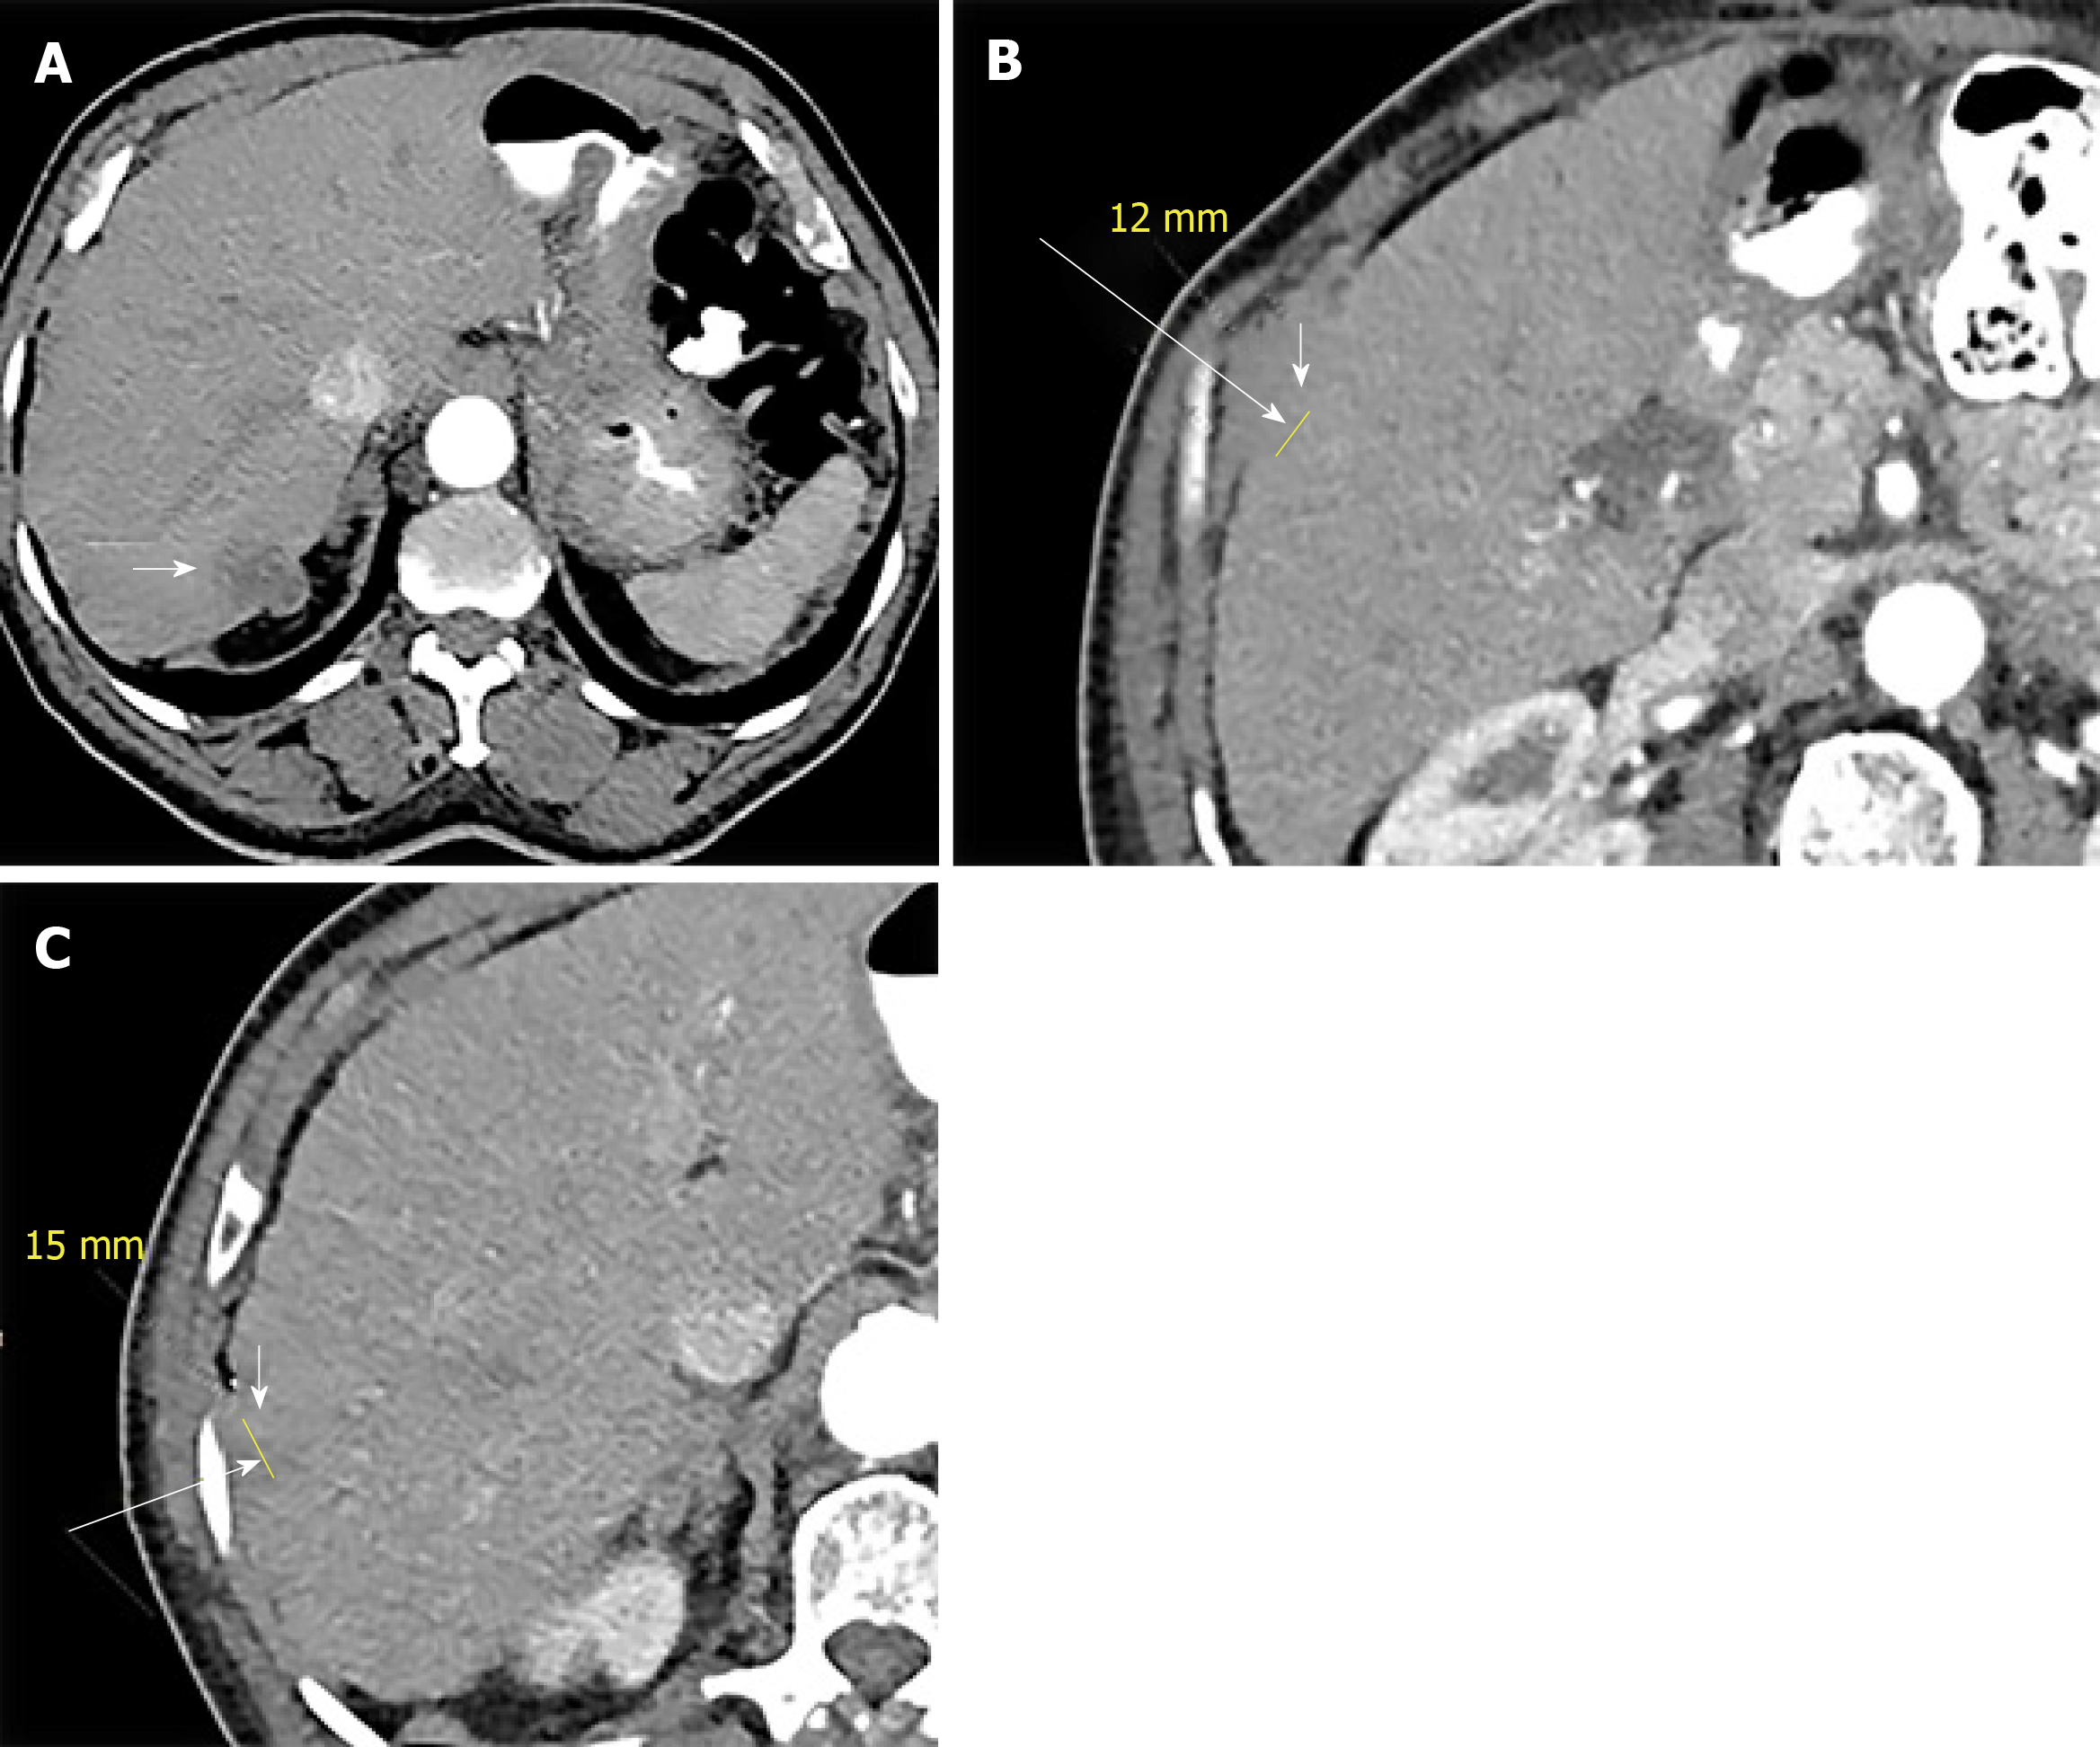
Figure 2 Axial sequential abdominal contrast enhanced computed tomography images (A-C) depict 3 new hepatic lesions in the right lobe (white arrows).
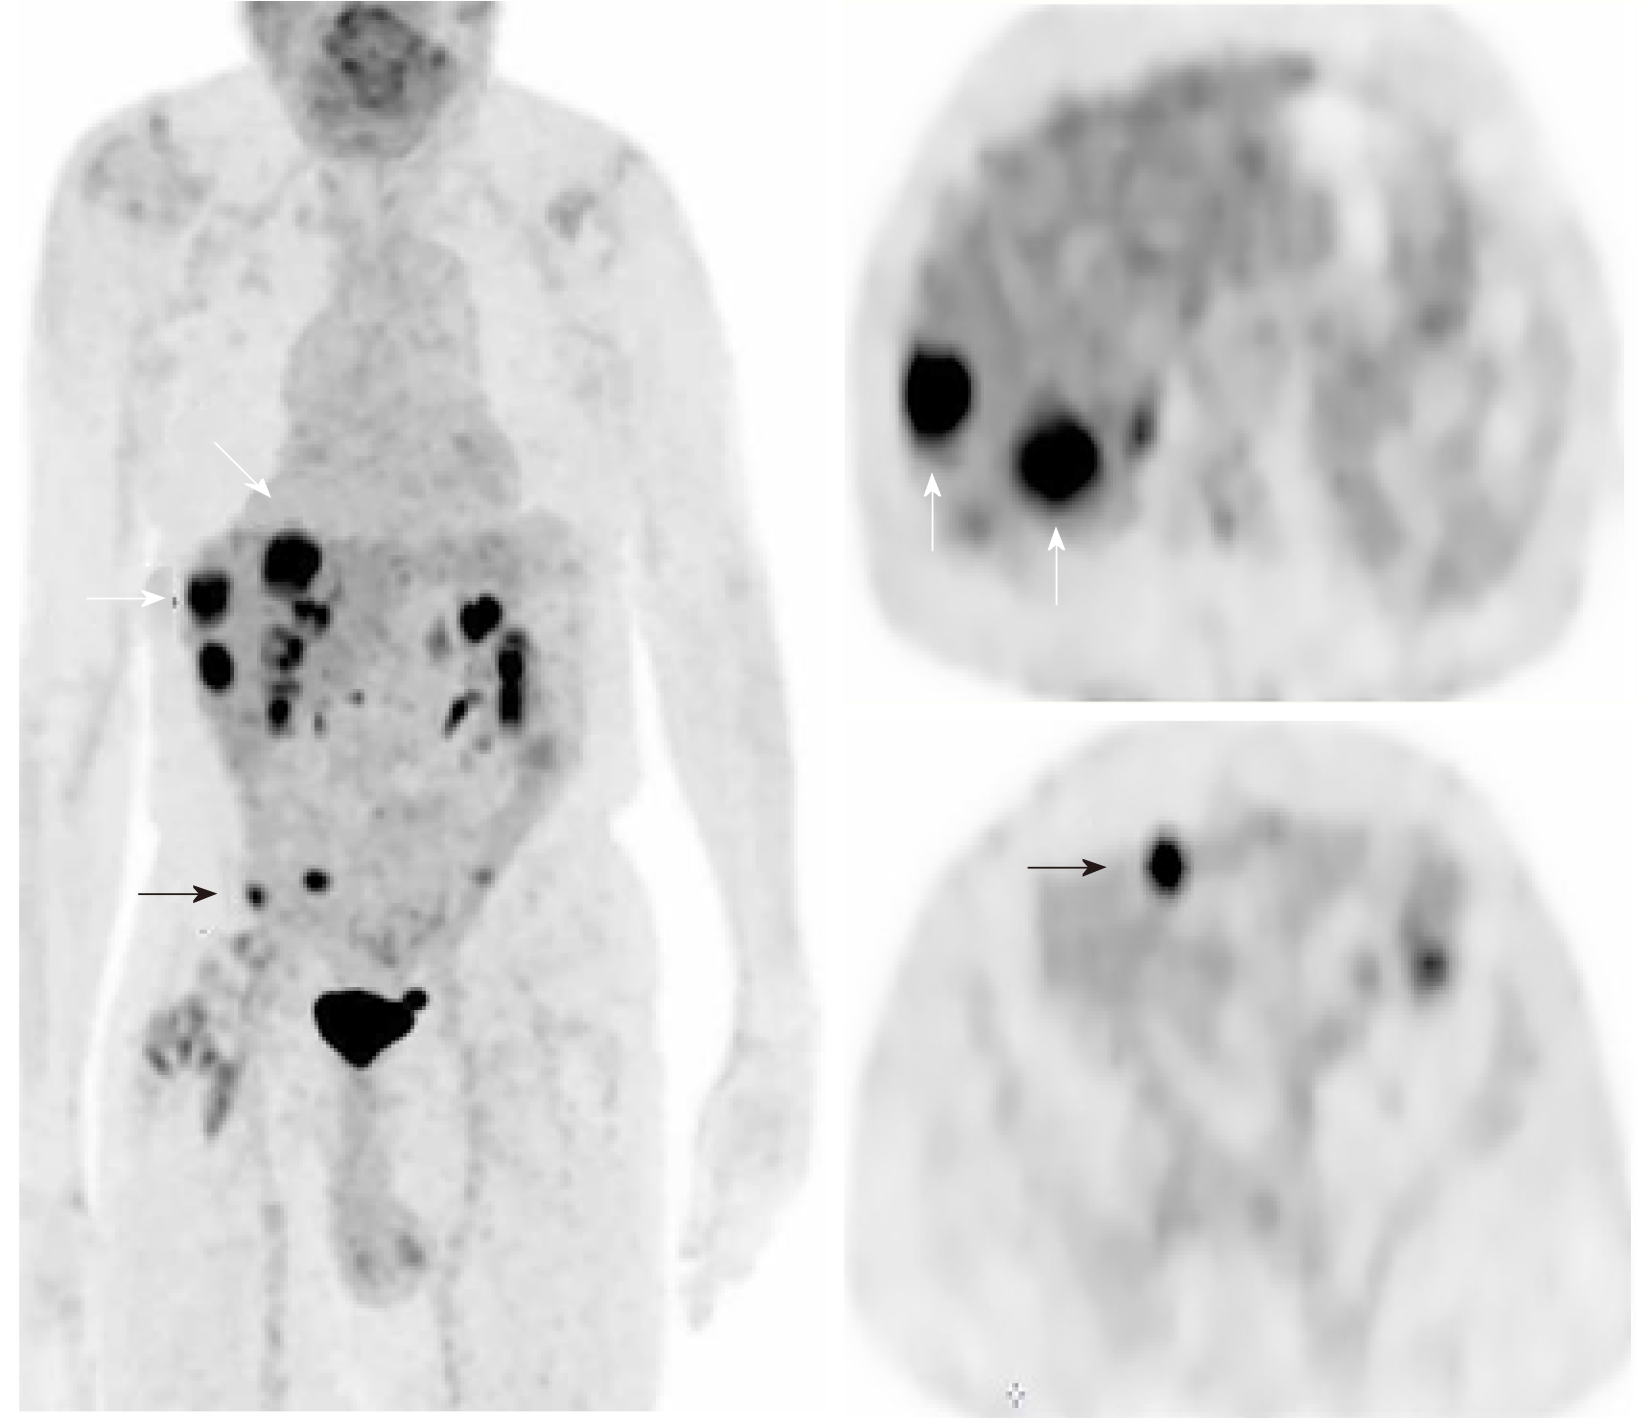
Figure 3 Coronal and axial fluorodeoxyglucose positron emission tomography images show fluorodexoyglucose avid liver (white arrows) and peritoneal (black arrows) metastases.
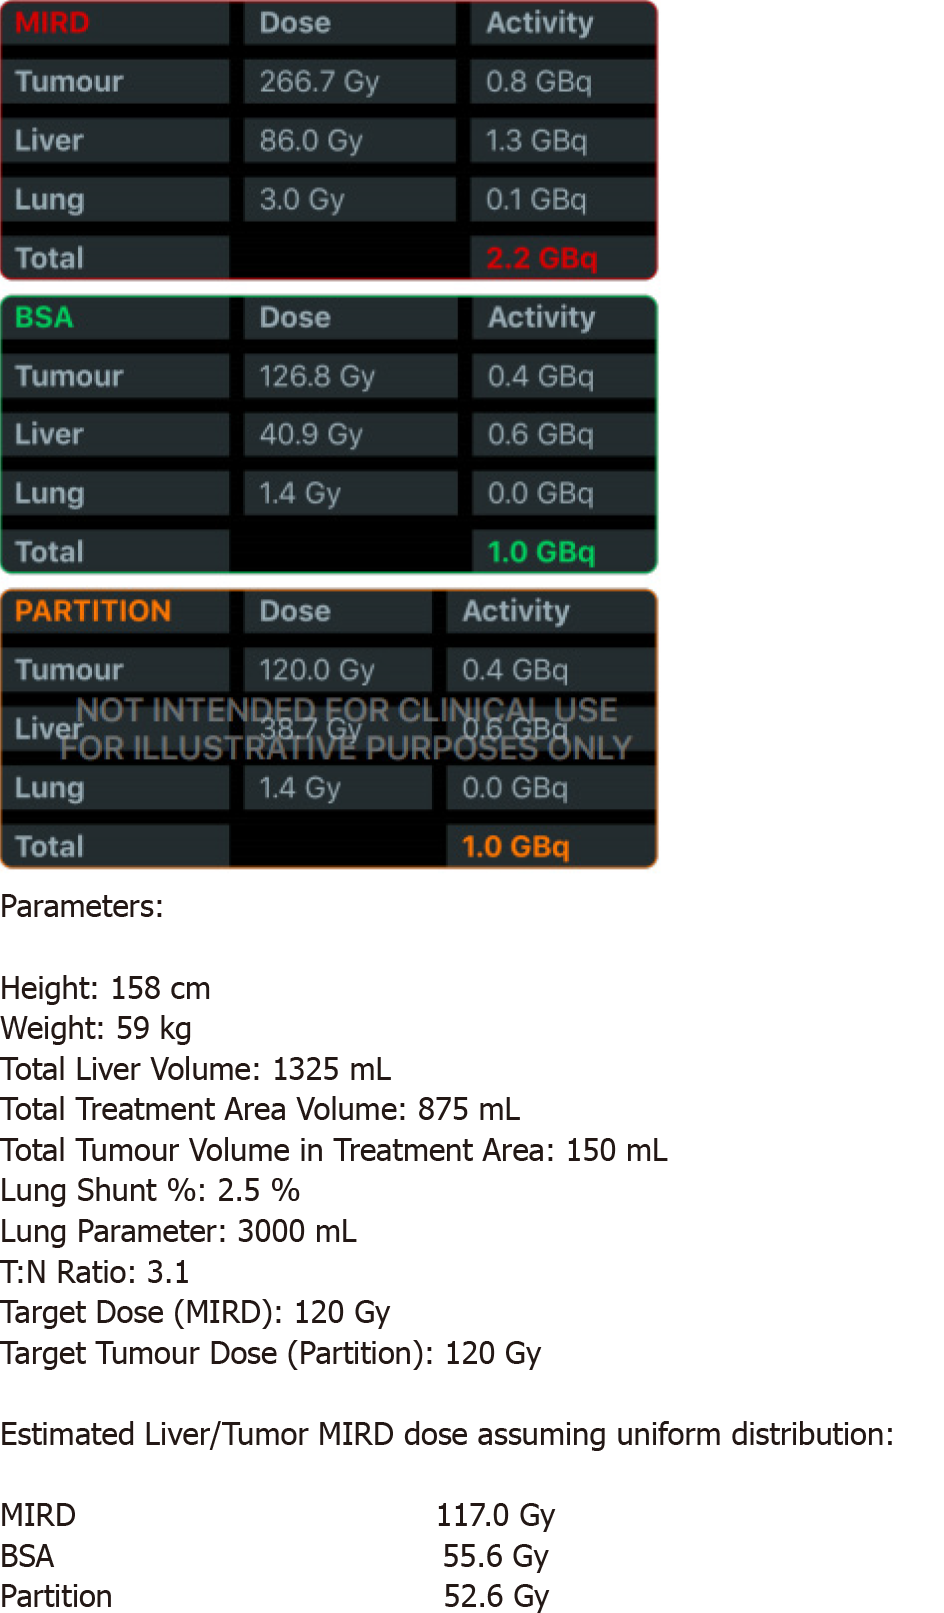
Figure 4 Dose and activity visualizer for Yttrium-90 radioembolization (DAVYR) application chart obtained after inputting the necessary fields, displaying the medical internal radiation dose, body surface area and partition models with prescribed activity Gigabecquerel, estimated dose to the tumor, liver and lungs Gray.
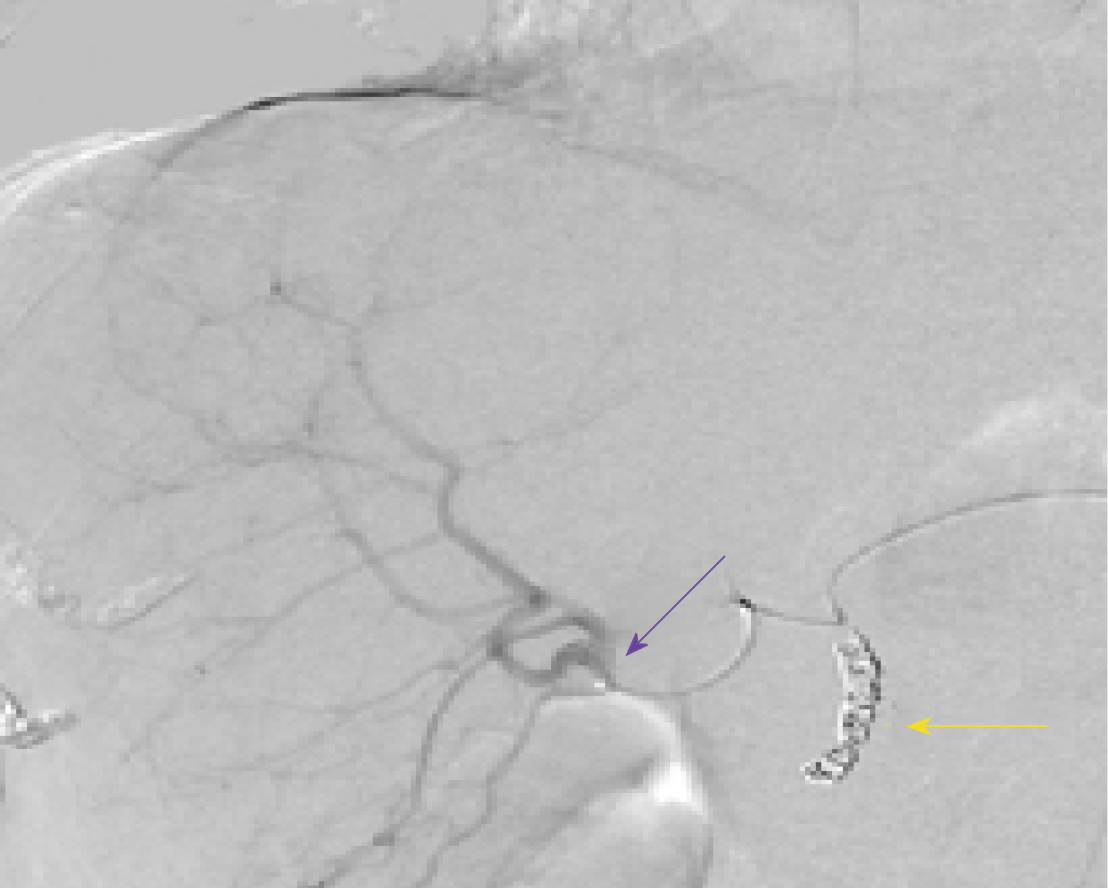
Figure 5 Hepatic angiogram.
Yttrium 90 administration to the right lobe. The tip of the catheter (purple arrow) is at the bifurcation of the sectoral branches of the right hepatic artery. Coils in the gastro-duodenal artery (yellow arrow).
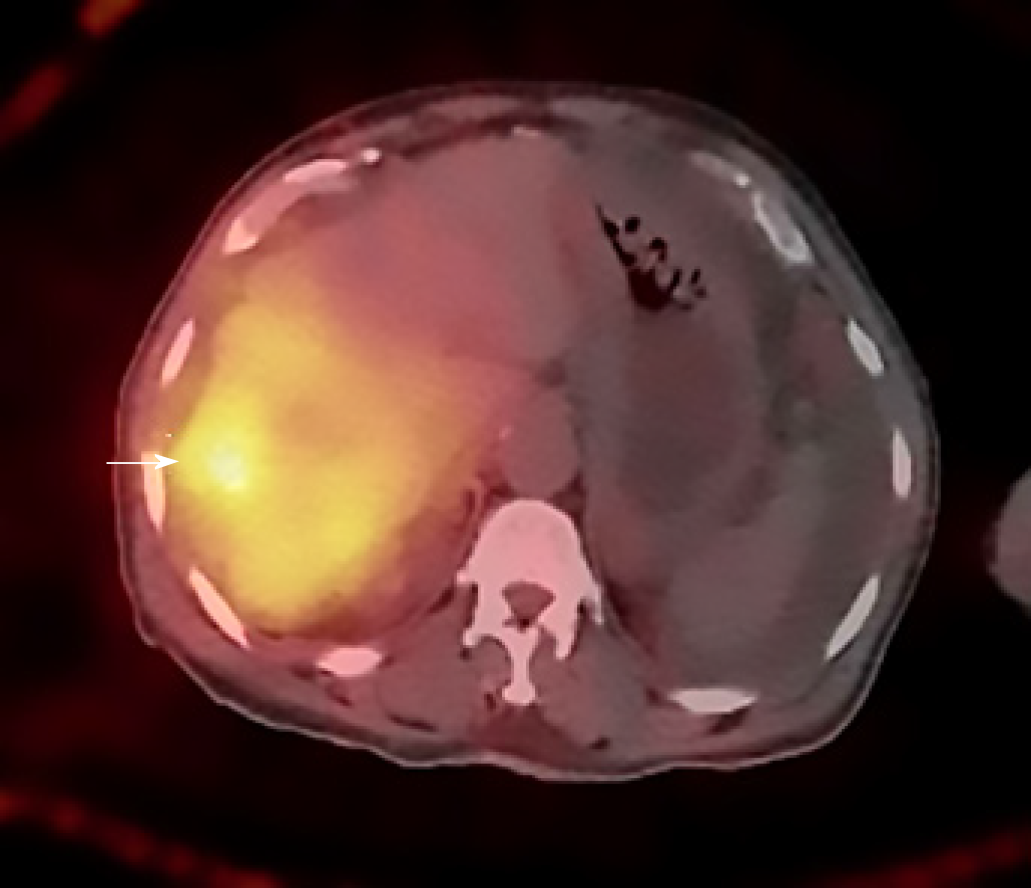
Figure 6 Axial post procedure single photon emission tomography image shows appropriate distribution of Yttrium 90 particles in the right hepatic lobe with increased focal uptake in one of the right lobe lesions (white arrow).
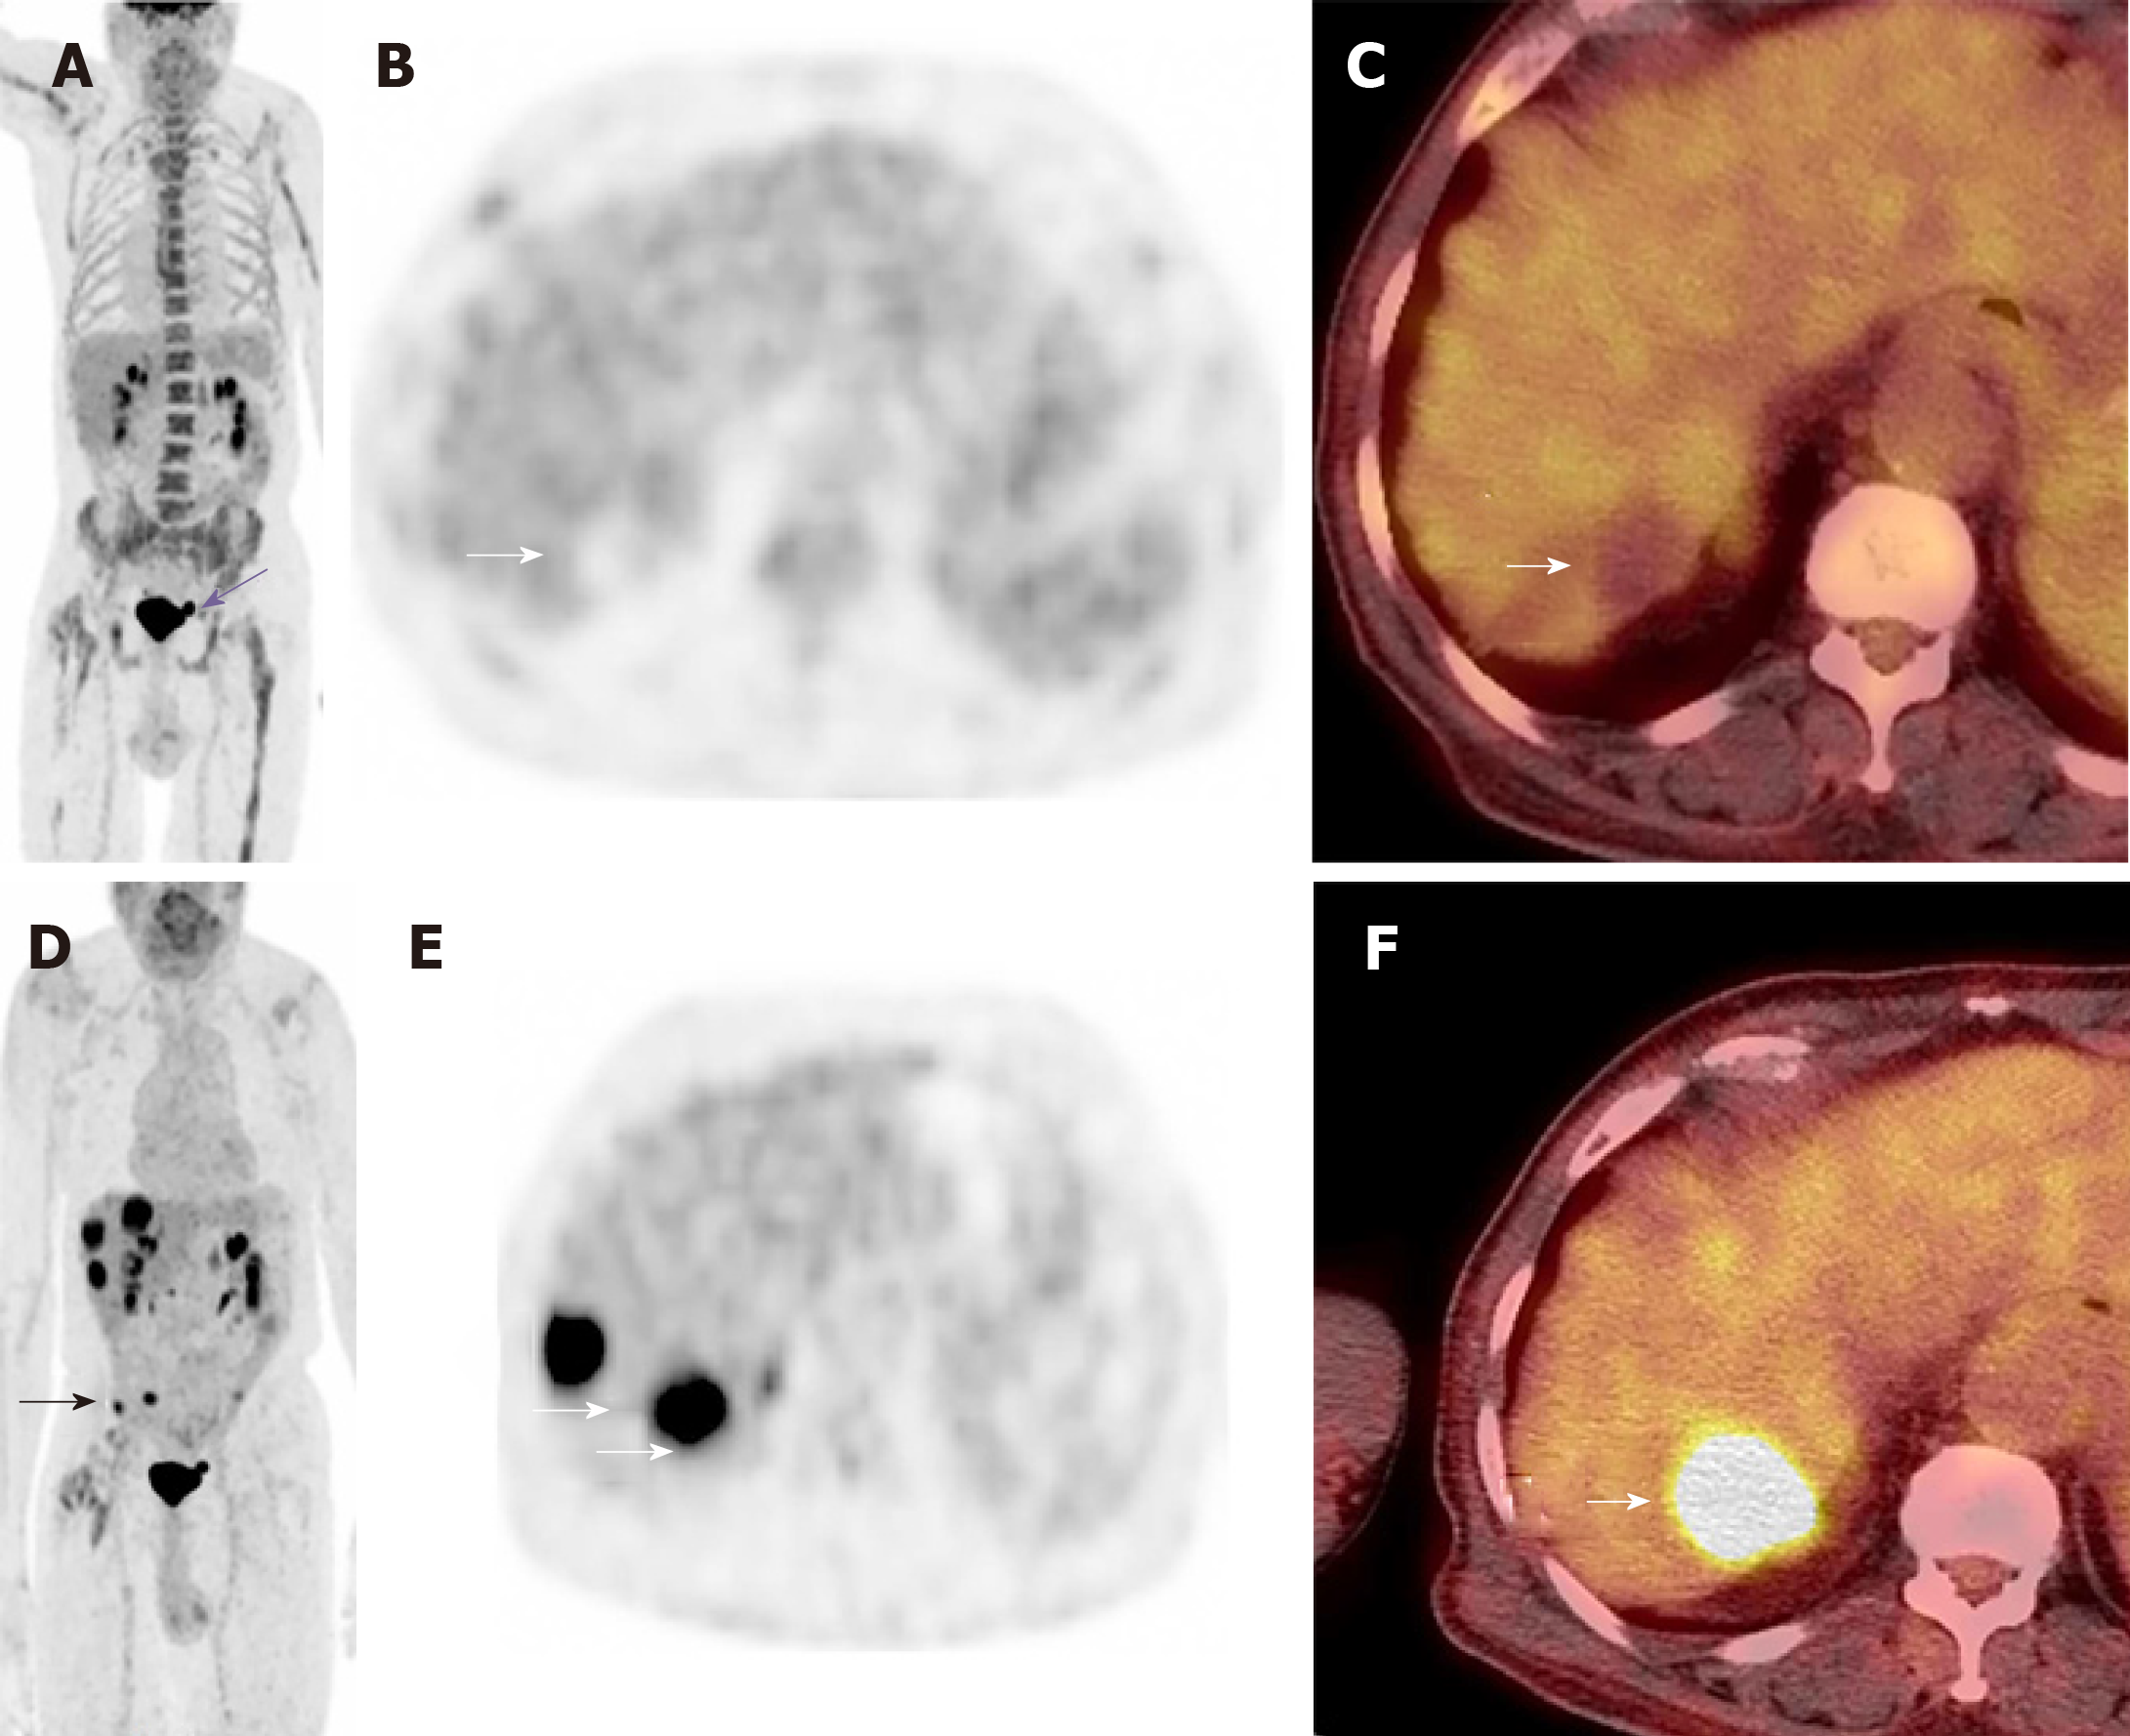
Figure 7 A restaging skull base to mid-thigh fluorodeoxyglucose positron emission tomography/computed tomography scan was performed after injection of 4.
9 mCi of flurodexoyglucose 2 mo following Yttrium 90 radioembolization. The post Yttrium 90 treatment positron emission tomography (PET) maximum intensity projection (MIP) coronal (A), attenuation corrected axial (B) and fused axial (C) PET images show complete resolution of all lesions with focal photopenia in the right hepatic lobe (white arrowheads). Incidentally, there is chemotherapy induced diffuse skeletal uptake and a small urinary bladder diverticulum (purple straight arrow A). The pre-therapy Positron emission tomography images are provided for comparison. Coronal MIP image (D) axial attenuation correction (E), and fused axial (F). Pretreatment PET images show multiple flurodexoyglucose avid right lobe hepatic (white arrows) and peritoneal (black arrows) lesions. PET: Positron emission tomography; MIP: Maximum intensity projection.
- Citation: Bhat AP, Schuchardt PA, Bhat R, Davis RM, Singh S. Metastatic appendiceal cancer treated with Yttrium 90 radioembolization and systemic chemotherapy: A case report. World J Radiol 2019; 11(9): 116-125
- URL: https://www.wjgnet.com/1949-8470/full/v11/i9/116.htm
- DOI: https://dx.doi.org/10.4329/wjr.v11.i9.116


