Copyright
©The Author(s) 2019.
World J Radiol. Mar 28, 2019; 11(3): 27-45
Published online Mar 28, 2019. doi: 10.4329/wjr.v11.i3.27
Published online Mar 28, 2019. doi: 10.4329/wjr.v11.i3.27
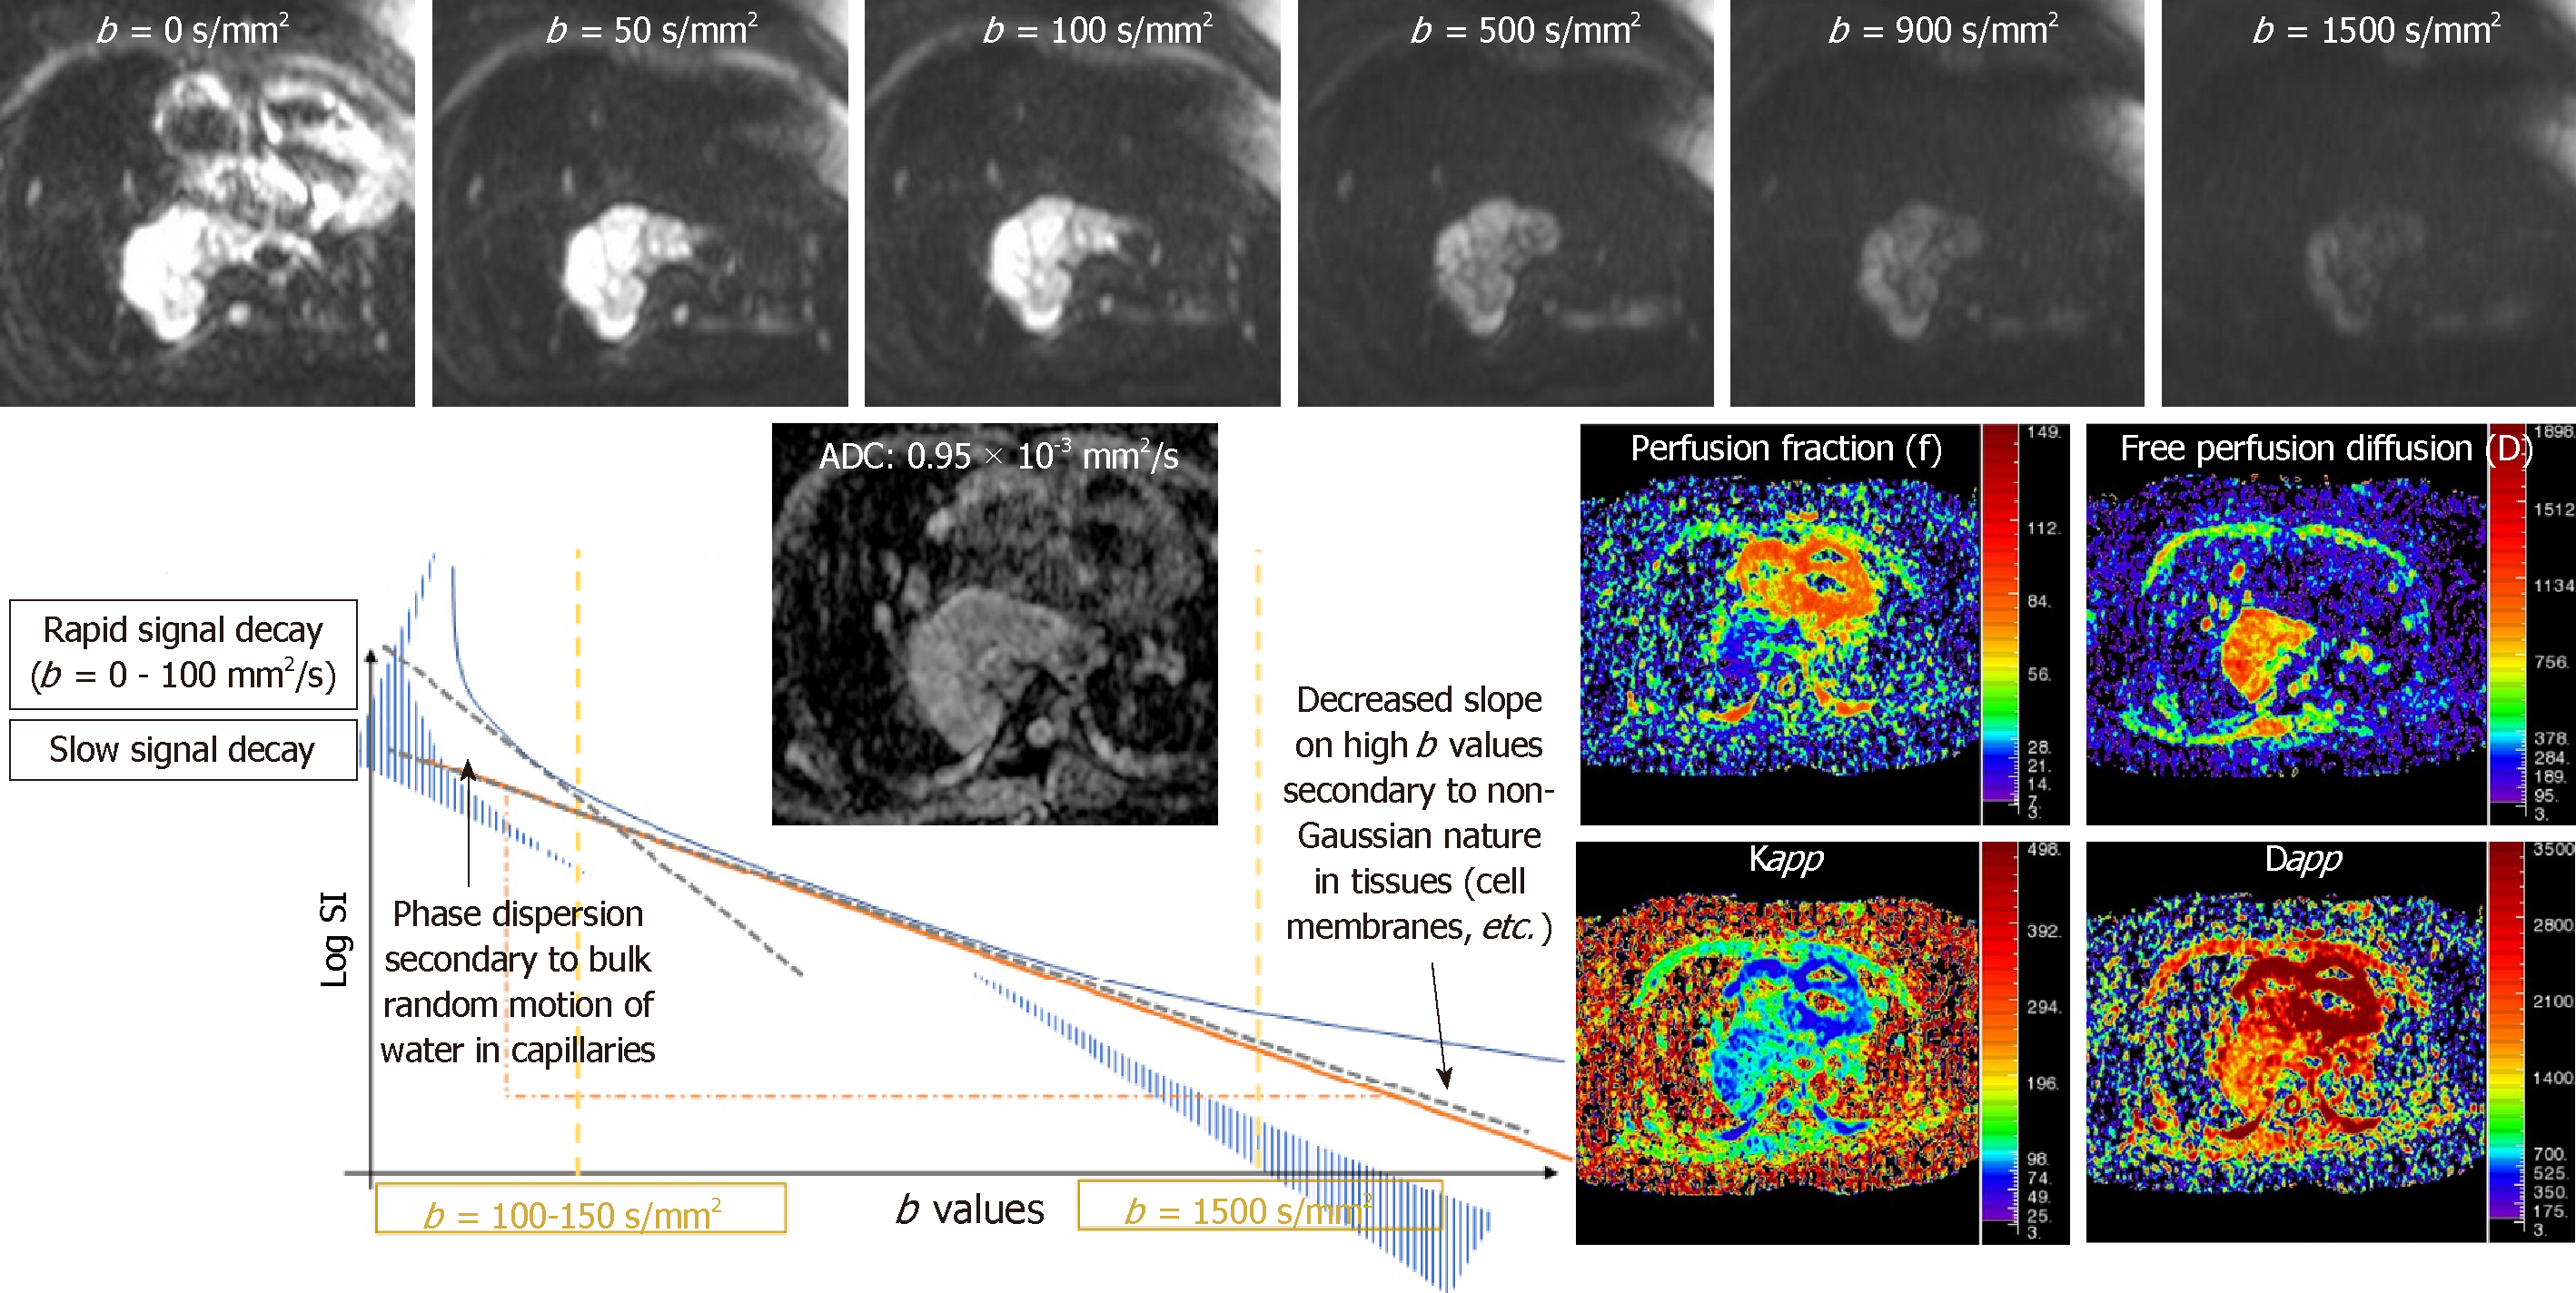
Figure 1 Different schemes on diffusion weighted imaging.
Diagram represents the different diffusion weighted imaging models: Monoexponential, intravoxel incoherent motion and diffusion kurtosis imaging. Top images represent the behaviour of an esophageal leiomyosarcoma with different b values. Apparent diffusion coefficient and parametric maps of intravoxel incoherent motion -derived (perfusion fraction and free perfusion diffusion) and kurtosis-derived (Kapp and Dapp) biomarkers are also shown. IVIM: Intravoxel incoherent motion.
Figure 2 Perfusion weighted imaging of non-invasive thymoma.
A 38 year - old male with an anterior mediastinal well-defined solid nodule, without signs of local infiltration of adjacent structures. A: Dynamic contrast-enhanced magnetic resonance (DCE-MR) derived area under the curve parametric map reveals a significant uptake of intravenous gadolinium based contrast (white arrow); B: DCE-MR derived time intensity curve shows a moderate initial slope of enhancement with a delayed plateau and with a time to peak less than 120 s (pink curve). This is in keeping with non–invasive thymoma (stage I Masaoka–Koga). AUC: Area under the curve; DCE-MR: Dynamic contrast-enhanced magnetic resonance.
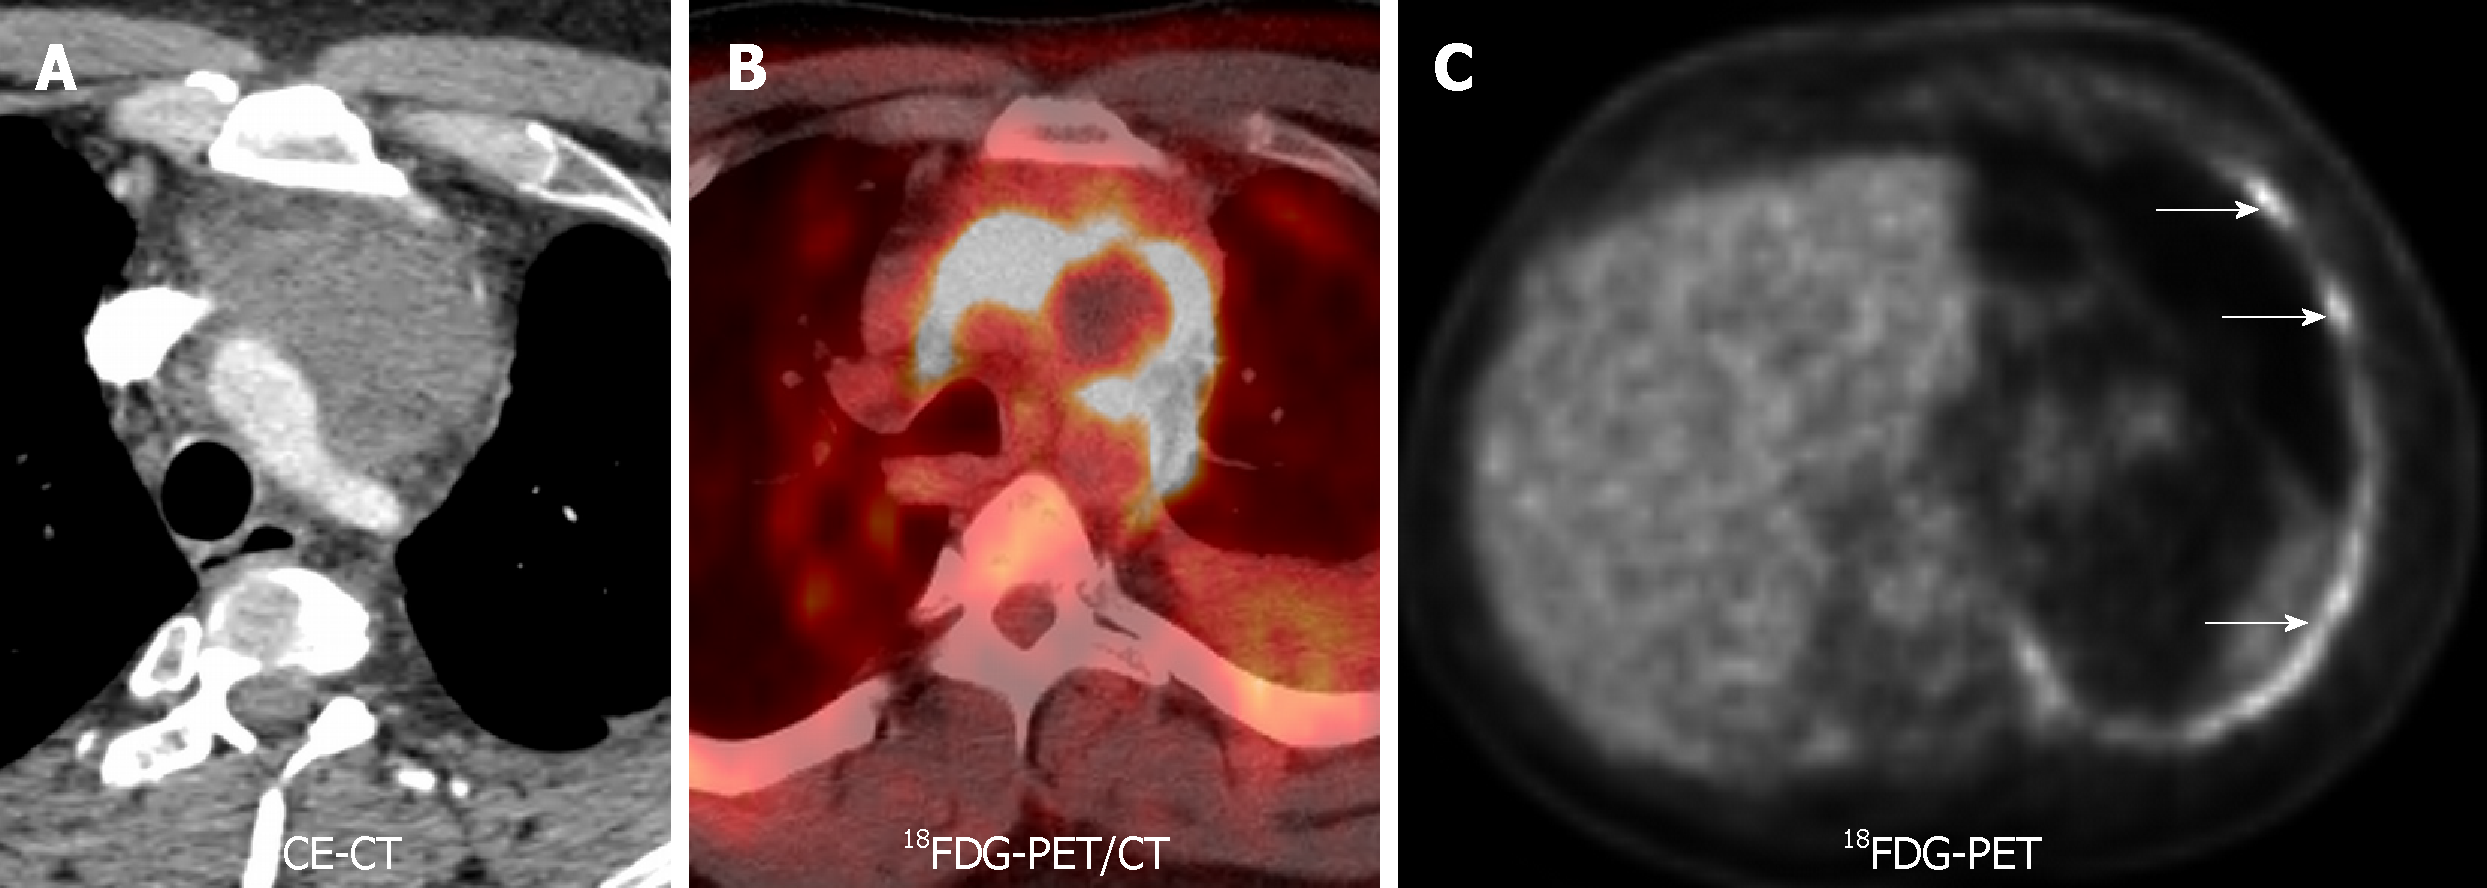
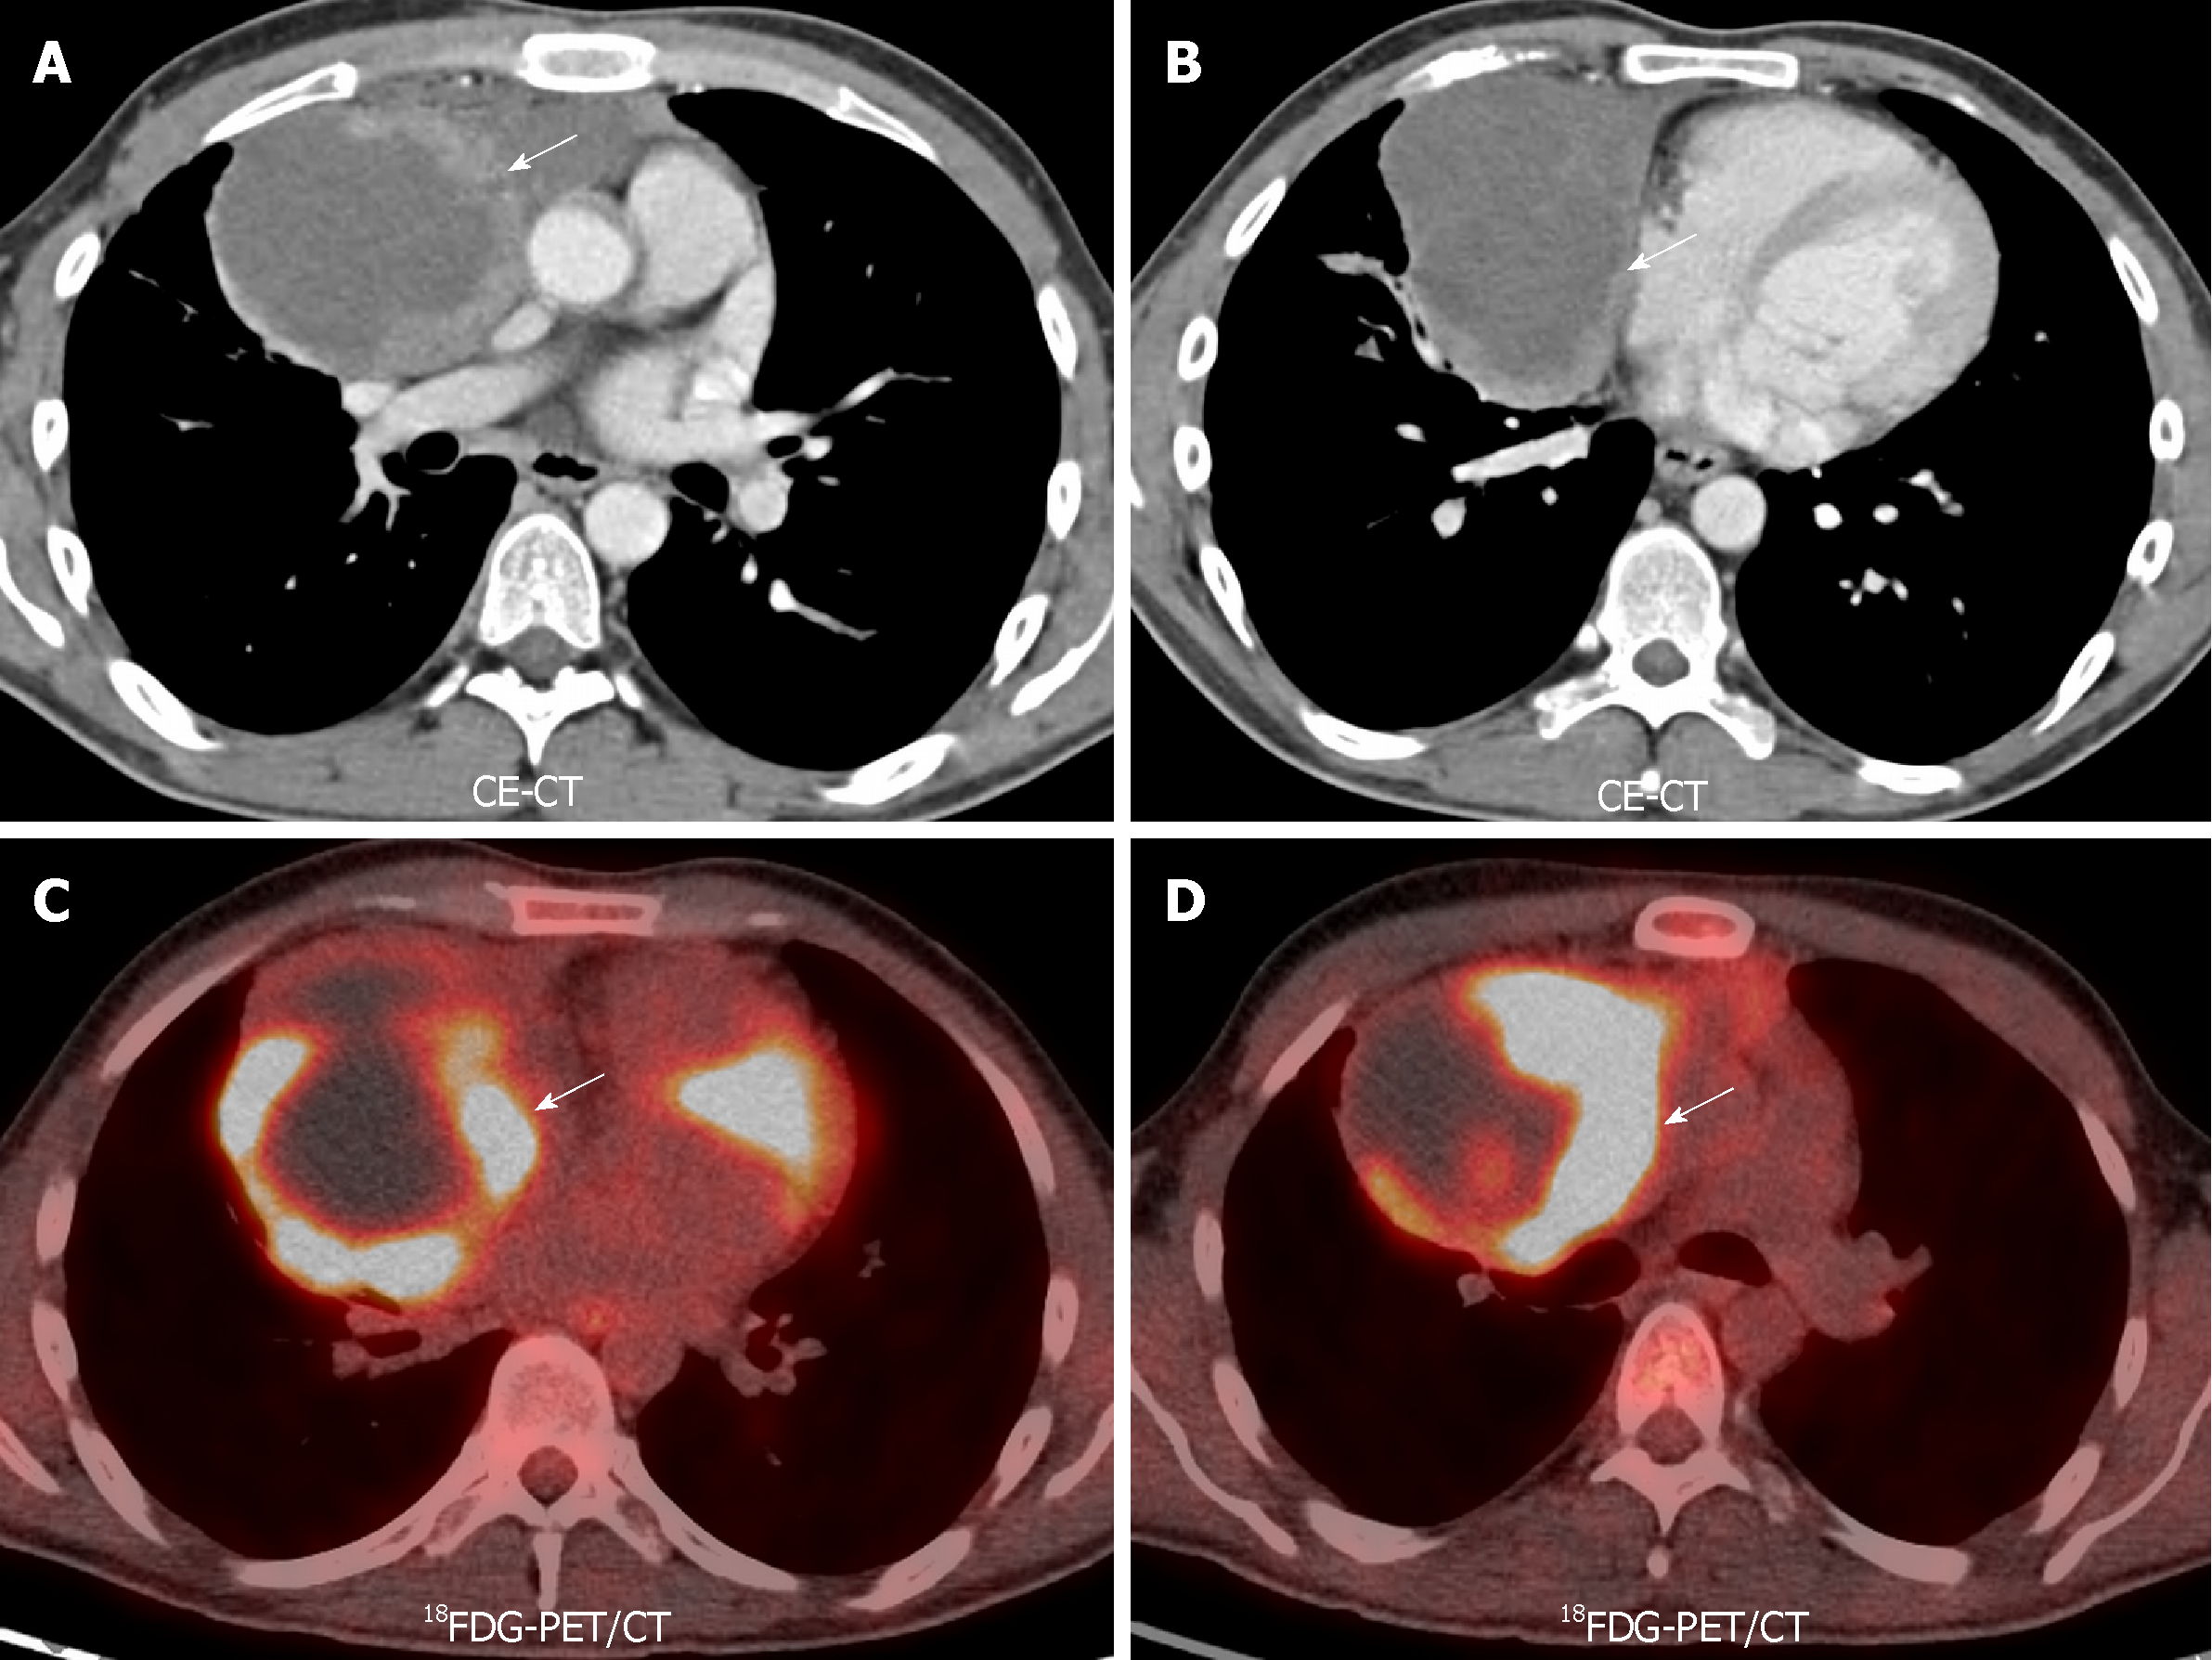
Figure 3 18F-Fluorodeoxiglucose positron emission tomography/computed tomography of a thymic carcinoma.
A 34-year-old with chest pain, found to have infiltrative mass on pulmonary embolism protocol. Pathology revealed a thymic carcinoma. A and B: Contrast-enhanced computed tomography and fused 18F-Fluorodeoxiglucose positron emission tomography/computed tomography showed an 18F-Fluorodeoxiglucose avid anterior mediastinal mass infiltrating thoracic vascular vessels; C: Concentric increased 18F-Fluorodeoxiglucose activity in the left pleura was proven to represent metastatic disease (white arrows). 18F-FDG-PET/CT: 18F-Fluorodeoxiglucose positron emission tomography/computed tomography; 18FDG-PET: 18F-Fluorodeoxiglucose positron emission tomography; CE-CT: Contrast-enhanced computed tomography.
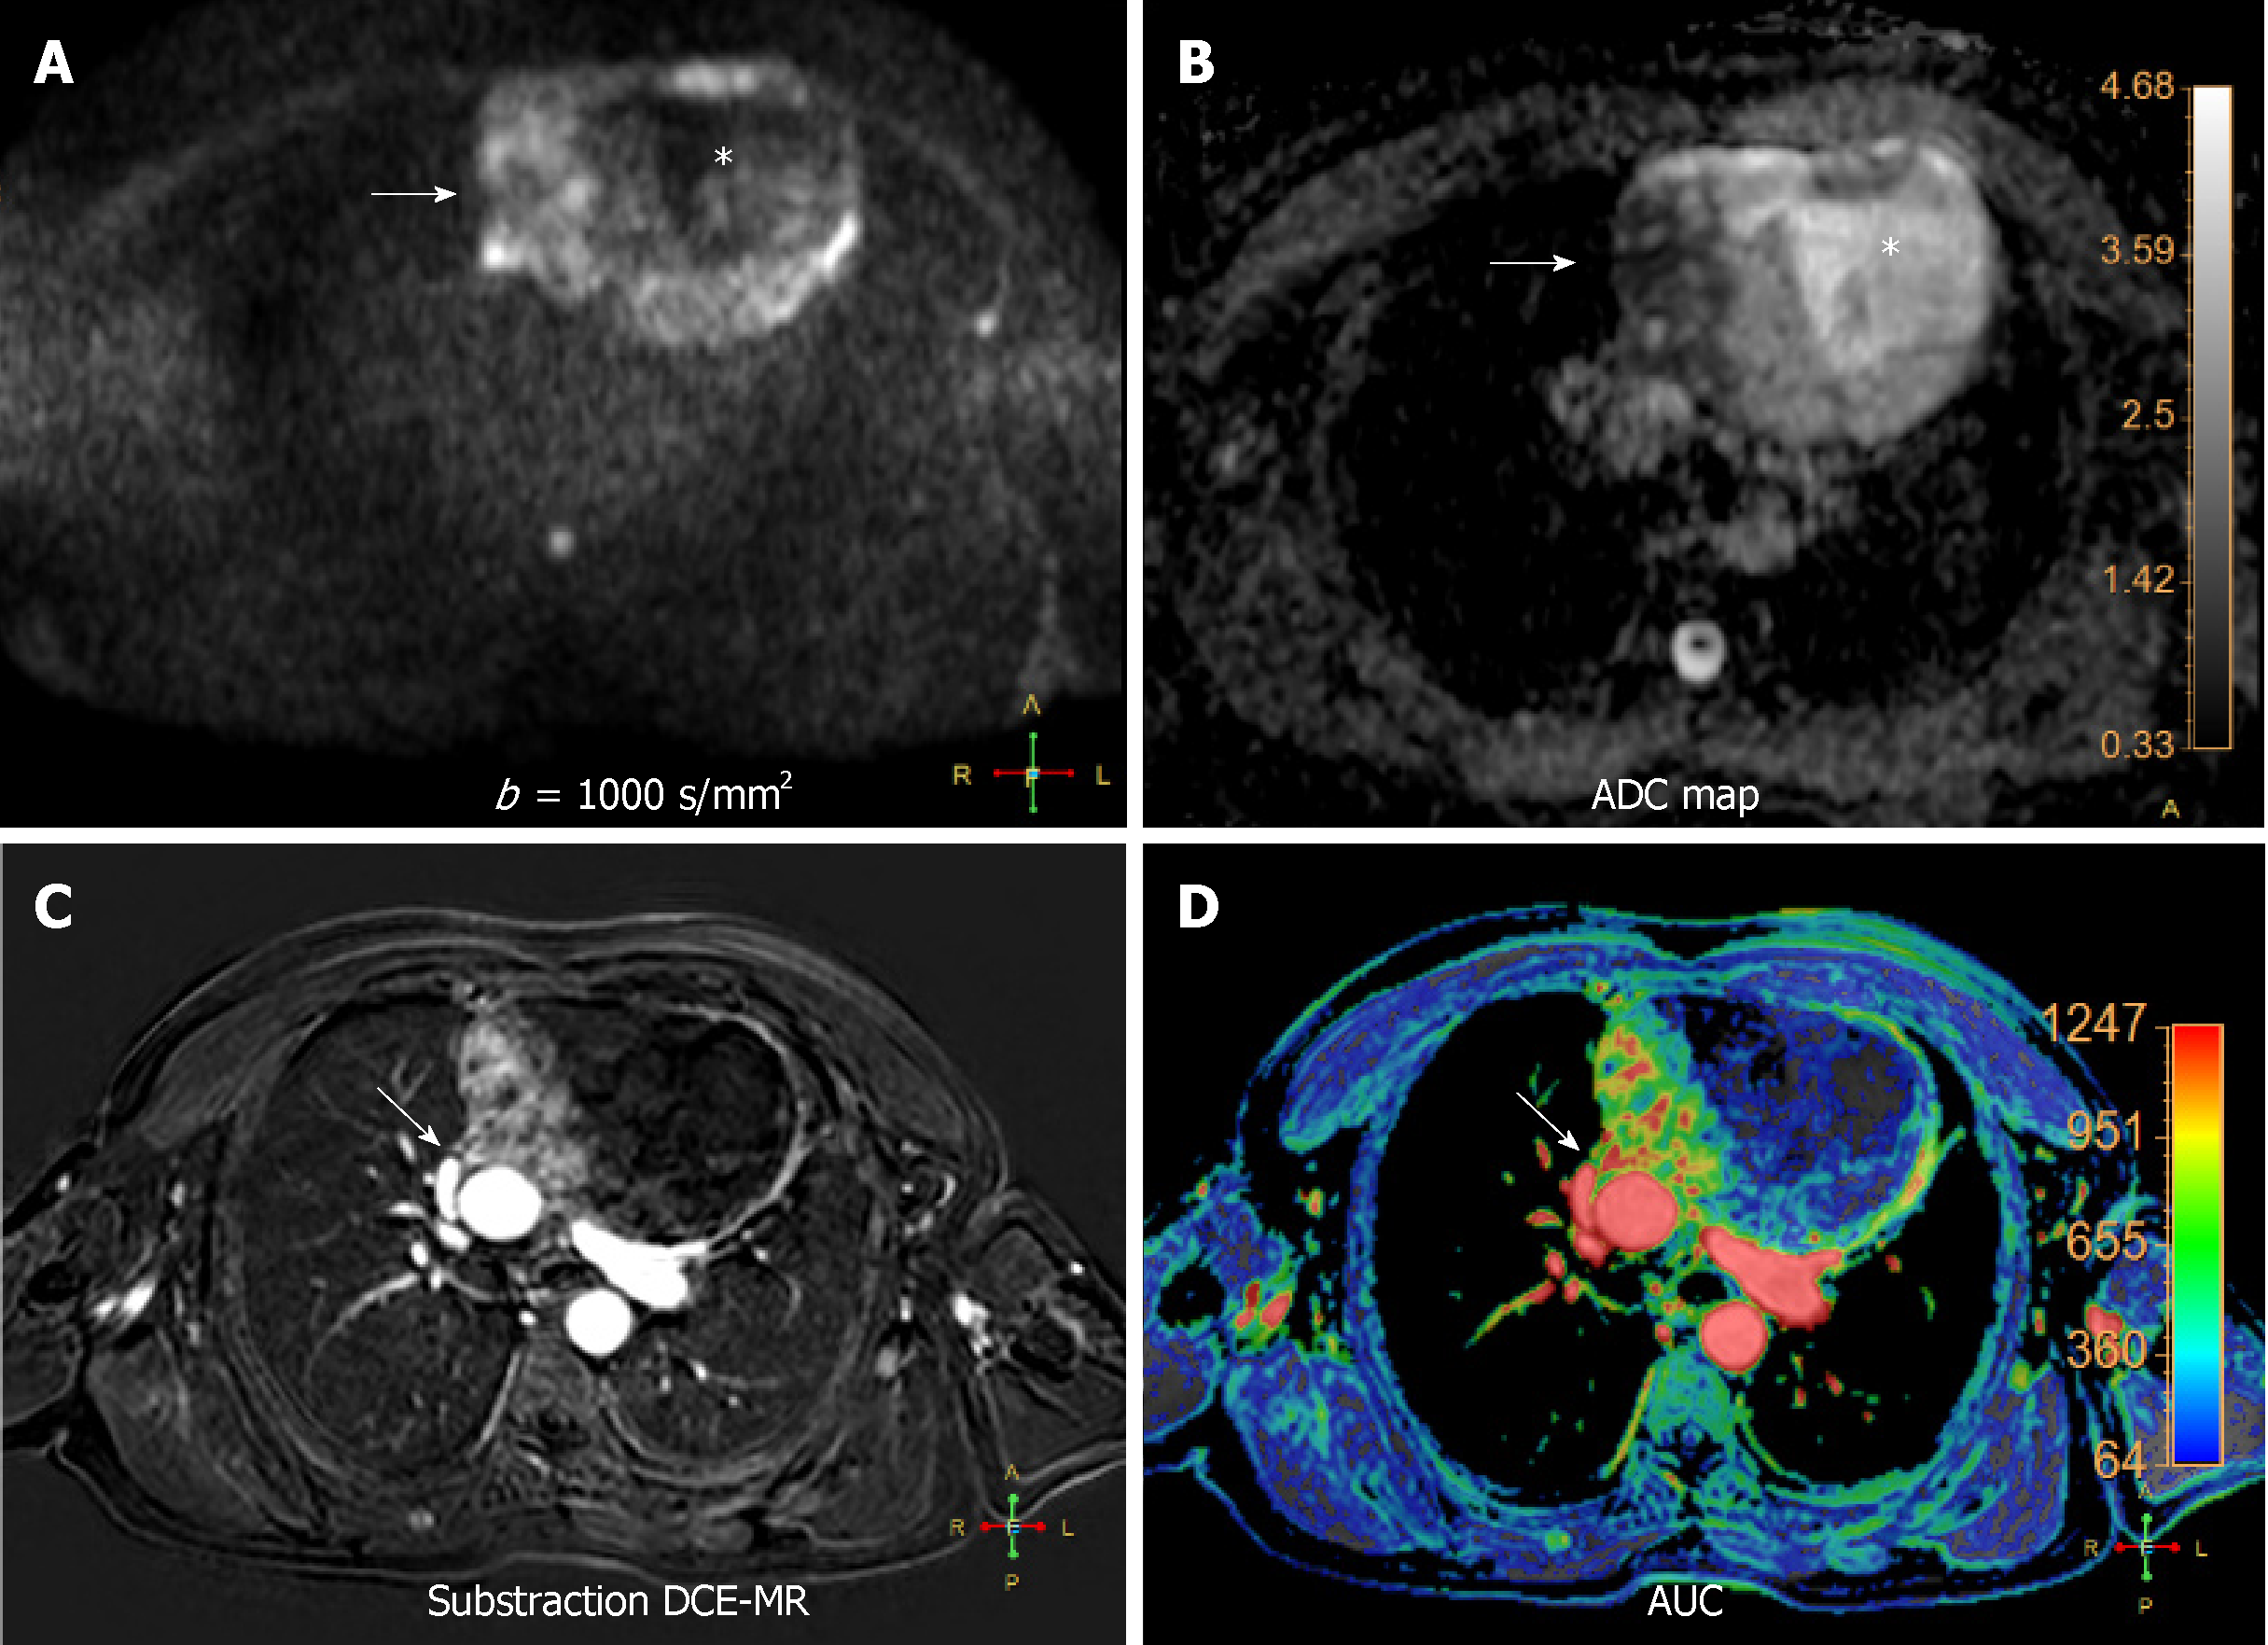
Figure 4 Multiparametric functional magnetic resonance imaging thymoepithelial mass.
A 63 year-old male with a complex cystic anterior mediastinal mass. A and B: High b value diffusion-weighted imaging (DWI) (b = 1000 s/mm2) (A) and corresponding apparent diffusion coefficient (ADC) map (B) revealing the complex behaviour of the lesion. In this case, DWI can differentiate the solid (white arrow on A and B) and cystic (white asterisk on A and B) components and also reveals heh restrictive behaviour of the solid part of the mass (ADC: 1.12-1.23 × 10⁻³ mm2/s), related to hypercellularity; C and D: Substraction of dynamic contrast-enhanced magnetic resonance on the arterial phase (C) and area under the curve parametric map (D) showing the locally invasive behaviour of the lesion to the pericardium and adjacent ascending aorta (white arrows on C and D). The mass corresponded to an invasive thymoma stage III of Masaoka–Koga classification system. DWI: Diffusion-weighted imaging; ADC: Apparent diffusion coefficient; AUC: Area under the curve; DCE-MR: Dynamic contrast-enhanced magnetic resonance.
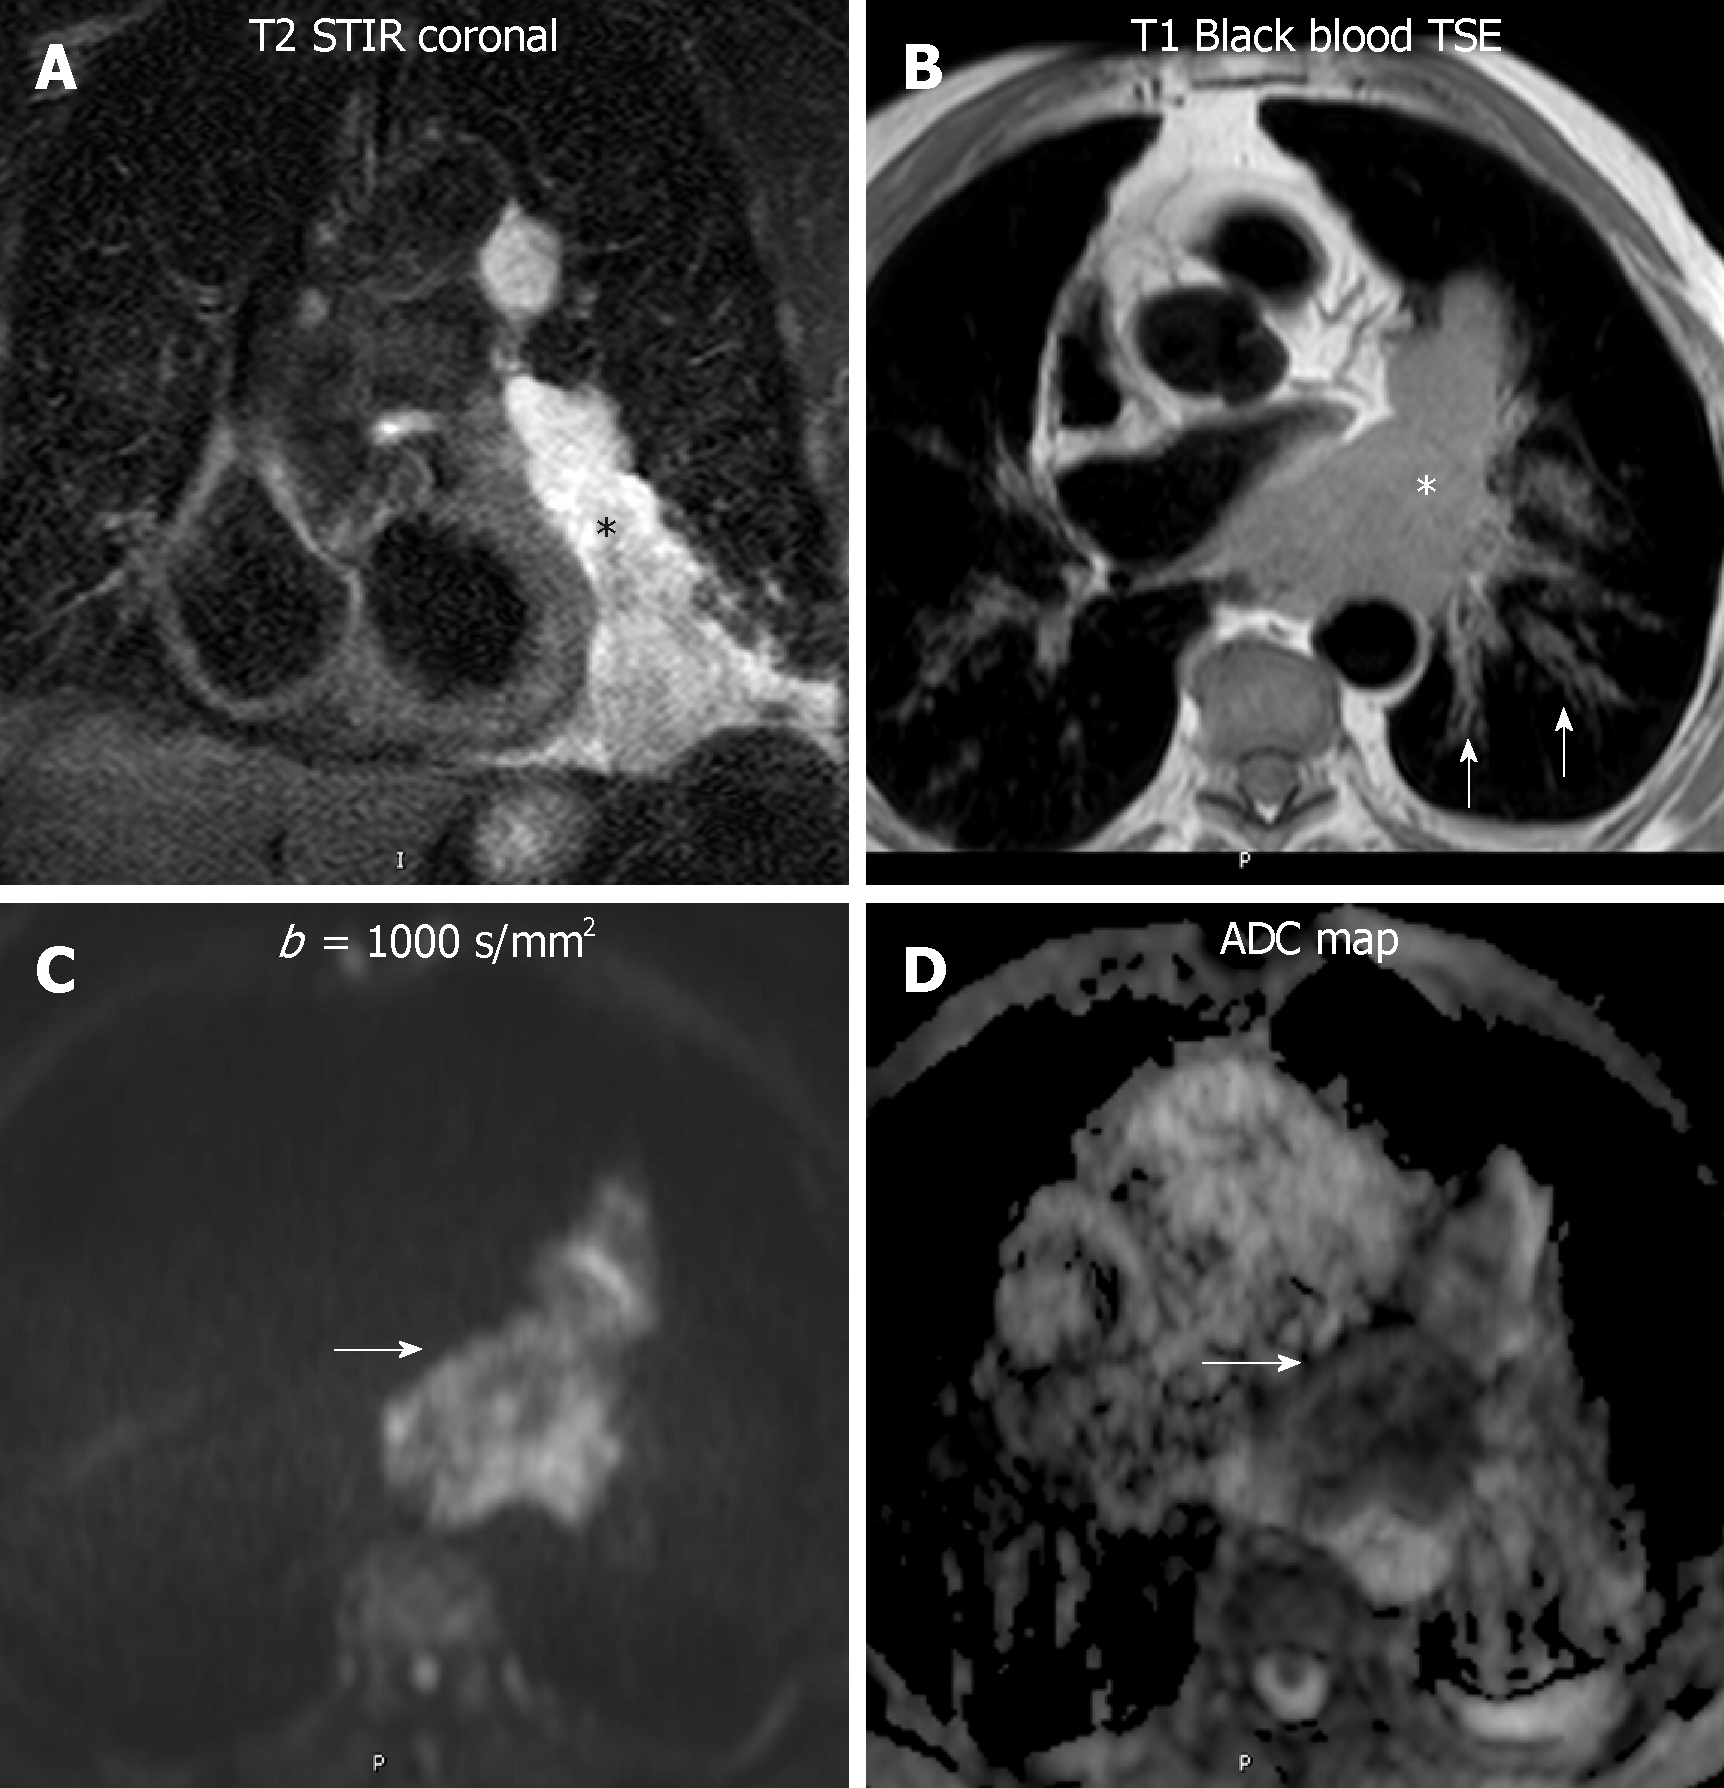
Figure 5 Diffusion weighted imaging of a lymphoma.
An 82 year - old man with a paracardiac lymphomatous mass. A: The lesion is hyperintense in short tau inversion recovery (black asterisk); B: On black blood turbo spin echo T1-weighted image, the lesion is slightly hyperintense compared to striated muscle (white asterisk), with infiltration of the pericardium and hilar vessels. Secondary involvement of the left axial interstitium, bilaterally (white arrows on B); C and D: In high b value diffusion-weighted imaging (b: 1000 s/mm2) the mass showed high signal intensity, with low apparent diffusion coefficient: 1.1 × 10⁻³ mm2/s on the apparent diffusion coefficient map, in keeping with lymphoma (white arrows on C and D). STIR: Short tau inversion recovery; TSE: Turbo spin echo; ADC: Apparent diffusion coefficient.
Figure 6 18F-Fluorodeoxiglucose positron emission tomography/computed tomography of a germ cell tumor.
A 27-year-old man with back pain, found to have germ cell tumor on 18F-Fluorodeoxiglucose positron emission tomography/computed tomography (18FDG-PET/CT). A and B: Contrast-enhanced CT shows a cystic mass with enhancing solid border (white arrows on A and B); C and D: Note 18FDG activity only within the solid portions of the lesion on fused 18FDG-PET/CT acquisitions (white arrows on C-D). 18FDG-PET/CT: 18F-Fluorodeoxiglucose positron emission tomography/computed tomography; CE CT: Contrast-enhanced computed tomography.
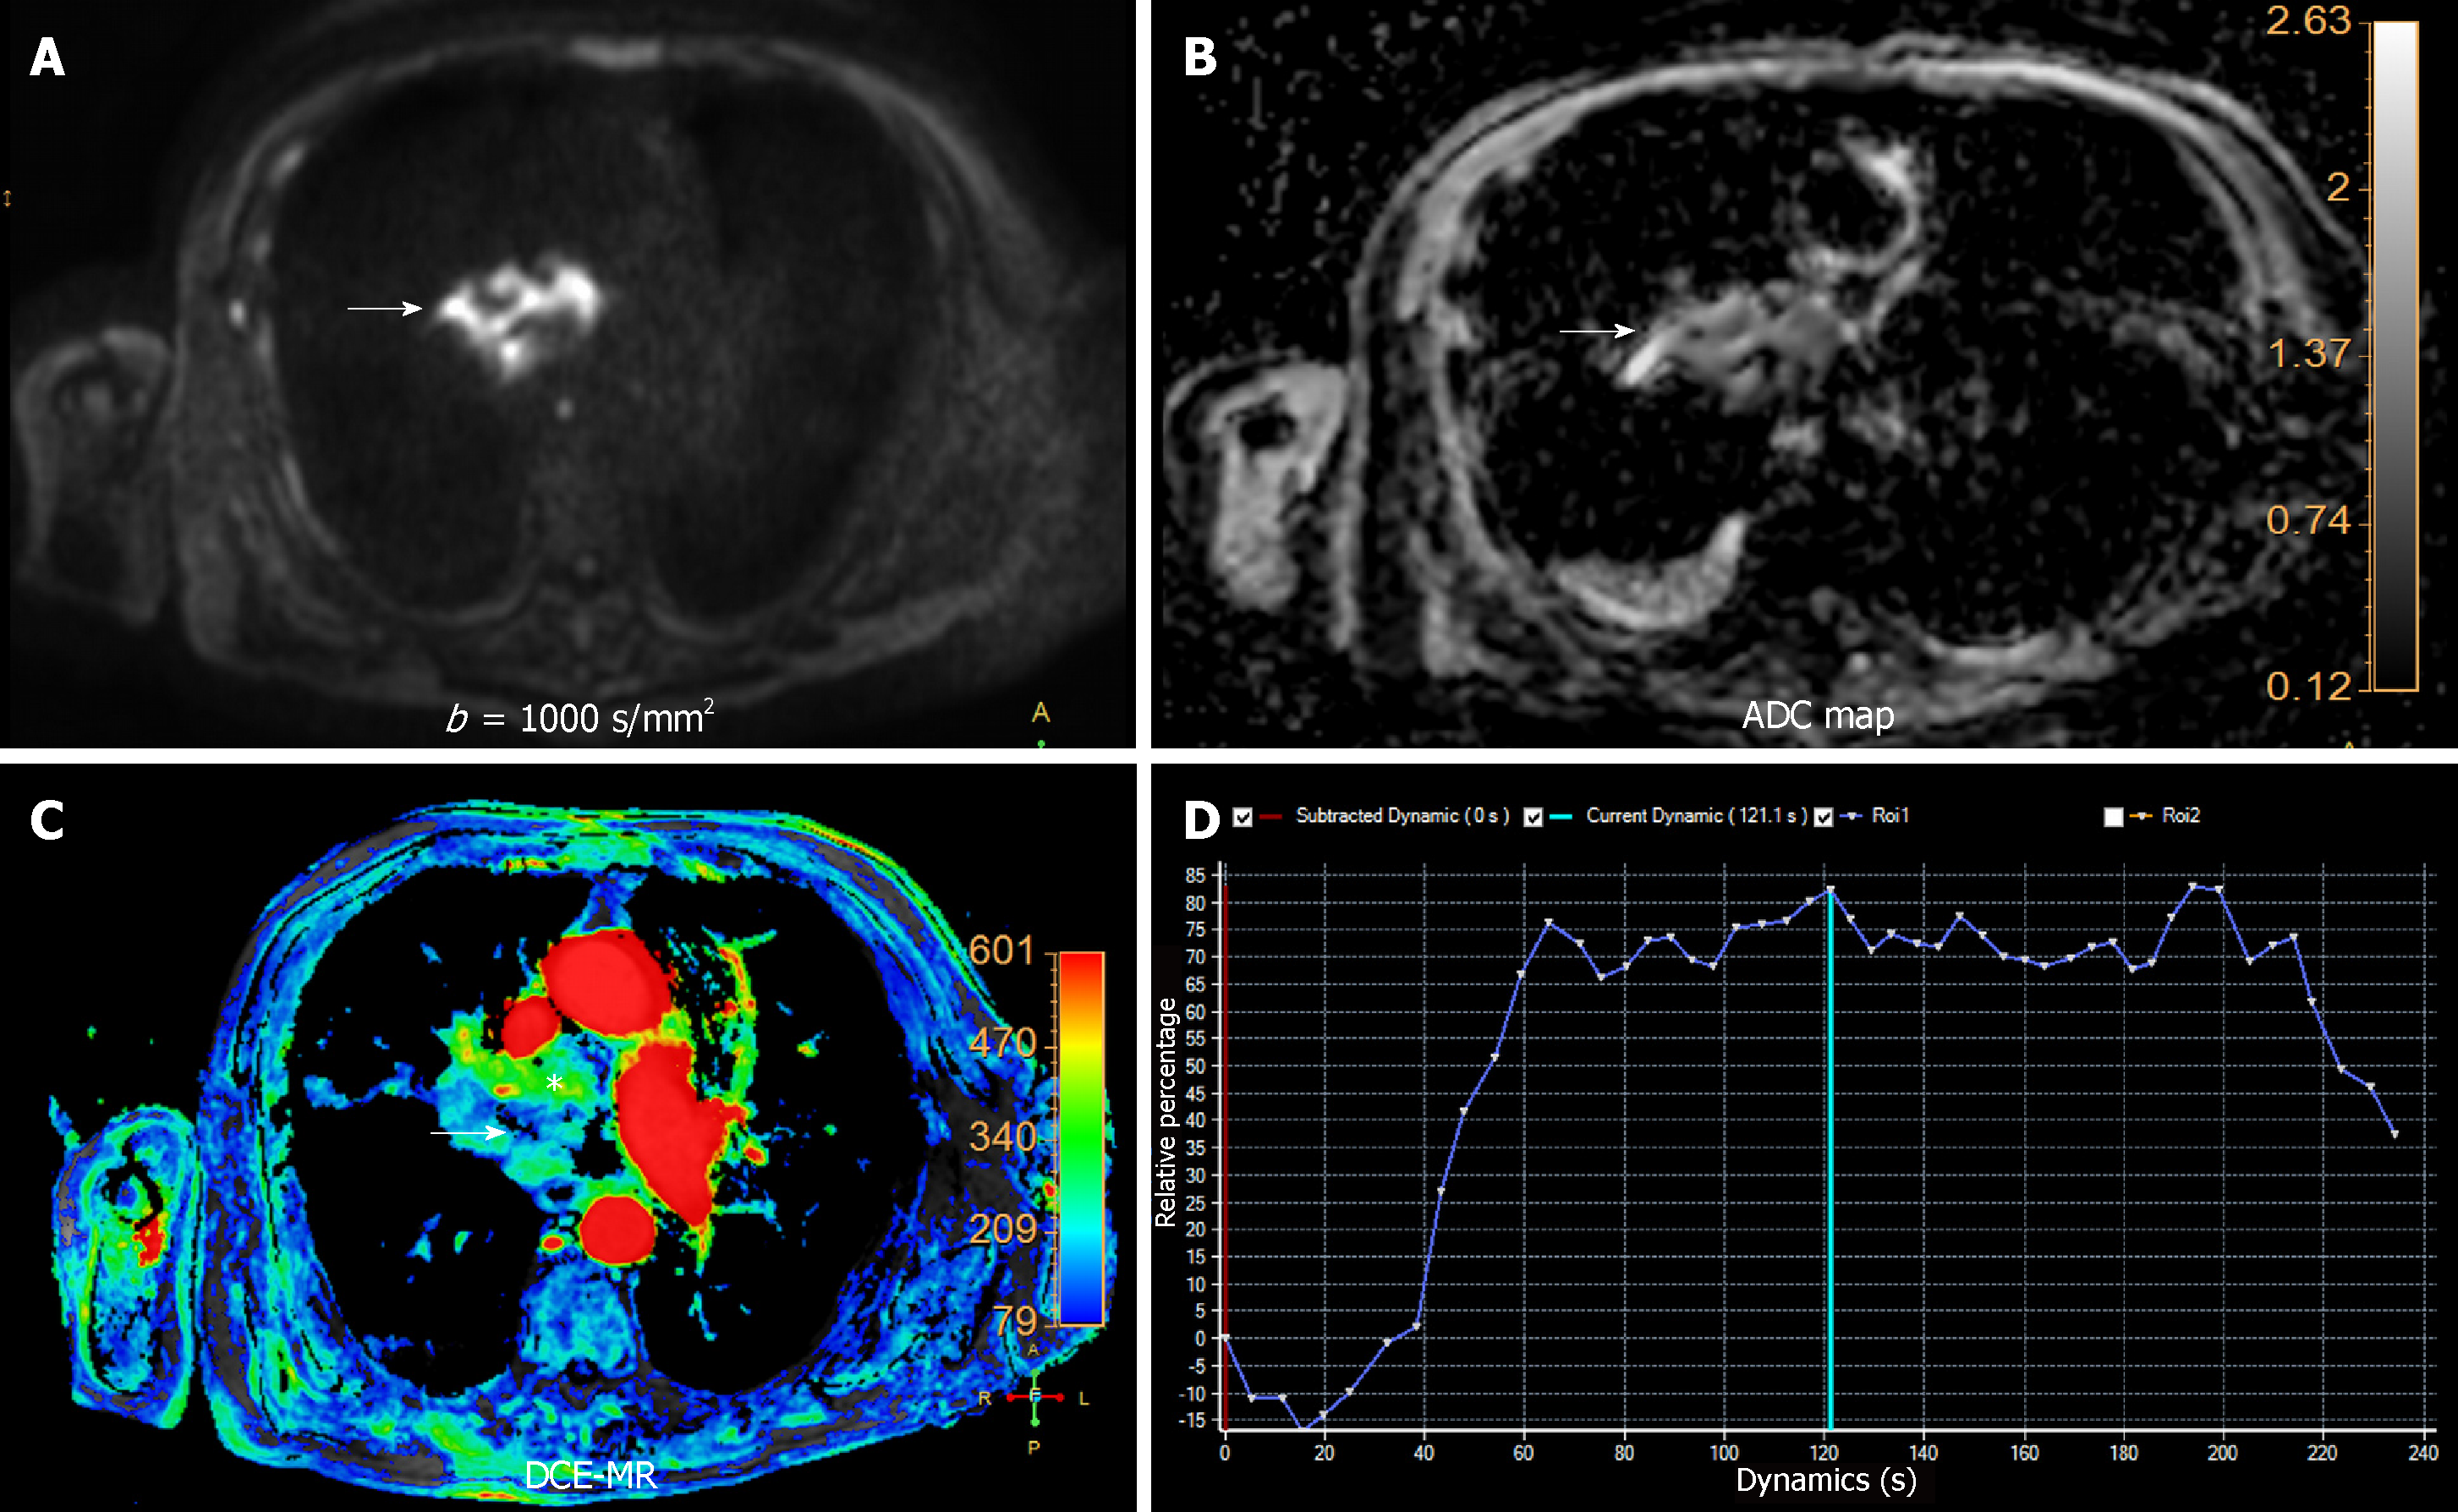
Figure 7 Multiparametric functional chest magnetic resonance of central lung cancer.
A 78 year-old male with a central hilar mass in keeping with epidermoid type lung carcinoma. A and B: High b value (b = 1000 s/mm2) and apparent diffusion coefficient (ADC) map (B) revealing a heterogeneous and restrictive behavior of the lesion, related to hypercellularity and aggressiveness (white arrows on A and B). The mean ADC was 0.97 × 10⁻³ mm2/s, confirming a malignant origin; C: Dynamic contrast-enhanced magnetic resonance showing a significant uptake of gadolinium based contrast agent on area under the curve parametric map (white asterisk), with central necrosis (White arrow on C); D: Time intensity curve (TIC) plot revealing steep slope of enhancement with posterior plateau (type B TIC) also favoring a malignant etiology. DCE-MR: Dynamic contrast-enhanced magnetic resonance; ADC: Apparent diffusion coefficient; TIC: Time intensity curve.
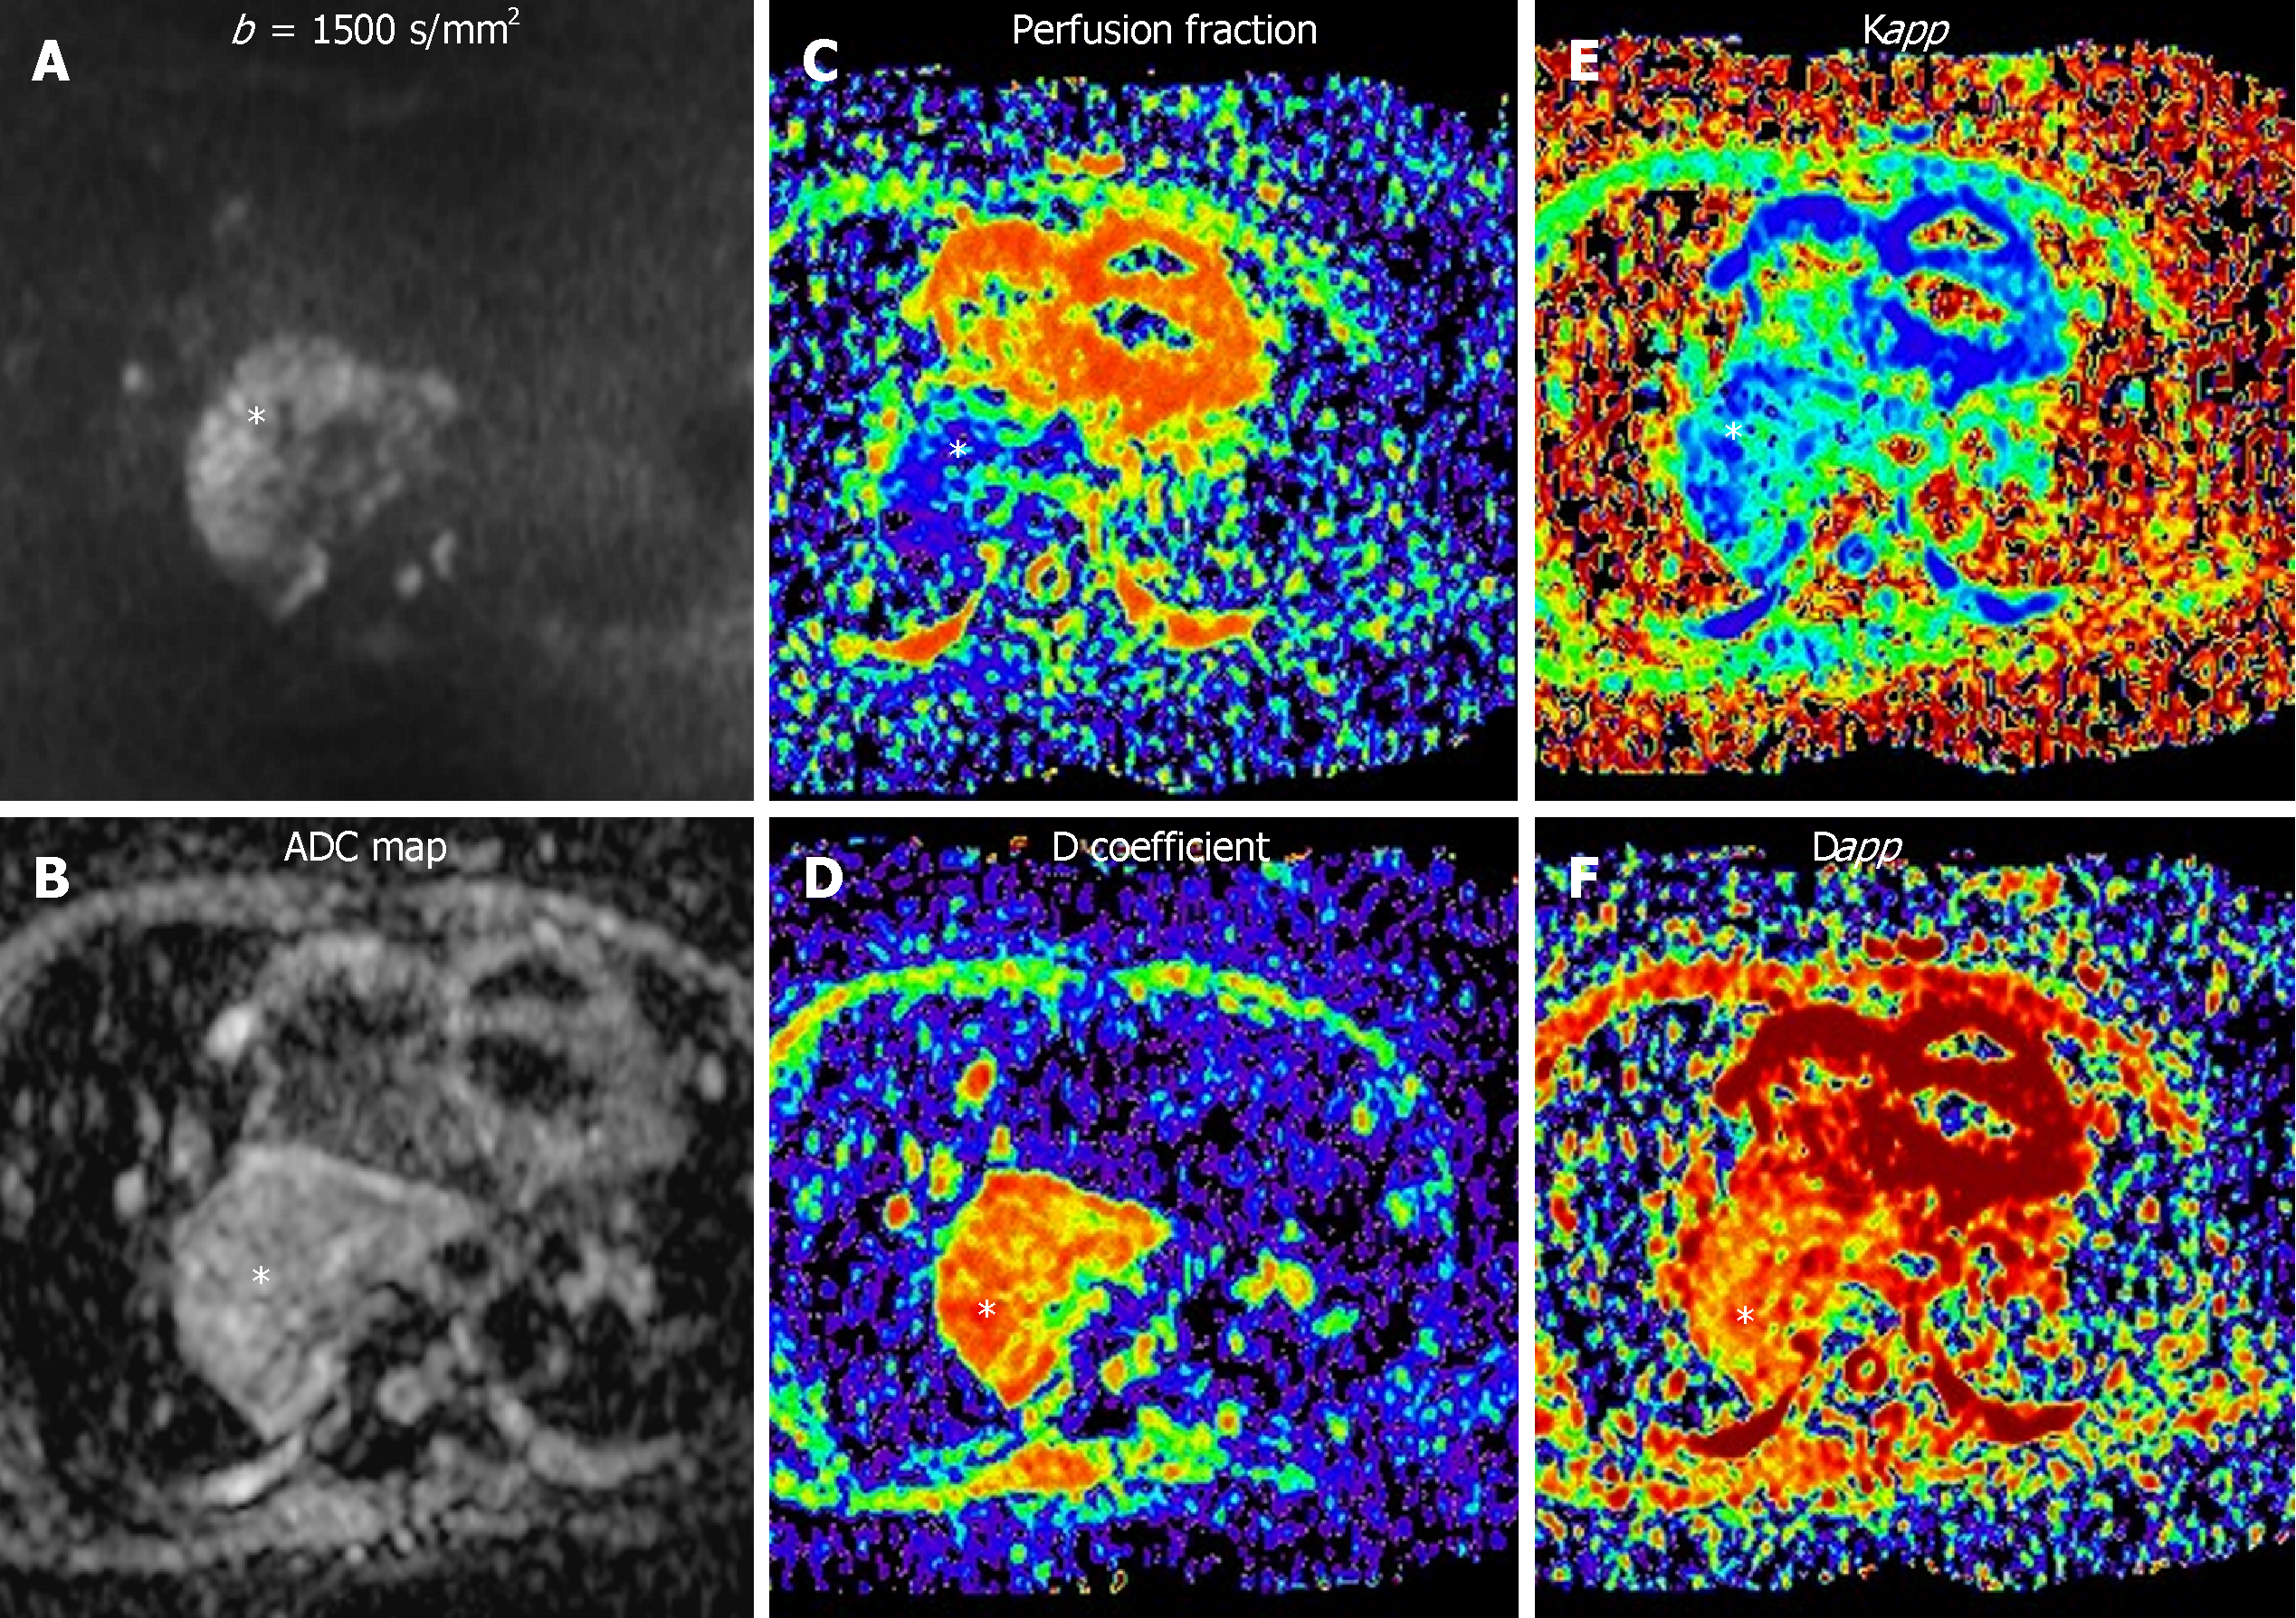
Figure 8 Different diffusion weighted imaging approaches to an aggressive middle mediastinal mass.
A 56 year-old woman with esophageal leiomyosarcoma stage IV. A-F: Restrictive behavior of the mass could be seen [Apparent diffusion coefficient (ADC): 0.951 × 10⁻³ m2/s; malignant origin]. Derived biomarkers of three different ways of quantification of diffusion-weighted imaging (white asterisk) of the mass are shown: A-B: Mono-exponential approach (A: High b value; B: ADC map); C-D: bi-exponential scheme (Intravoxel incoherent motion; C: Perfusion fraction map; D: Diffusion coefficient map); E-F: Diffusion kurtosis imaging (E: Apparent diffusional kurtosis map; F: Apparent diffusion map). ADC: Apparent diffusion coefficient.
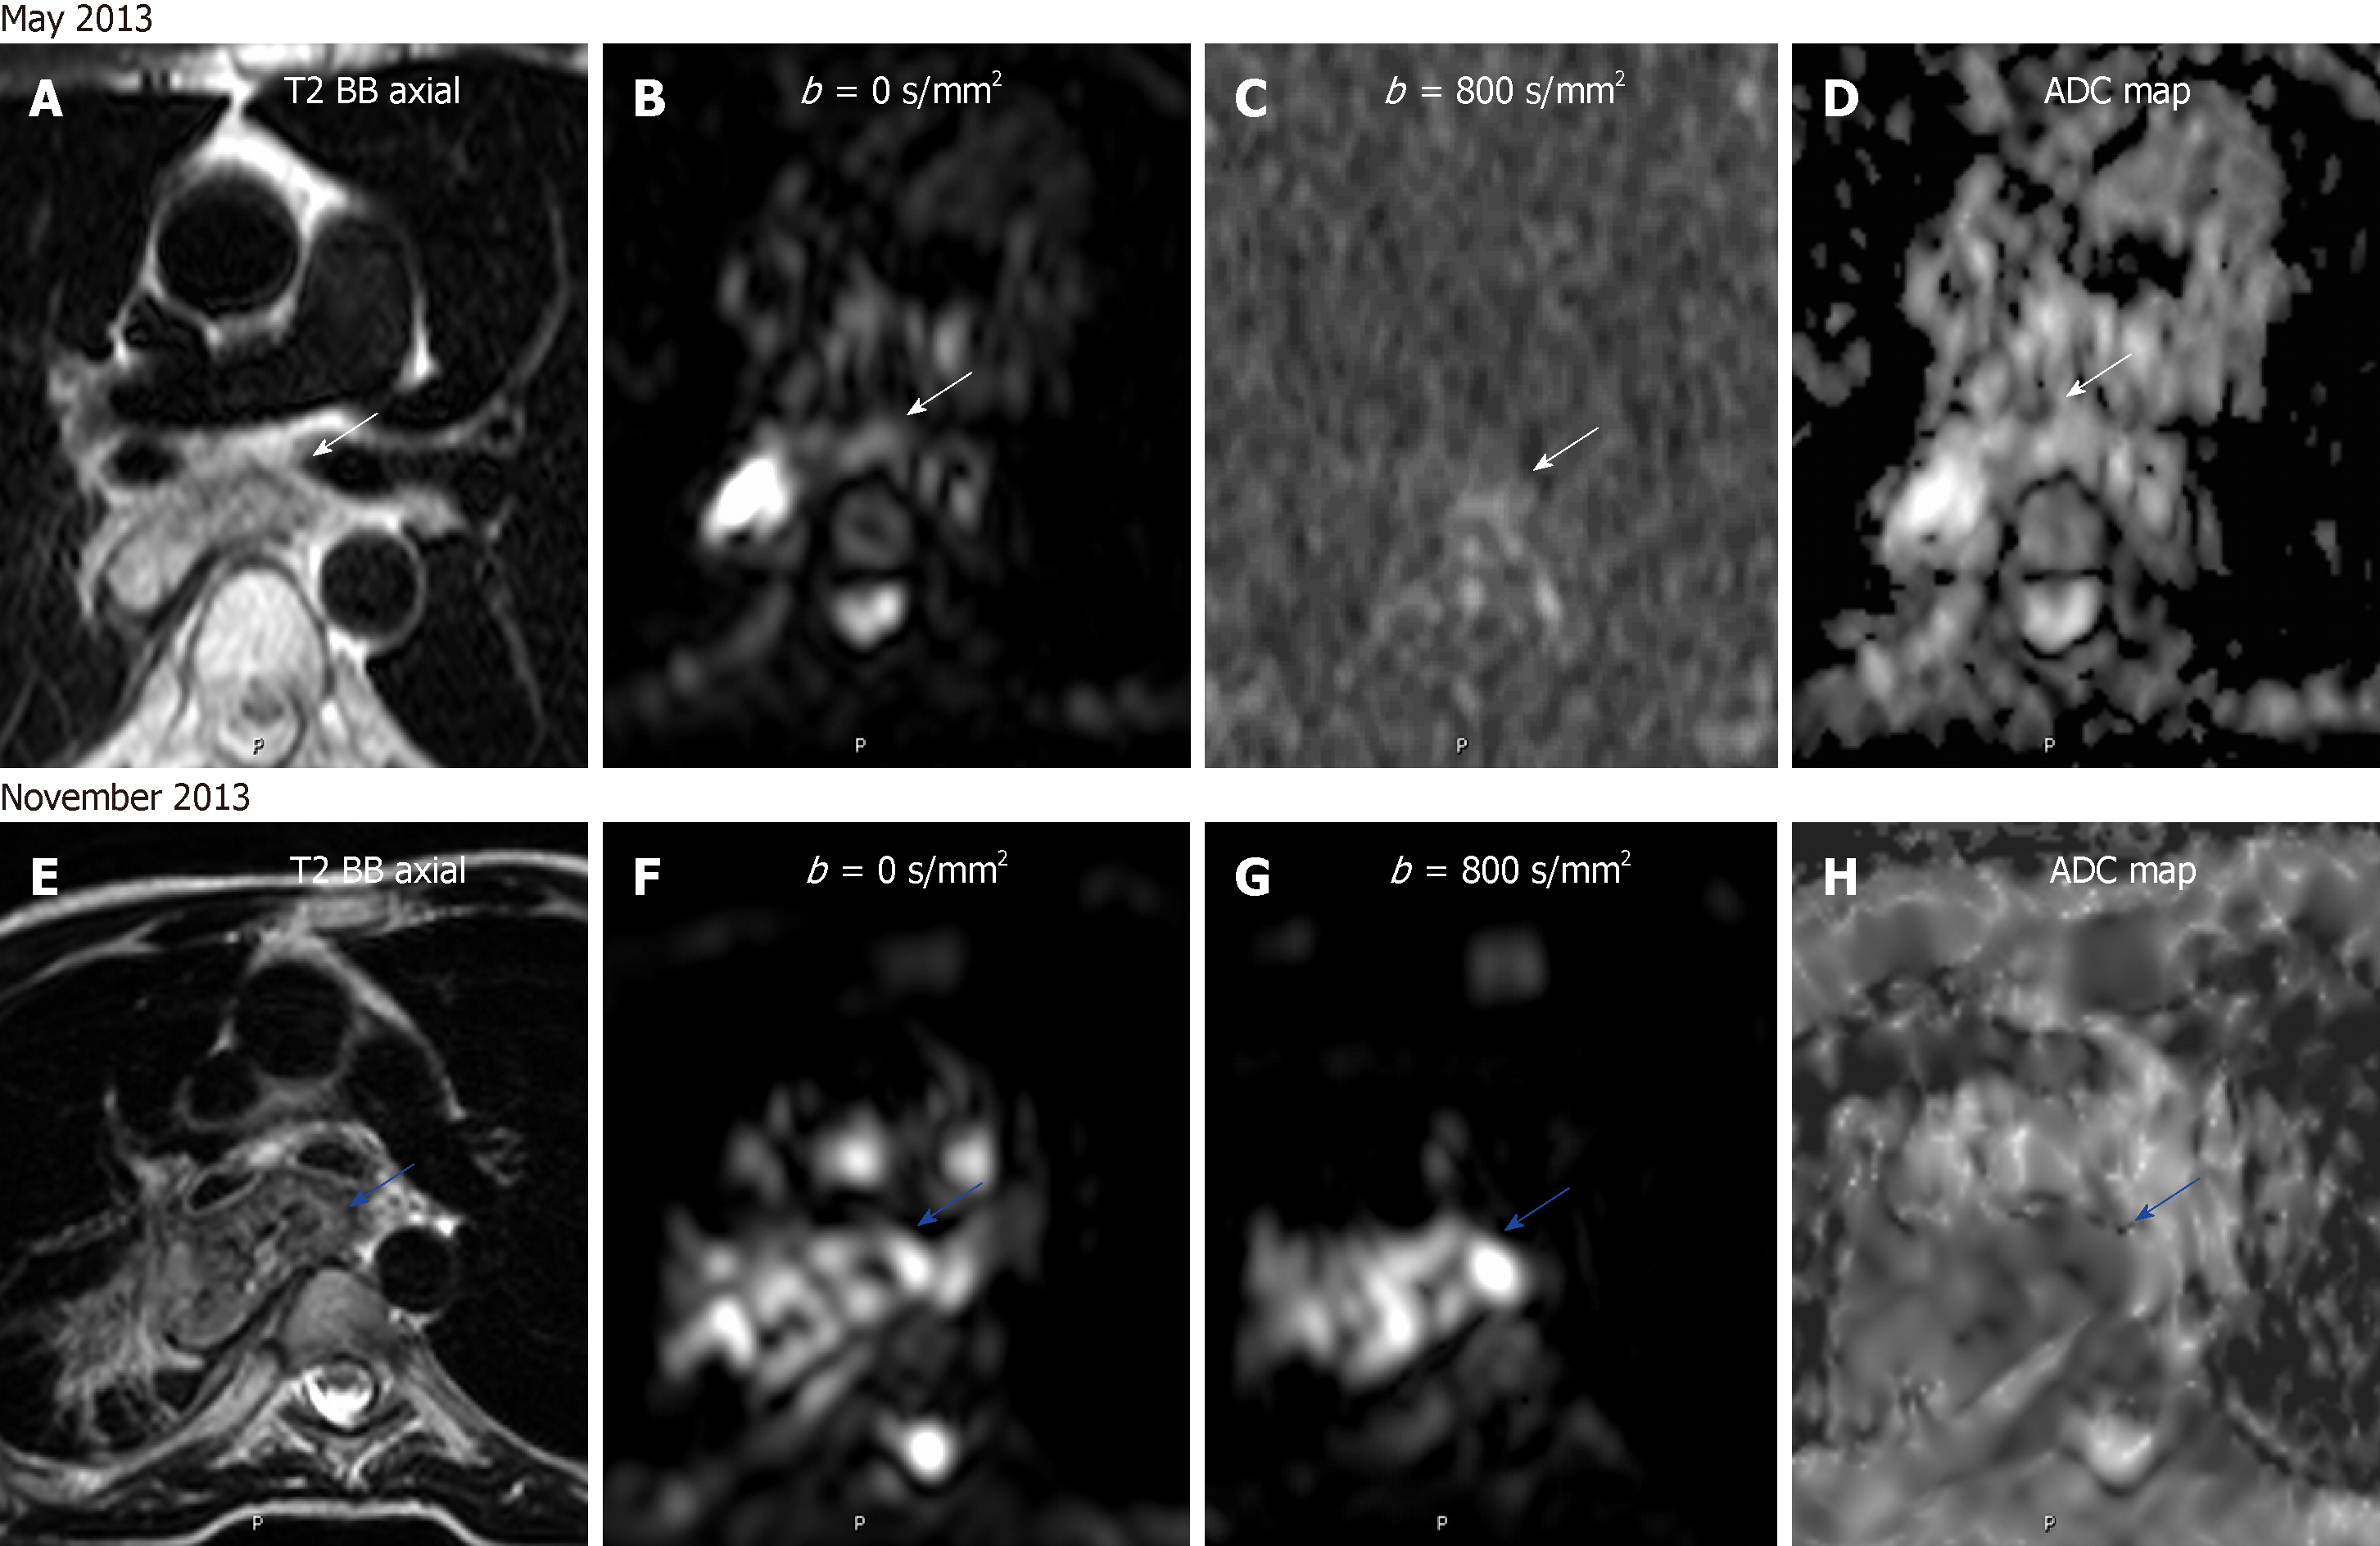
Figure 9 Treatment monitoring of an esophageal carcinoma by diffusion-weighted imaging.
A 47 year-old male with esophageal carcinoma treated with esophagectomy and gastroplasty. A-D: Post-surgery surveillance magnetic resonance (MR) shows a normal appearing anastomosis on turbo spin echo (TSE) T2-weighted sequence and with no restriction on diffusion-weighted imaging and apparent diffusion coefficient (ADC) map (B-D; white arrows); D-G: Follow-up MR examination done 6 mo later revealing anastomotic thickening on TSE T2-weighted image and with restrictive behavior on diffusion-weighted whole-body imaging and ADC map (F-H), in keeping with relapse (blue arrows). ADC: Apparent diffusion coefficient.
- Citation: Broncano J, Alvarado-Benavides AM, Bhalla S, Álvarez-Kindelan A, Raptis CA, Luna A. Role of advanced magnetic resonance imaging in the assessment of malignancies of the mediastinum. World J Radiol 2019; 11(3): 27-45
- URL: https://www.wjgnet.com/1949-8470/full/v11/i3/27.htm
- DOI: https://dx.doi.org/10.4329/wjr.v11.i3.27


