©The Author(s) 2018.
World J Radiol. Sep 28, 2018; 10(9): 91-99
Published online Sep 28, 2018. doi: 10.4329/wjr.v10.i9.91
Published online Sep 28, 2018. doi: 10.4329/wjr.v10.i9.91
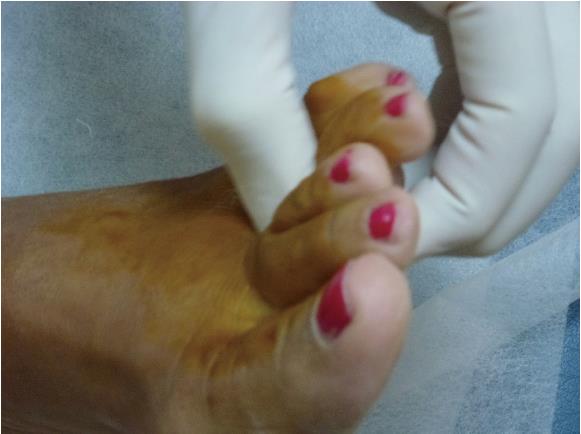
Figure 1 Thumb index finger squeeze test.
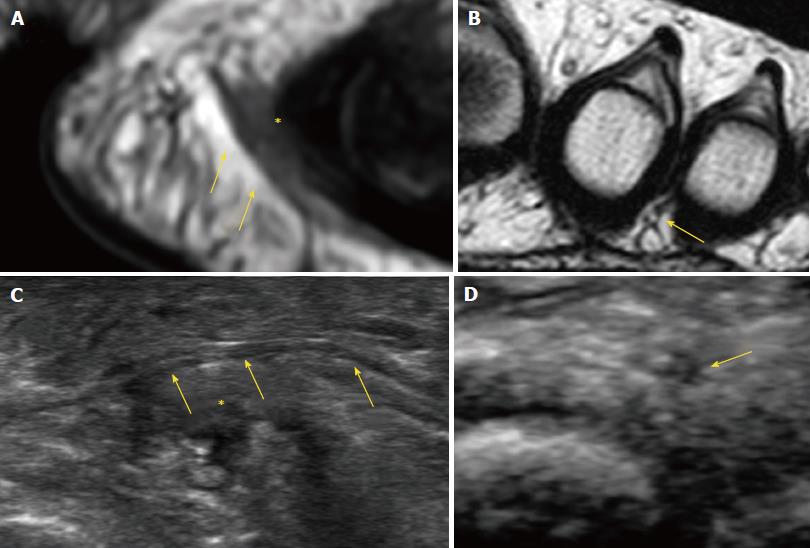
Figure 2 Imaging of the normal digital nerves.
A, B: Long and short axis views of normal digital nerves (arrows) in magnetic resonance imaging (A) and ultrasound (US) (B); C, D: Long (C) and short (D) axis views of normal digital nerves (arrows) in US. In all images, arrows indicate normal digital nerve and asterisks (*) indicate bursa.
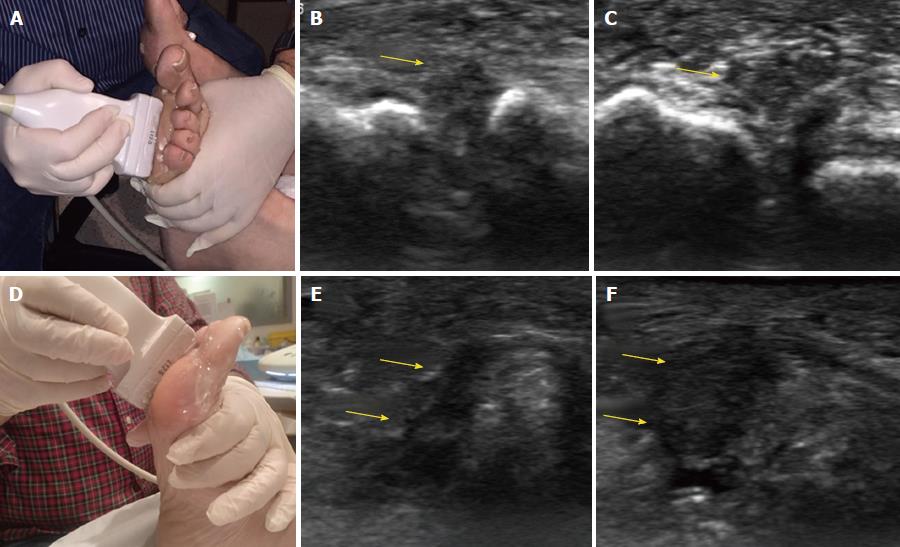
Figure 3 Ultrasound imaging of Morton’s neuroma.
A: Clasping of the forefoot in the short axis view; B, C: Short axis views of the intermetatarsal space before (B) and after (C) squeezing the forefoot; D: Clasping of the forefoot in the long axis view; E, F: Long axis views of the intermetatarsal space before (E) and after (F) squeezing the forefoot. In all images, arrows indicate Morton’s neuroma.
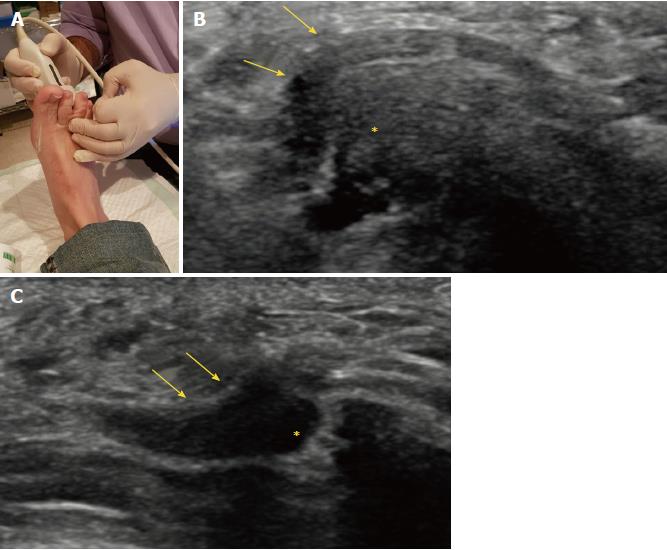
Figure 4 Displacement of Morton’s neuroma.
A: Pressure on the dorsal aspect of the web space; B, C: Long axis views of the neuroma and bursa before (B) and after (C) pressure of the dorsal aspect of the intermetatarsal space. In all images, arrows indicate Morton’s neuroma and asterisks (*) indicate bursa.
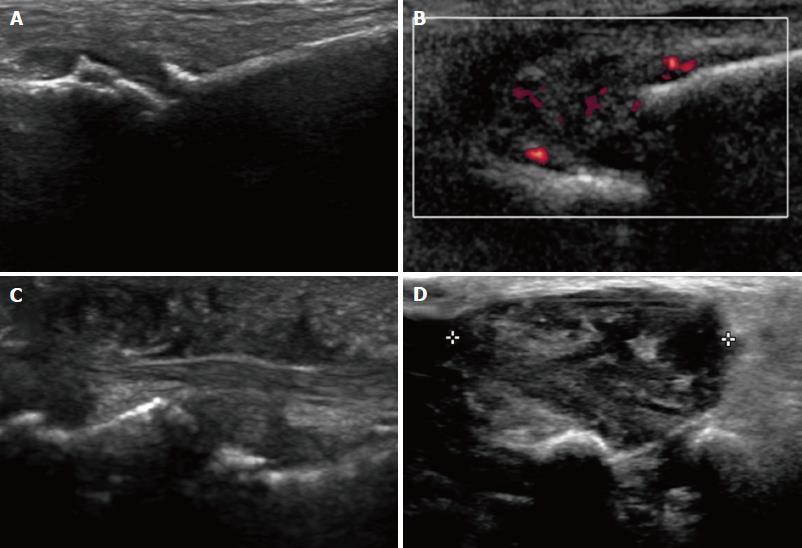
Figure 5 Causes of forefoot pain.
A: Osteoarthritis; B: Rheumatoid arthritis with metatarsophalangeal joint subluxation; C: Psoriasis with soft tissue swelling; D: Giant cell tumor of the tendon sheath.
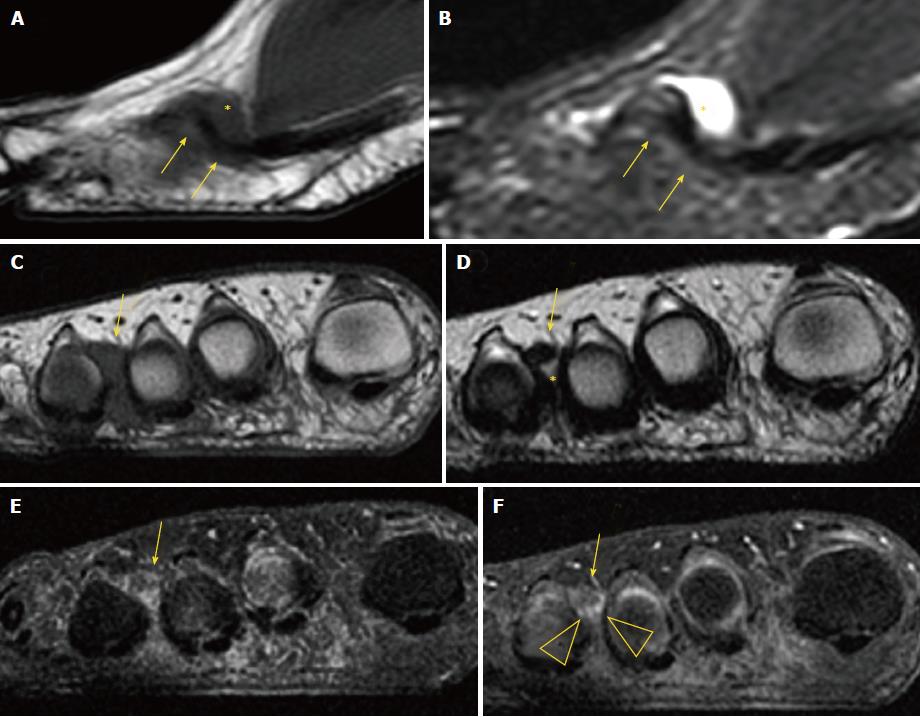
Figure 6 Magnetic resonance imaging of Morton’s neuroma.
A, B: Sagittal T1 (A) and short tau inversion recovery (B) of Morton’s neuroma and bursa; C, D: Coronal T1 (C) and T2 (D) of Morton’s neuroma and bursa. Coronal T1 fat before (A) and after gadolinium administration (B), showing enhancement of the bursal tissue surrounding the neuroma (arrowhead). In all images, arrows indicate Morton’s neuroma and asterisks (*) indicate bursa.
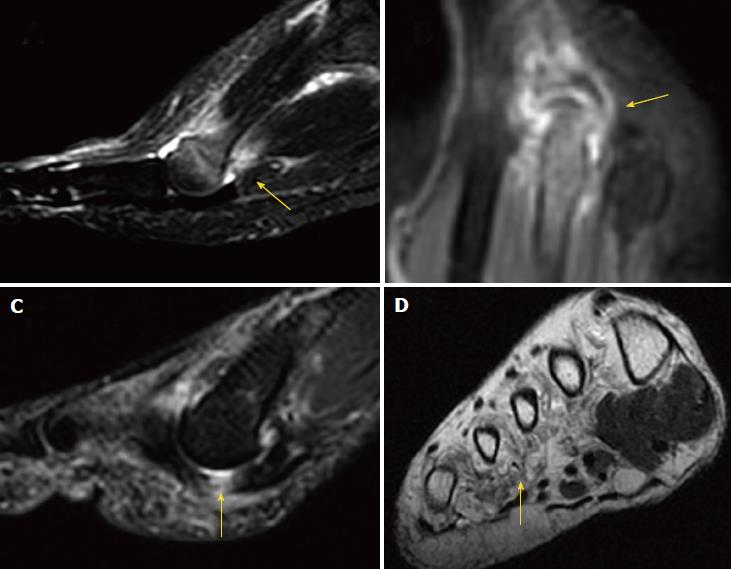
Figure 7 Magnetic resonance imaging in forefoot pain.
A: Stress fracture of the 2nd metatarsal; B: Synovitis in rheumatoid arthritis; C: Plantar plate tear (arrow); D: Muscle atrophy in diabetes (arrow).
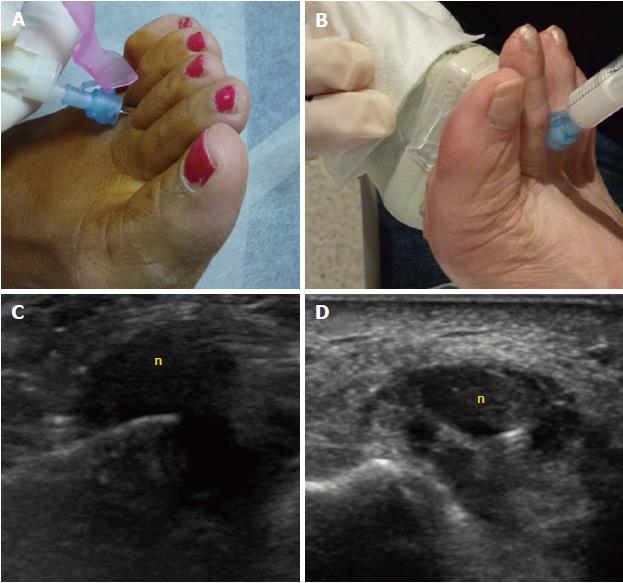
Figure 8 Morton’s neuroma injections.
A, B: Blind (A) and ultrasound (US)-guided (B) injections; C, D: Long (C) and short (D) axis views of an US-guided injection into a Morton’s neuroma (denoted by “n”).
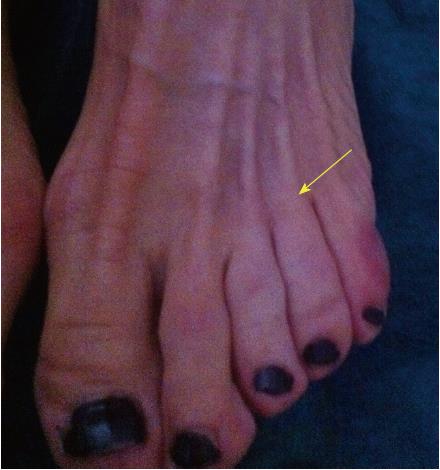
Figure 9 Skin discoloration after steroid injection.
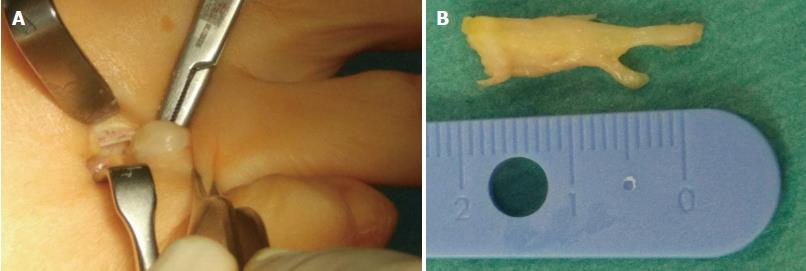
Figure 10 Surgical treatment of Morton’s neuroma.
A: Dorsal approach to Morton’s neuroma; B: Surgical specimen.
- Citation: Santiago FR, Muñoz PT, Pryest P, Martínez AM, Olleta NP. Role of imaging methods in diagnosis and treatment of Morton’s neuroma. World J Radiol 2018; 10(9): 91-99
- URL: https://www.wjgnet.com/1949-8470/full/v10/i9/91.htm
- DOI: https://dx.doi.org/10.4329/wjr.v10.i9.91


