©2009 Baishideng Publishing Group Co.
Figure 1 Suprarenal stent grafts with barbs and hooks on the top of uncovered suprarenal component.
Views from top (A) and lateral (B) aspect of a commercially available Zenith stent graft.
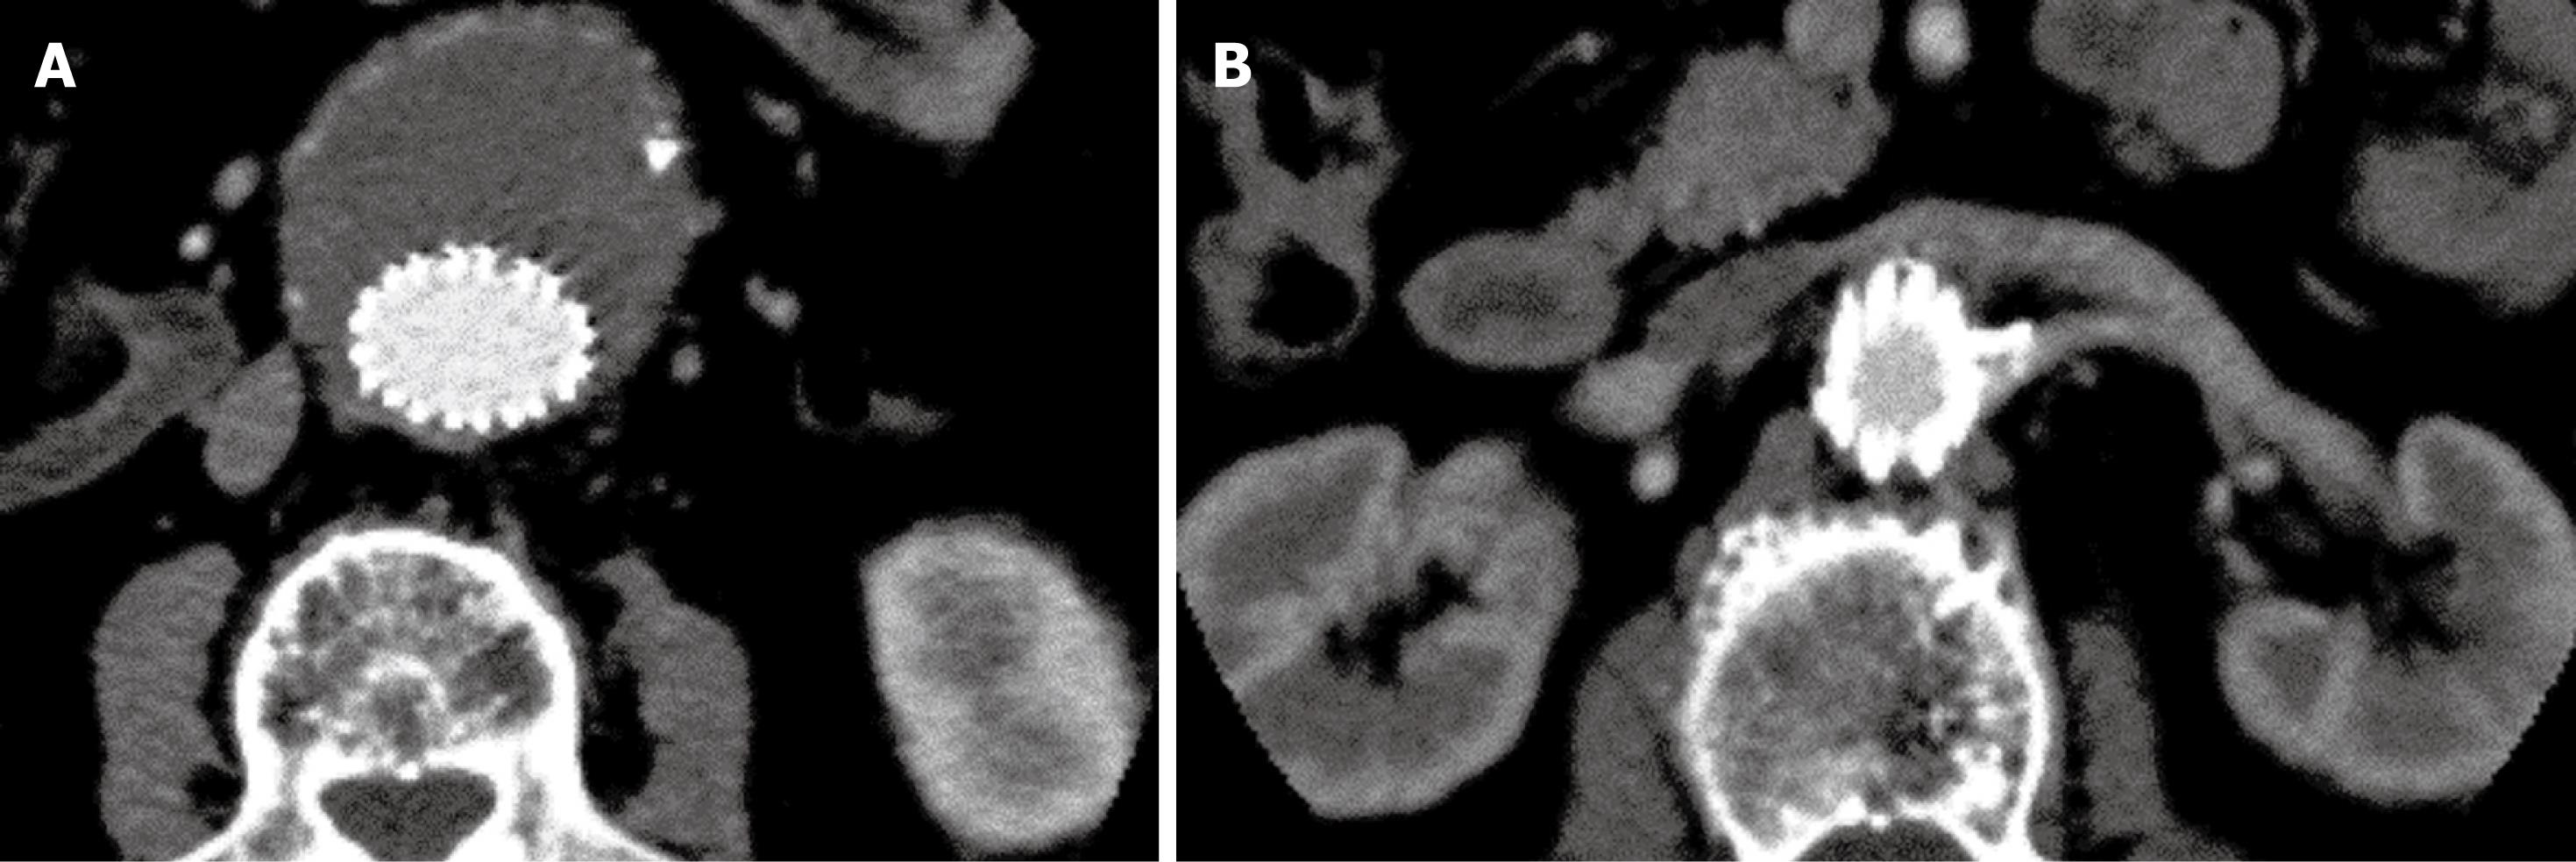
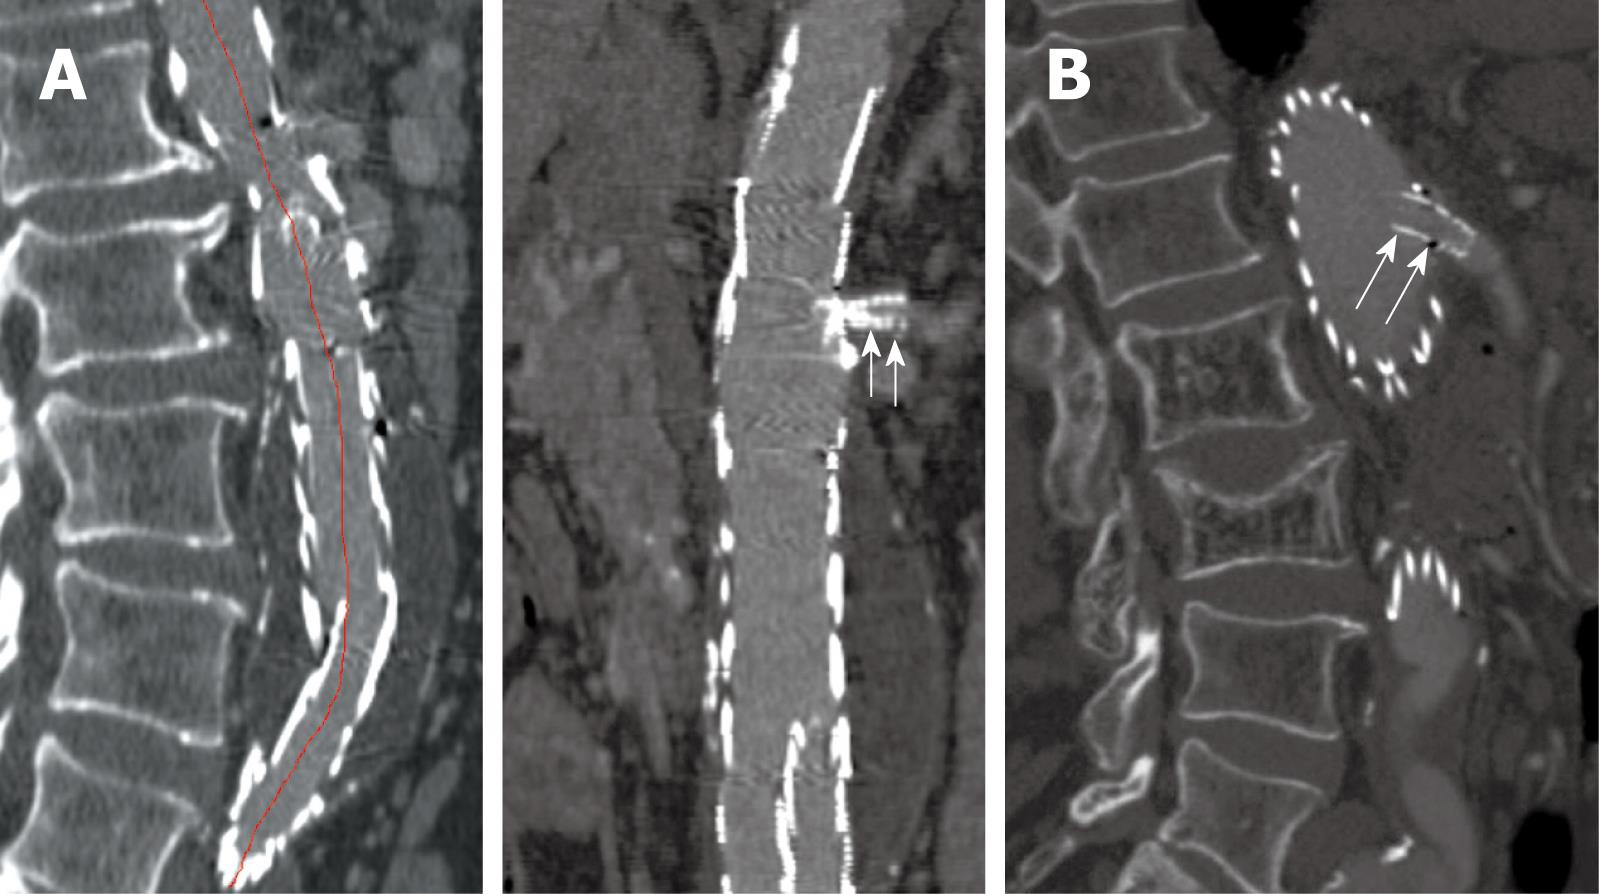
Figure 2 2D axial images in a patient treated with suprarenal stent graft.
The aneurysm was successfully excluded from the systemic circulation (A), and the suprarenal stent struts were placed above the left renal artery (B).
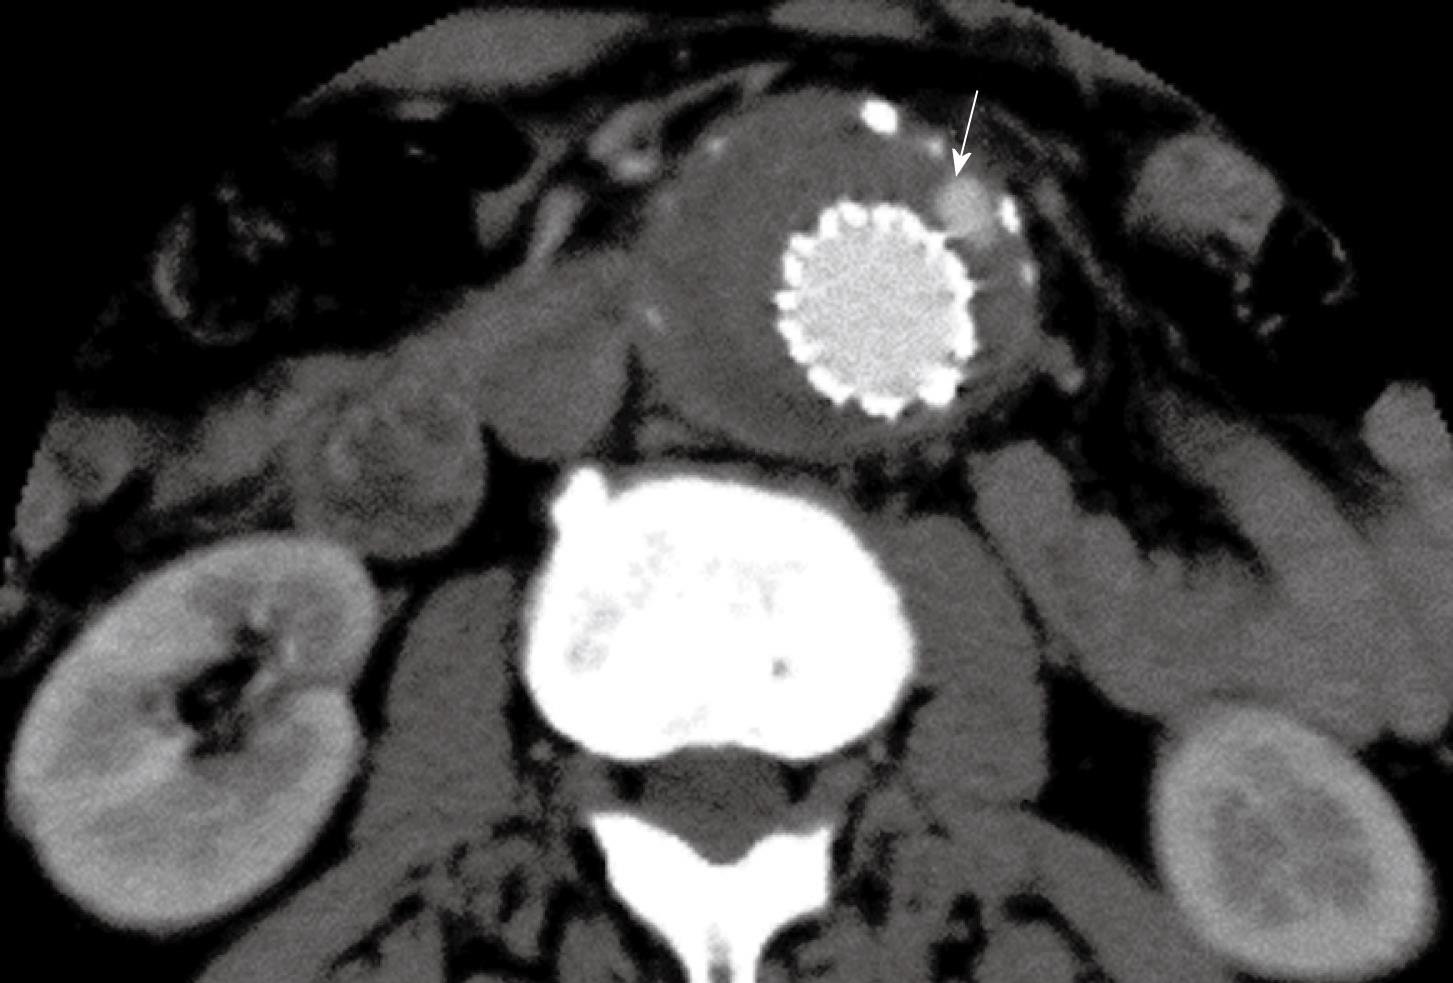
Figure 3 Contrast enhancement was present outside the stent graft but within the aneurysm sac indicating the endoleak (arrow) in a patient with abdominal aortic aneurysm (AAA) following suprarenal fixation of stent graft.
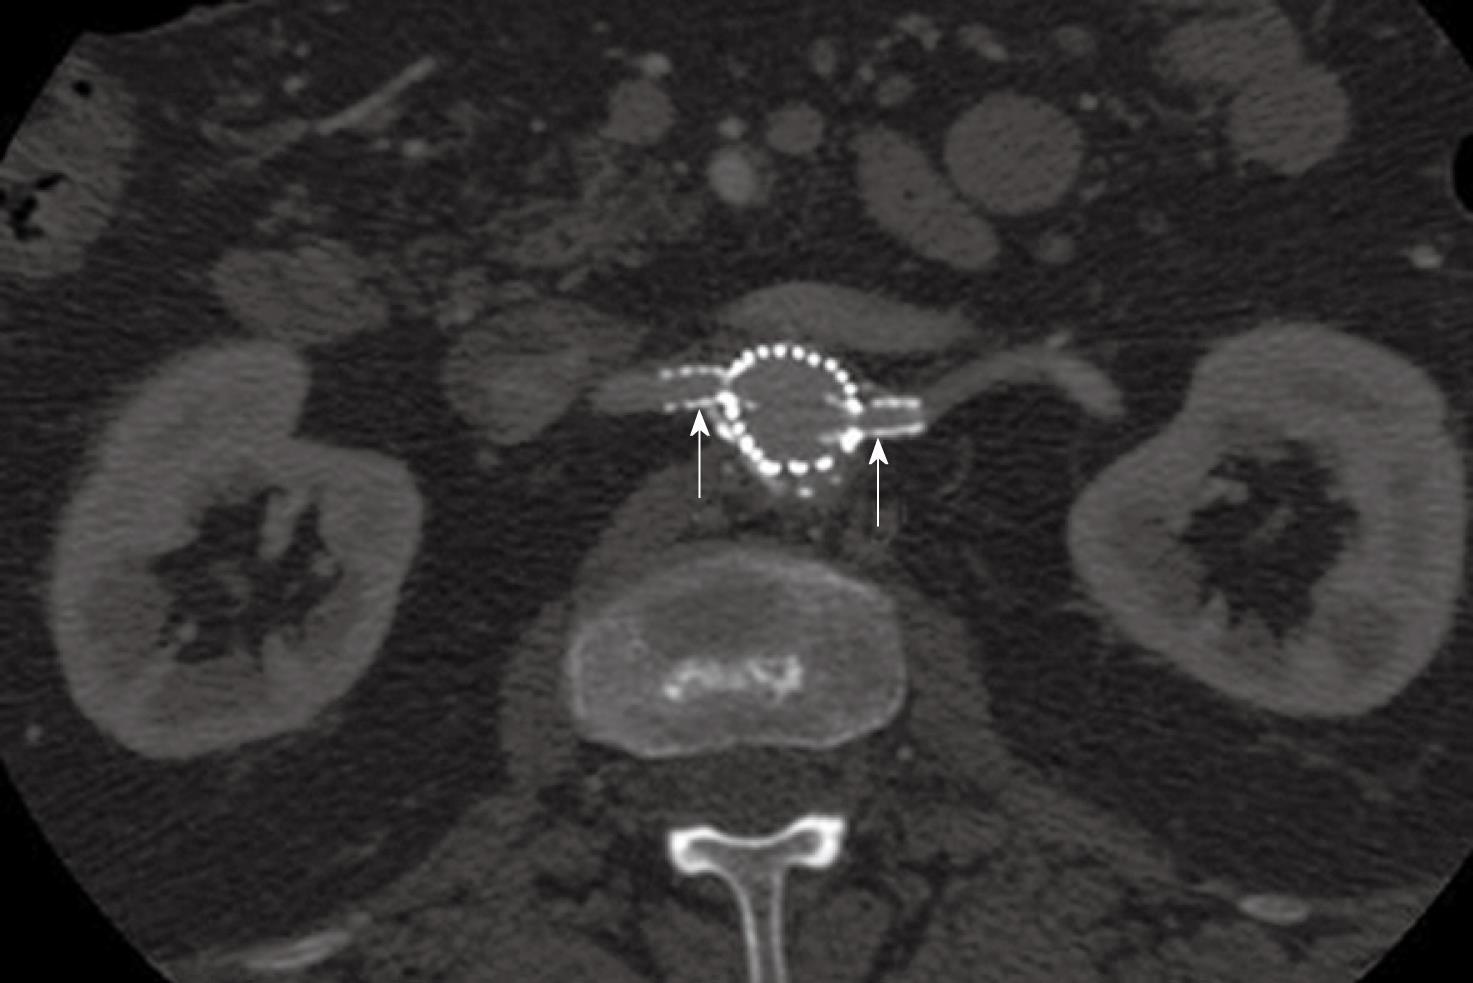
Figure 4 2D axial images show the small fenestrated stents inserted (arrows) into the bilateral renal arteries.
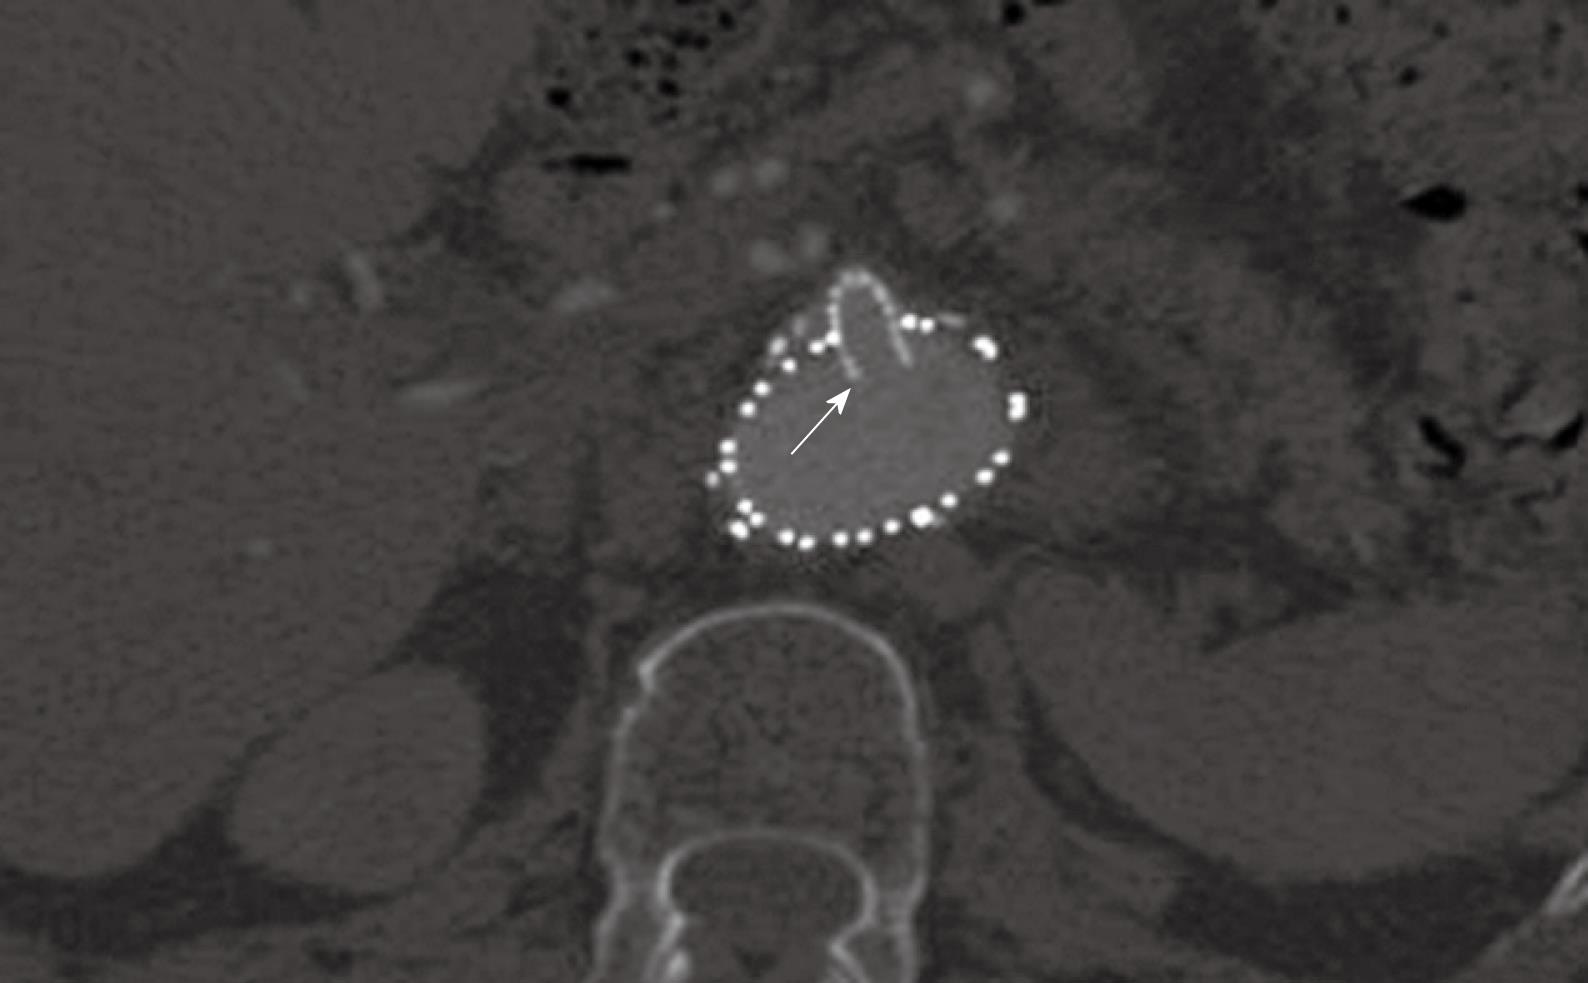
Figure 5 A large fenestrated stent was inserted into the superior mesenteric artery with an intraluminal protrusion (arrow).
Figure 6 Sagittal multiplanar reformatted image shows the stent graft was placed below the celiac axis (short arrows) and SMA (long arrows).
Figure 7 Curved planar reformatted images are produced following the centreline of the abdominal aorta to demonstrate the fenestrated renal stent (arrows in A) and the intra-aortic portion of fenestrated stent deployed into the SMA (arrows in B).
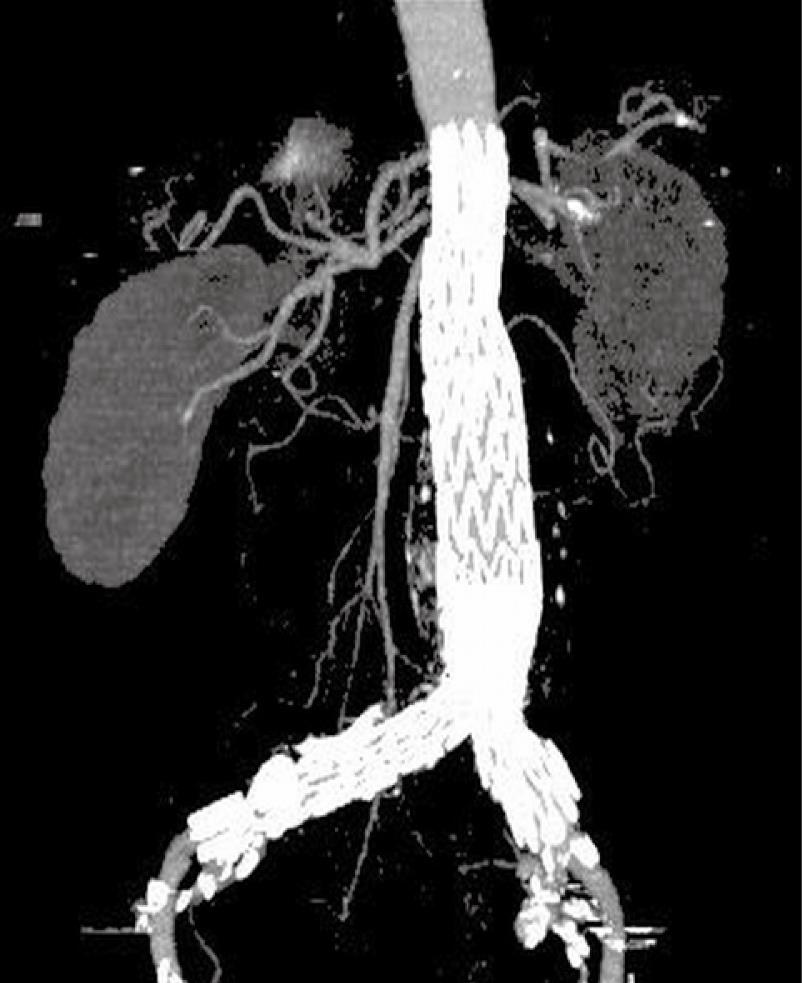
Figure 8 Computed tomography (CT) coronal maximum-intensity projection (MIP) clearly demonstrates the high-density stent wires and contrast-enhanced blood vessels.
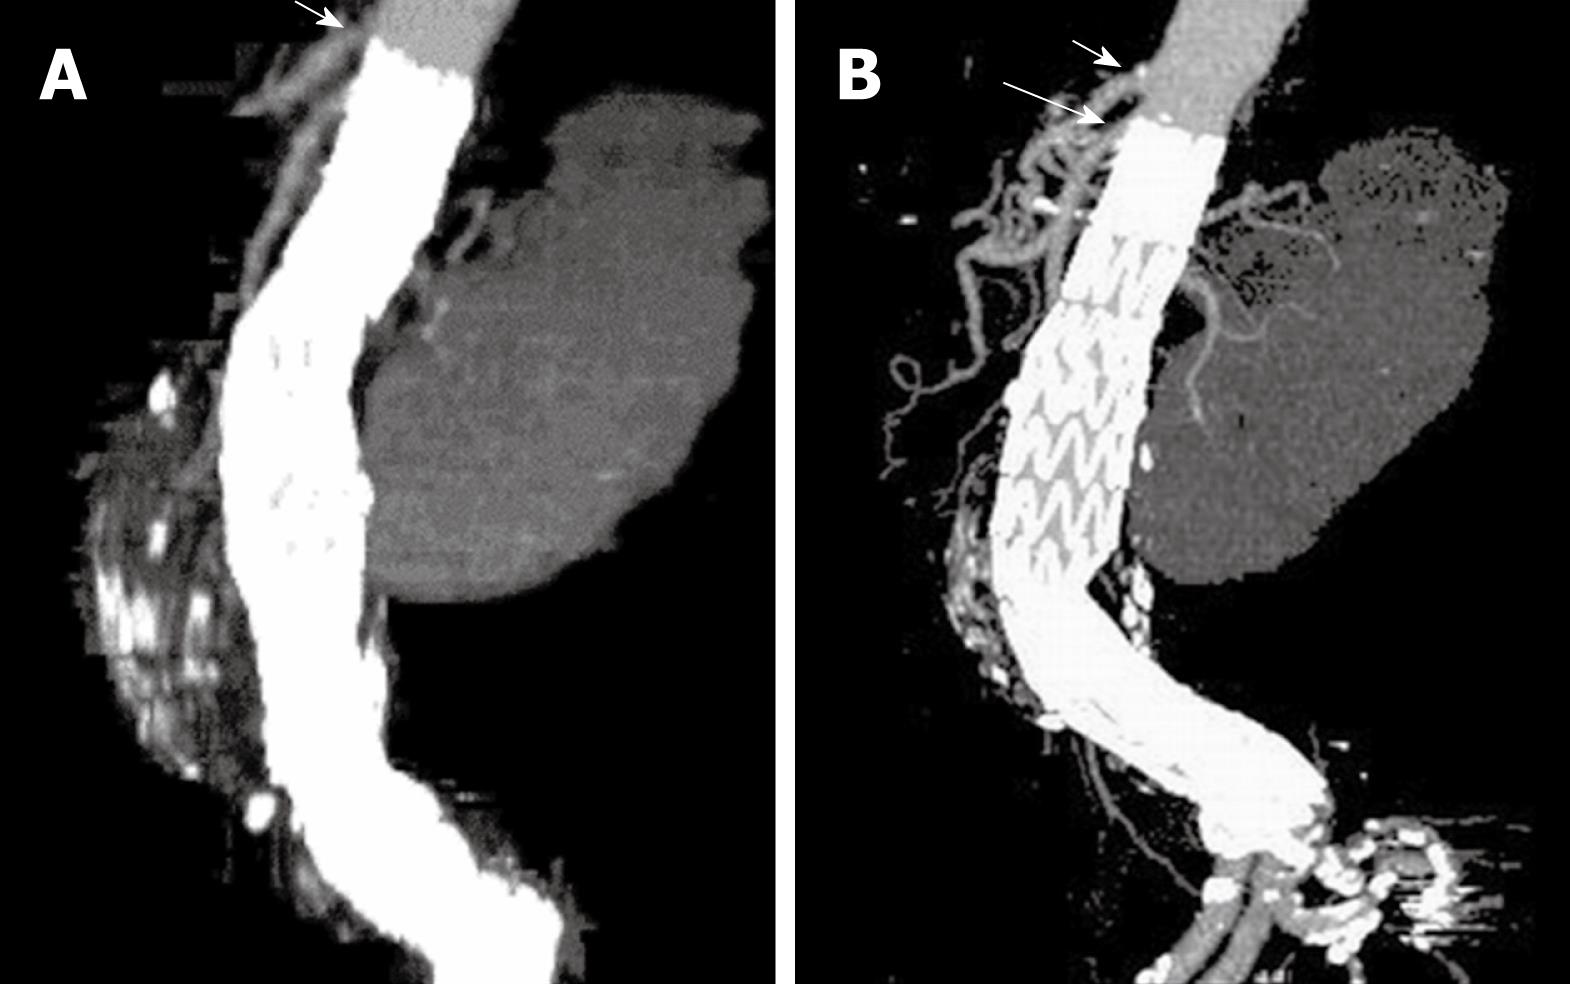
Figure 9 A stent graft migration of 10.
2 mm was noticed in a recent sagittal MIP image (B) in a patient treated with suprarenal stent graft 3 years ago (A). Short arrows indicate celiac axis, while long arrow refer to SMA.
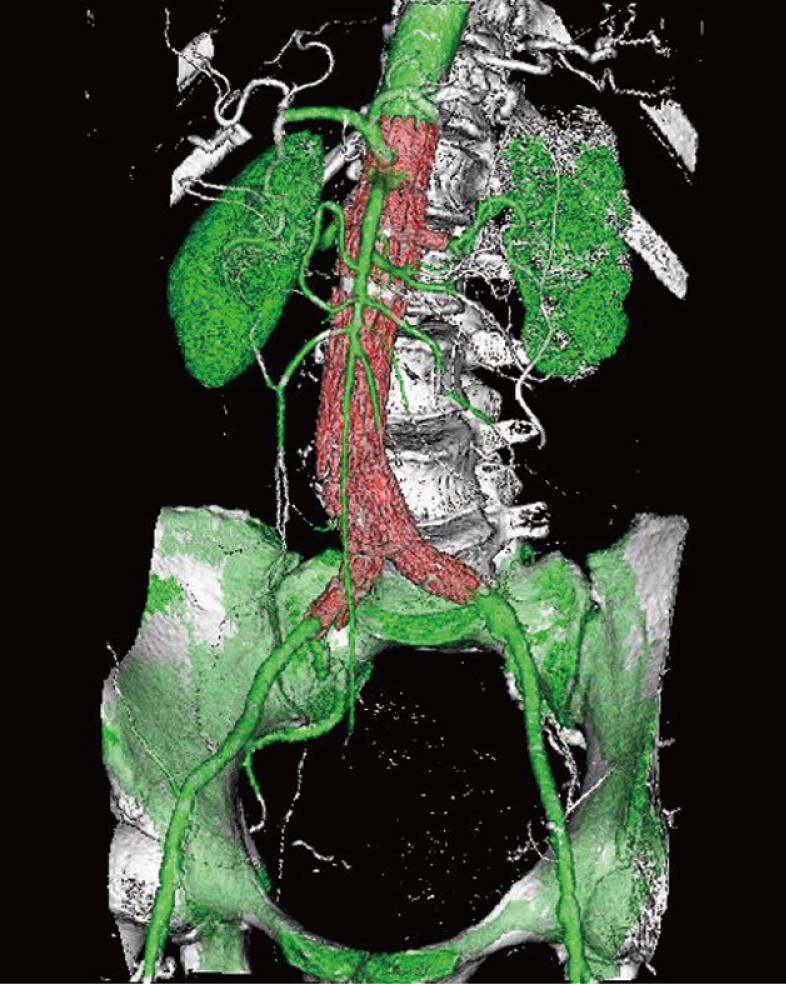
Figure 10 Volume rendering (VR) image demonstrates the 3D relationship between fenestrated renal stents (red color) and aortic branches (green color).
Bones are coded with white color.
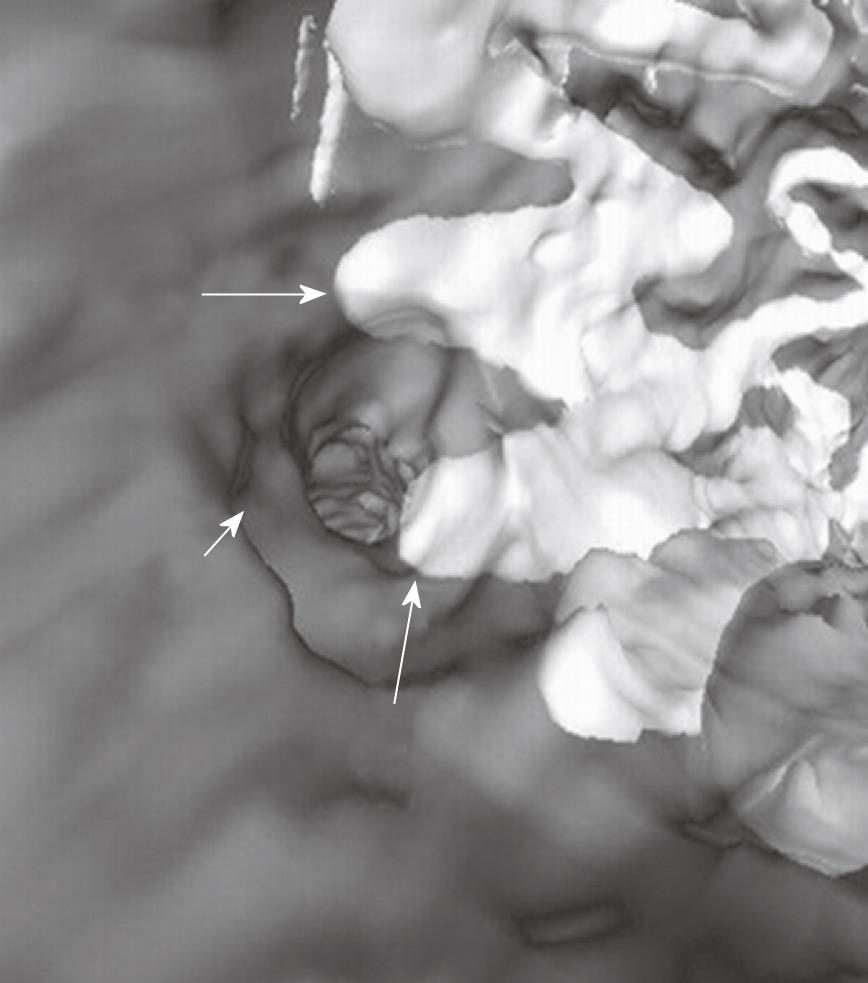
Figure 11 Virtual intravascular endoscopy (VIE) shows the left renal ostium (short arrow) was peripherally crossed by two suprarenal stent struts (long arrows).
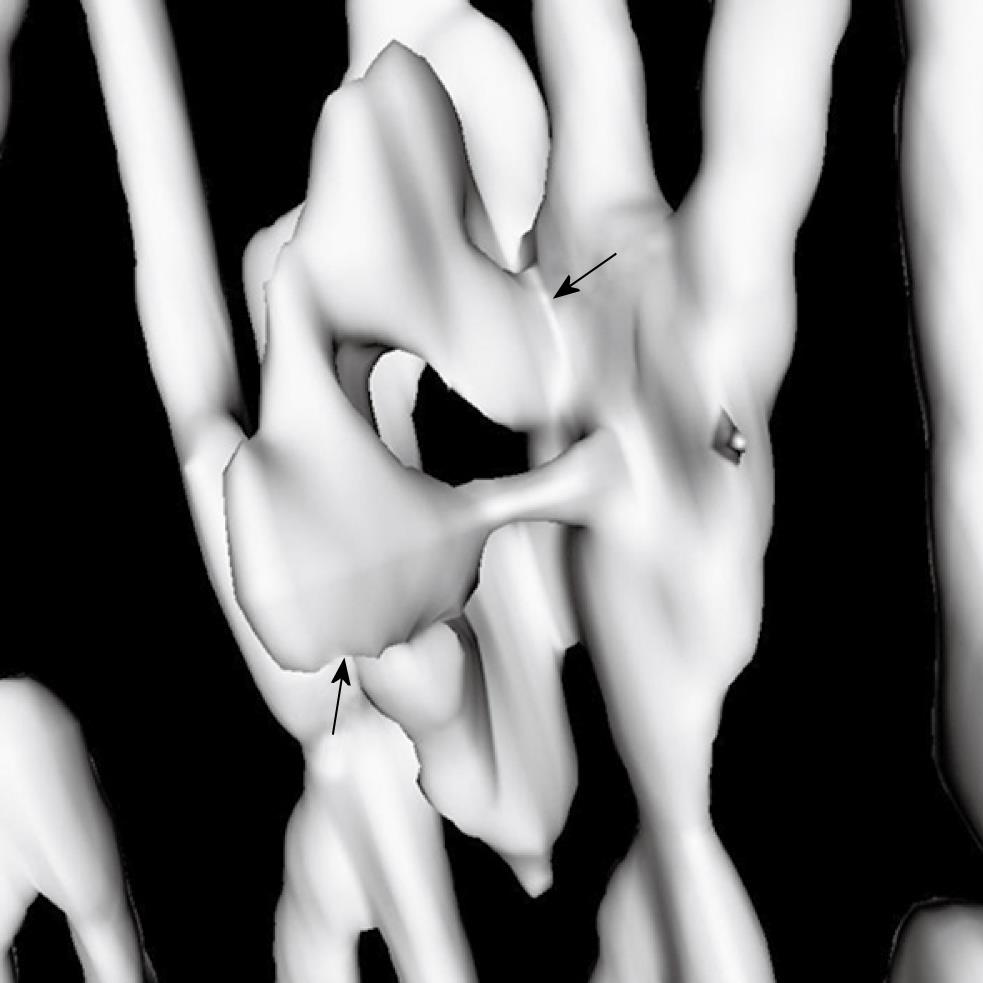
Figure 12 VIE views demonstrate the intraluminal appearance of fenestrated renal stent as circular configuration (A).
In addition, the intraluminal portion of the fenestrated stent can be visualised and measured on VIE (arrows in B).
Figure 13 Deformed fenestrated renal stent with irregular appearance is displayed on VIE image (arrows).
Figure 14 Computational fluid dynamic analysis of the interference of suprarenal stent struts with renal blood flow shows the flow velocity calculated in a realistic aorta model without placement of suprarenal stent struts (A), with simulated stent wire thickness of 0.
4 mm (B), 1.0 mm (C) and 2.0 mm (D). The laminar flow pattern from pre-stent grafting was found to change to turbulent with simulated stent struts across the renal arteries, with flow velocity decreased up to 30% when the wire thickness increased to 2.0 mm.
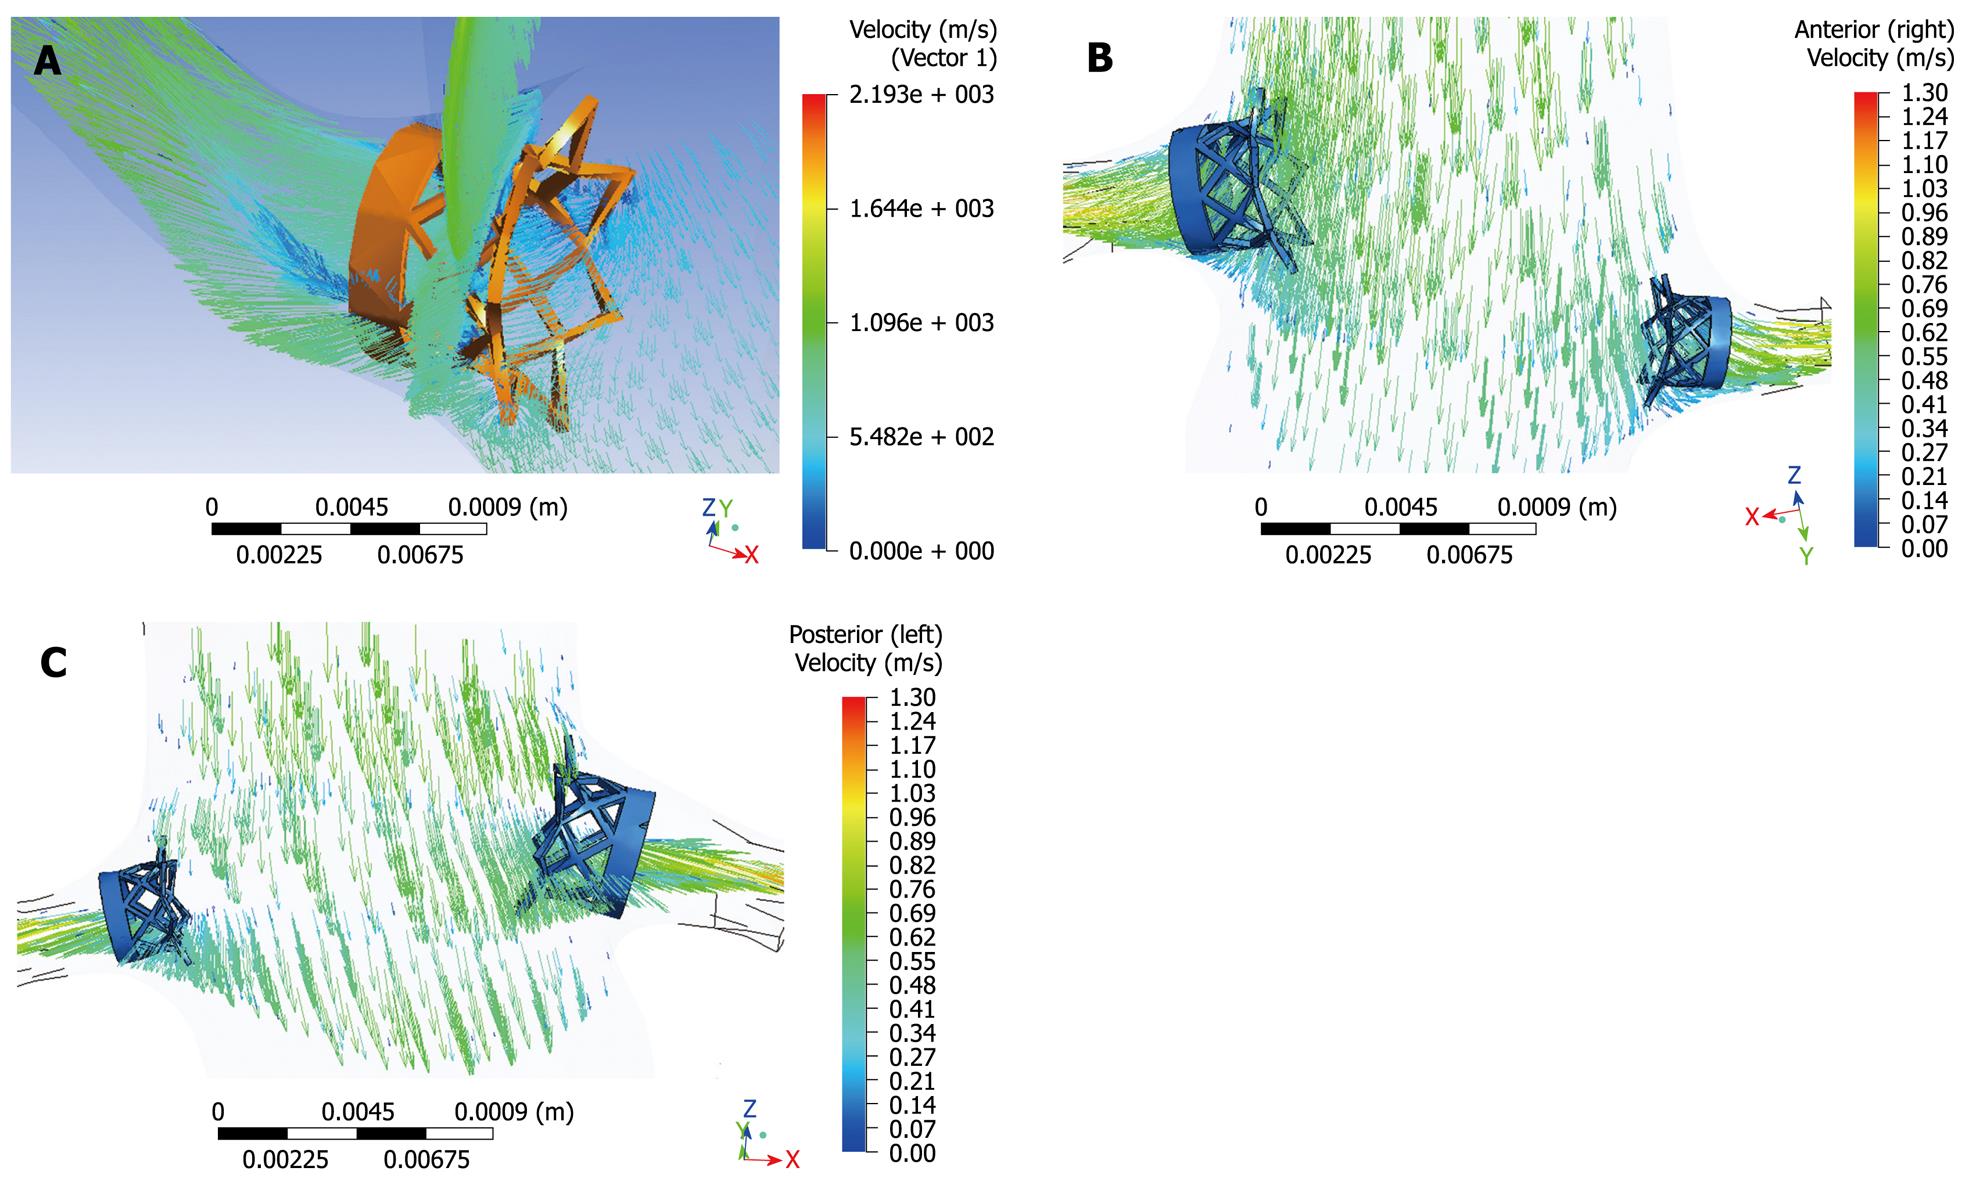
Figure 15 Computational fluid dynamic analysis of the interference of fenestrated renal stent with renal flow was performed with a simulated renal stent inserted into the renal arteries based on an aorta model (A).
Flow velocity was not significantly affected after placement of fenestrated renal stents, although flow recirculation was observed at the proximal portion of the renal arteries (B, C).
- Citation: Sun Z. Endovascular stent graft repair of abdominal aortic aneurysms: Current status and future directions. World J Radiol 2009; 1(1): 63-71
- URL: https://www.wjgnet.com/1949-8470/full/v1/i1/63.htm
- DOI: https://dx.doi.org/10.4329/wjr.v1.i1.63


