©2009 Baishideng Publishing Group Co.
Figure 1 3T magnetic resonance (MR) images of extracapsular extension (ECE) of prostate cancer in a 65-year-old man with clinical stage T1c prostate nodule and prostate specific antigen (PSA) level of 10.
7 ng/mL and Gleason grade 4+4 and PT3a. Transverse 3 mm-thick MR (6500/175) image (A), sagittal 3 mm-thick MR (7000/165) image (B) and coronal 3 mm-thick MR (7000/170) image (C) show a hypointense tumor (arrows) with extraprostatic extension in the right apex and mid of the prostate; D: Whole-mount serial section of the removed prostate shows tumor and ECE involving the right apex and mid of the prostate.
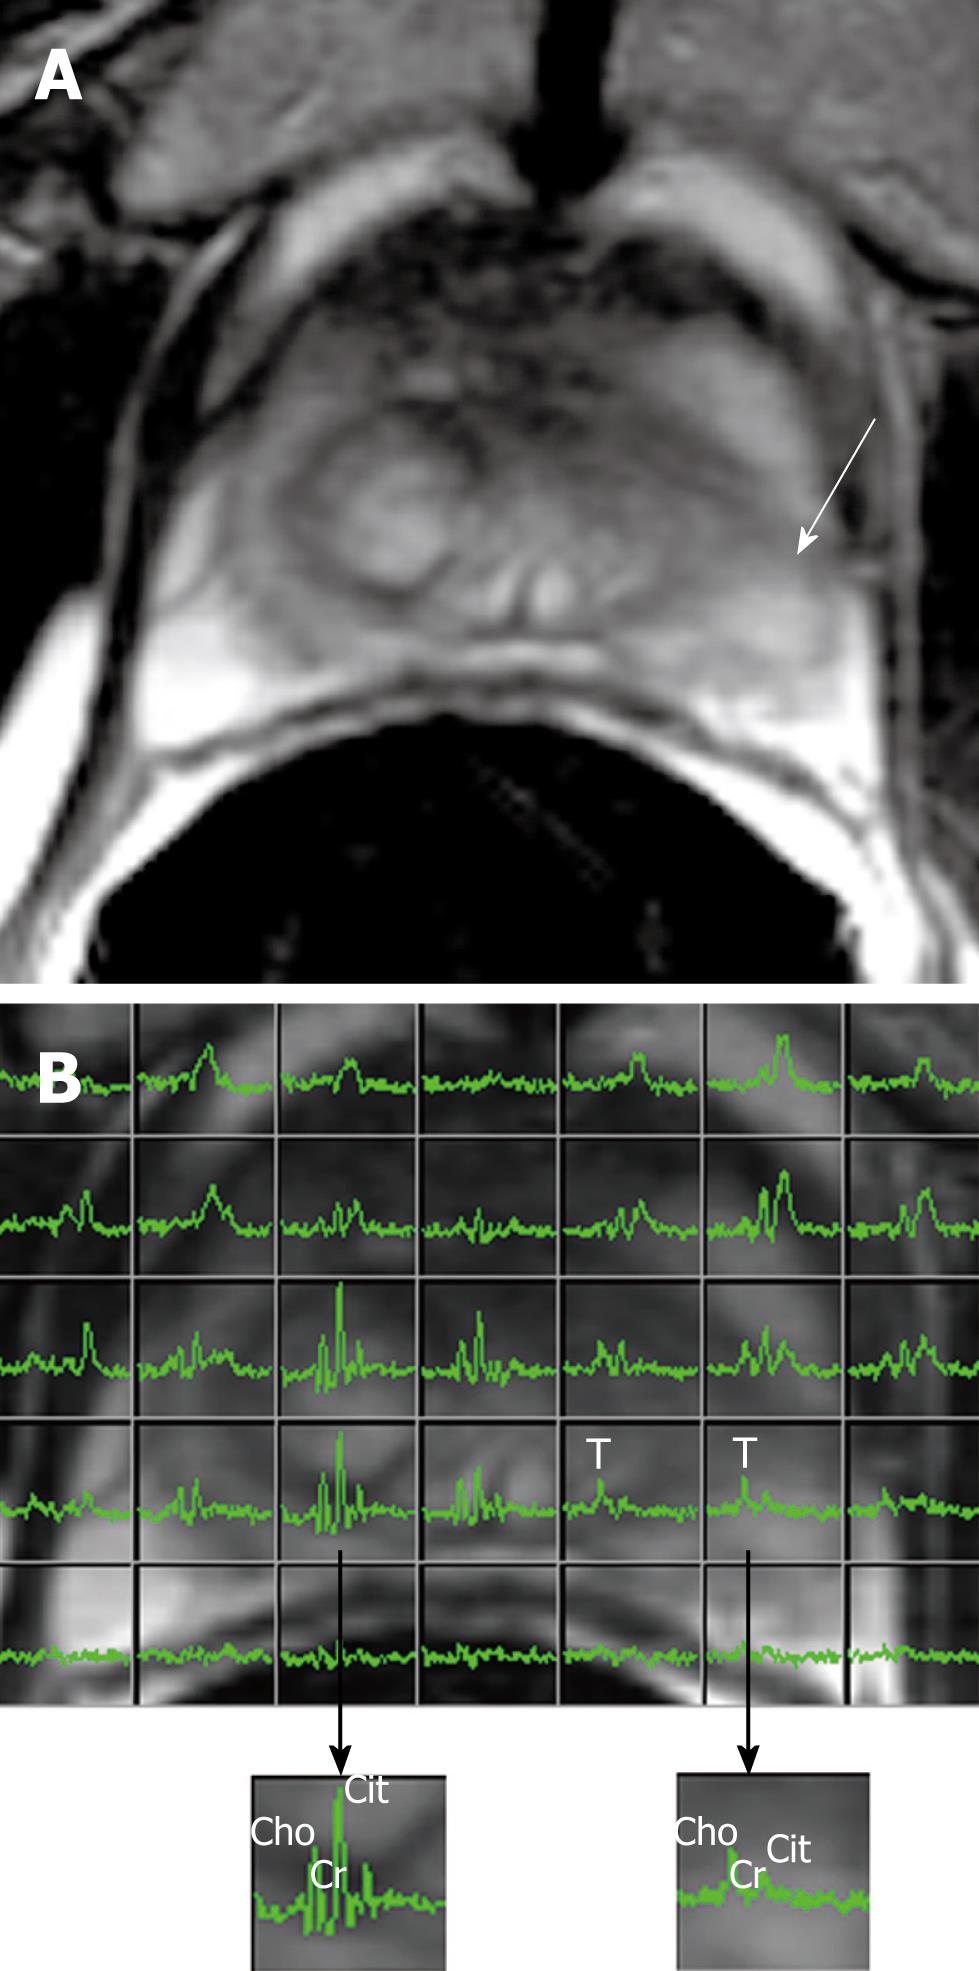
Figure 2 Prostate cancer in a 65-year-old patient with PSA level of 4.
76 ng/mL. Transverse T2-weighted MR image (WI) (A) and corresponding MR spectroscopic imaging (MRSI) grid (B) superimposed on the anatomic image show the tumor (arrow) on the left apex. MRSI demonstrates reduced citrate and elevated choline in the left peripheral zone tumor (T) and normal spectra in the healthy right peripheral area. Cho: Choline; Cr: Creatine; Cit: Citrate.
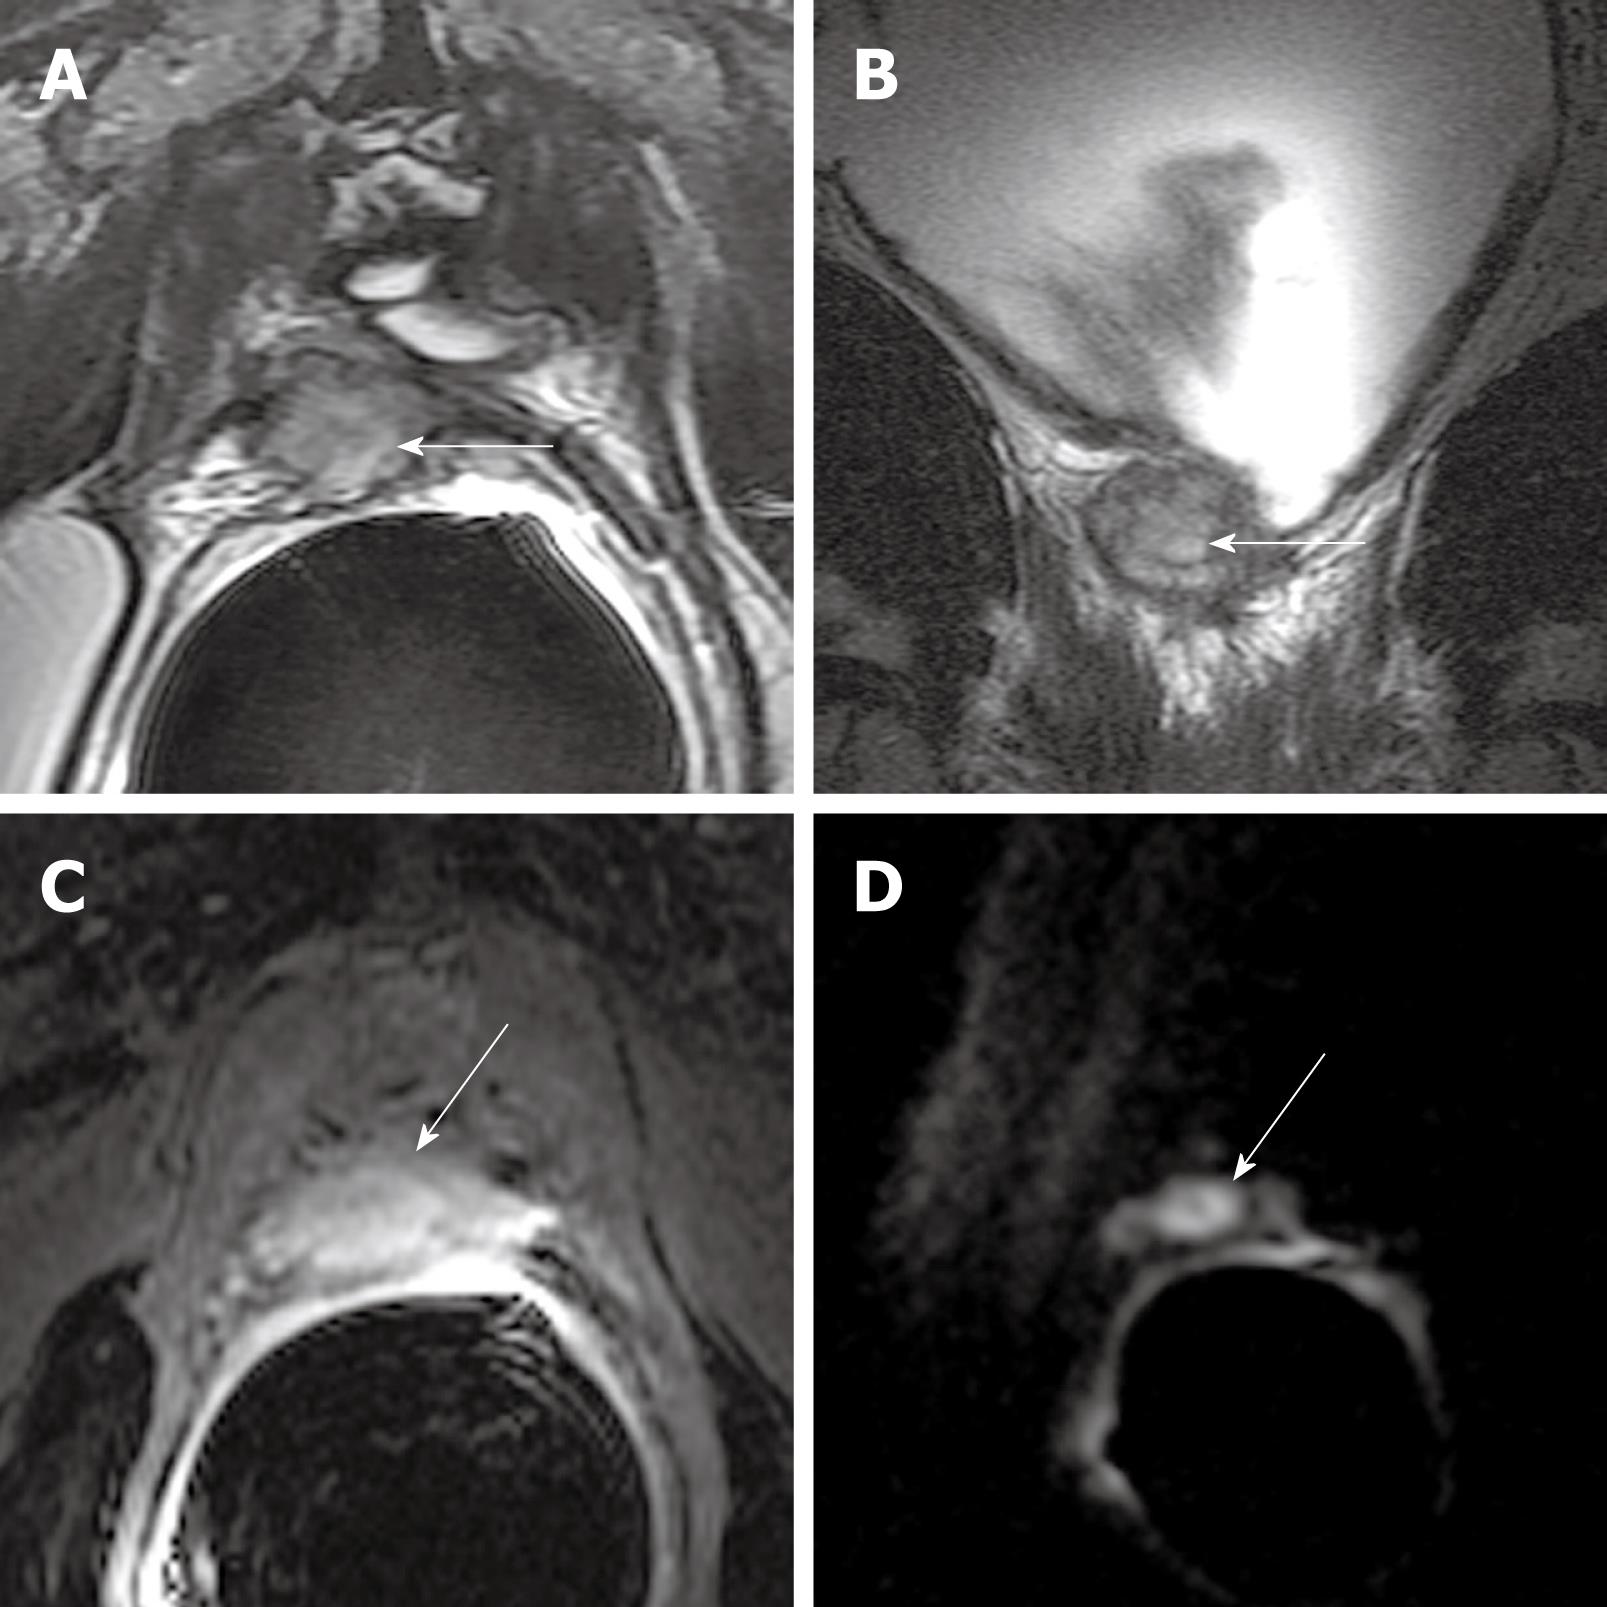
Figure 3 1.
5T MR images of locally recurrent prostate cancer in a 63-year-old man with rising PSA levels after radical prostatectomy. Transverse 3 mm-thick T2-WI (4000/125) (A) and coronal 3 mm-thick T2-WI (5300/100) (B) show intermediate SI mass (arrows) to the right posterior aspect of the bladder neck at the anastomosis; C: Transverse 3 mm-thick T1-WI (5.5/2.4) shows significant enhancement of the mass (arrow) after intravenous administration of gadolinium; D: Transverse 3 mm-thick diffusion-weighted image (DWI) (3500/93, b-value of 1000 s/mm2) shows intense increased signal (restricted diffusion) throughout the mass (arrow).
Figure 4 MR depiction of malignant adenopathy from prostate cancer in a 63-year-old man with Gleason score 4 + 5 and PSA level of 24 ng/mL.
Transverse 5 mm-thick T1-WI (600/8) (A) and transverse 3 mm-thick T2-WI (5450/118) (B) show intermediate SI bulky adenopathy (arrows) with short-axis dimensions of > 10 mm is present in left external iliac and obturator distributions; C: Transverse 3 mm-thick DWI (3500/98, b-value of 1000 s/mm2) show intense, increased signal (restricted diffusion) throughout the mass (arrow).
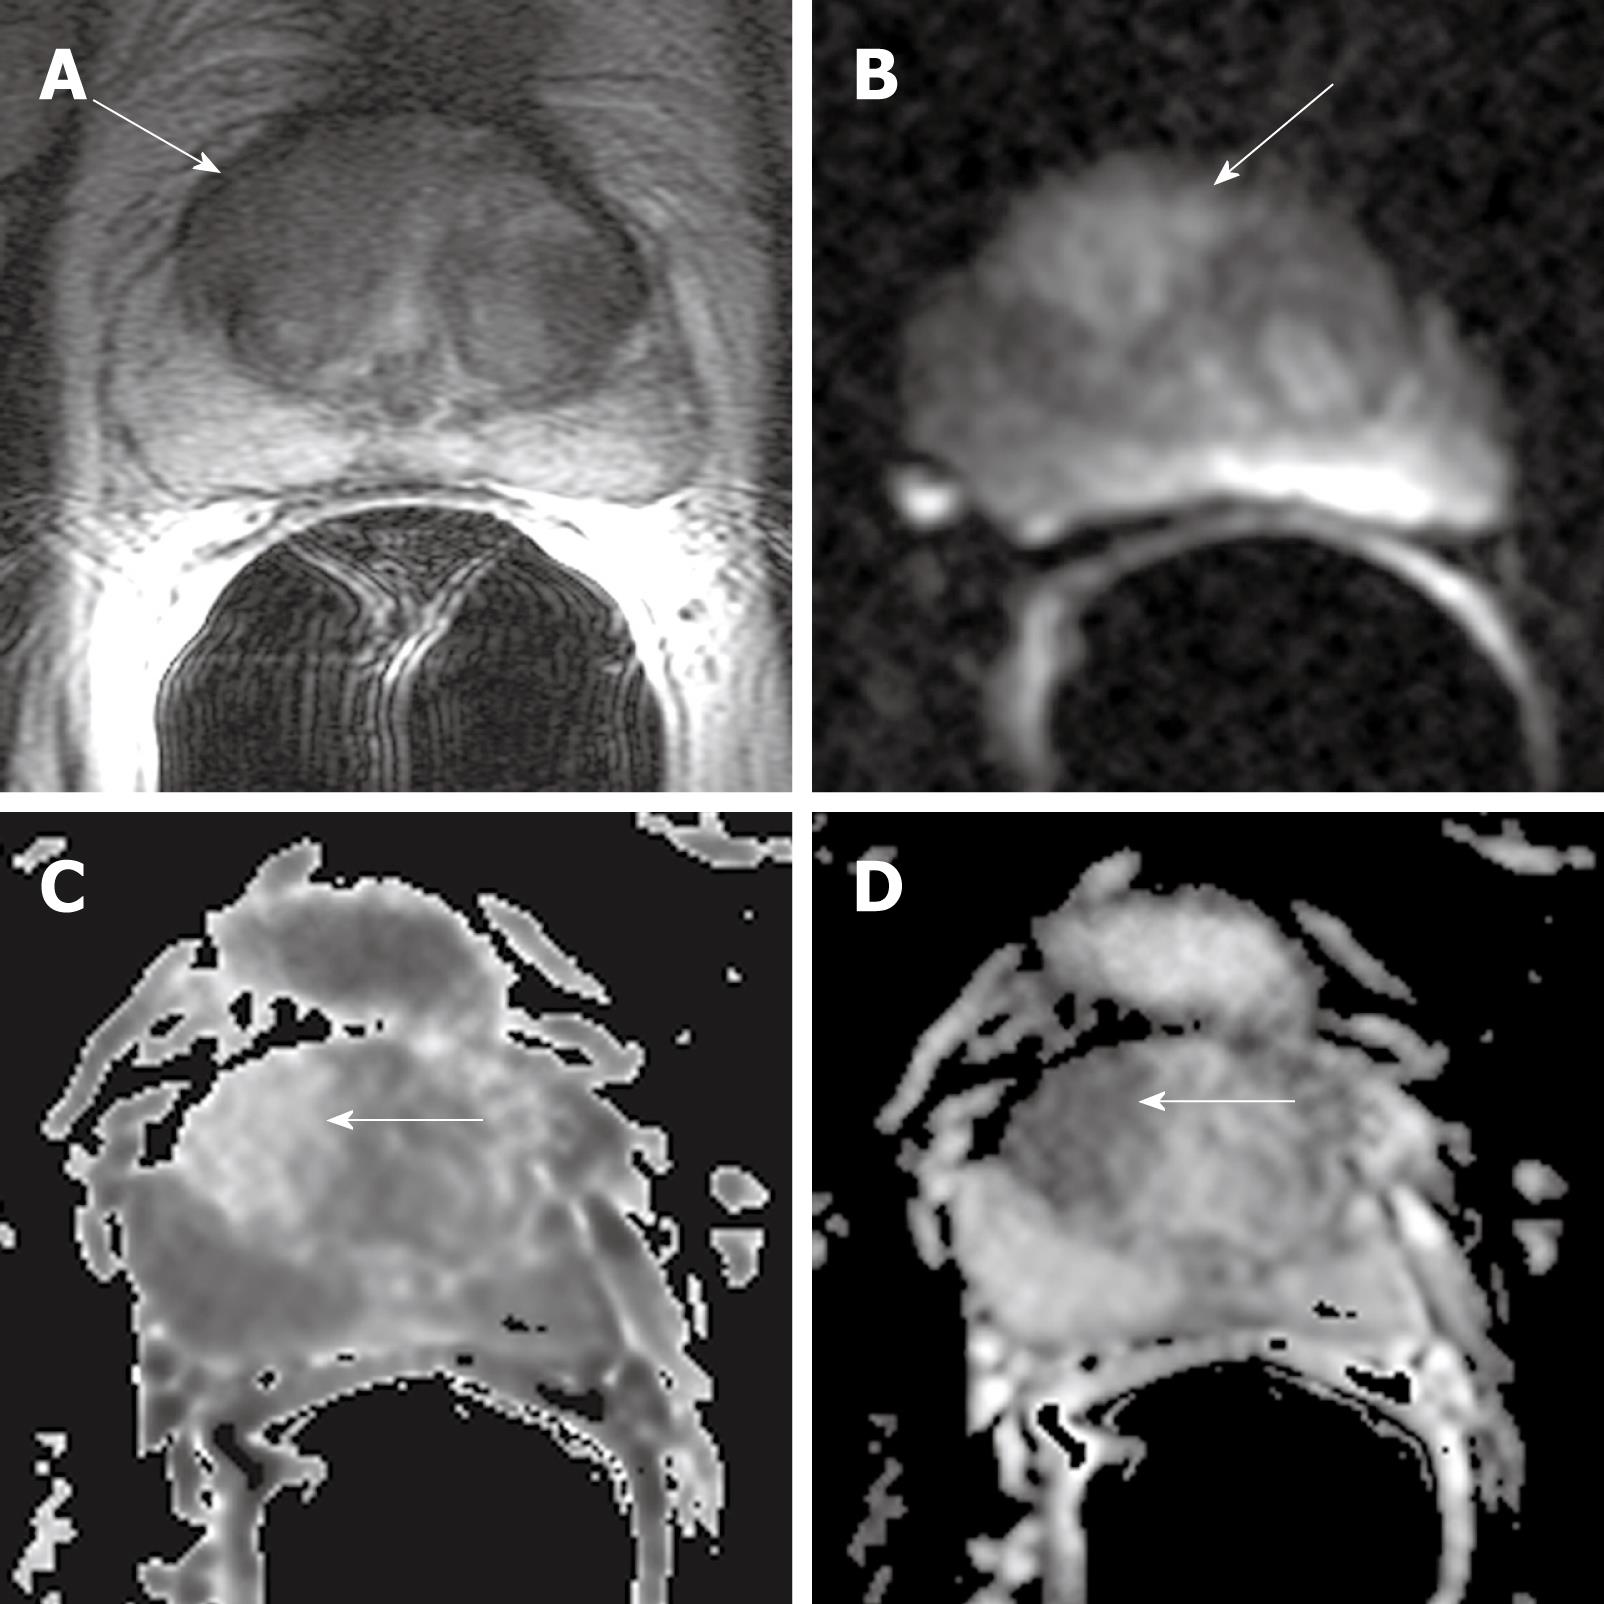
Figure 5 3T MR images of transitional zone tumor in a 59-year-old man with PSA level of 7.
6 ng/mL and Gleason grade 3 + 4 and PT4. Transverse T2-WI (A) and transverse diffusion image (B) (b-value of 1000 s/mm2), exponential apparent diffusion coefficient (ADC) (C) and ADC obtained (D) show an infiltrating tumor (arrows) in the right transitional zone extending from base to mid-gland with anterior extraprostatic extension.
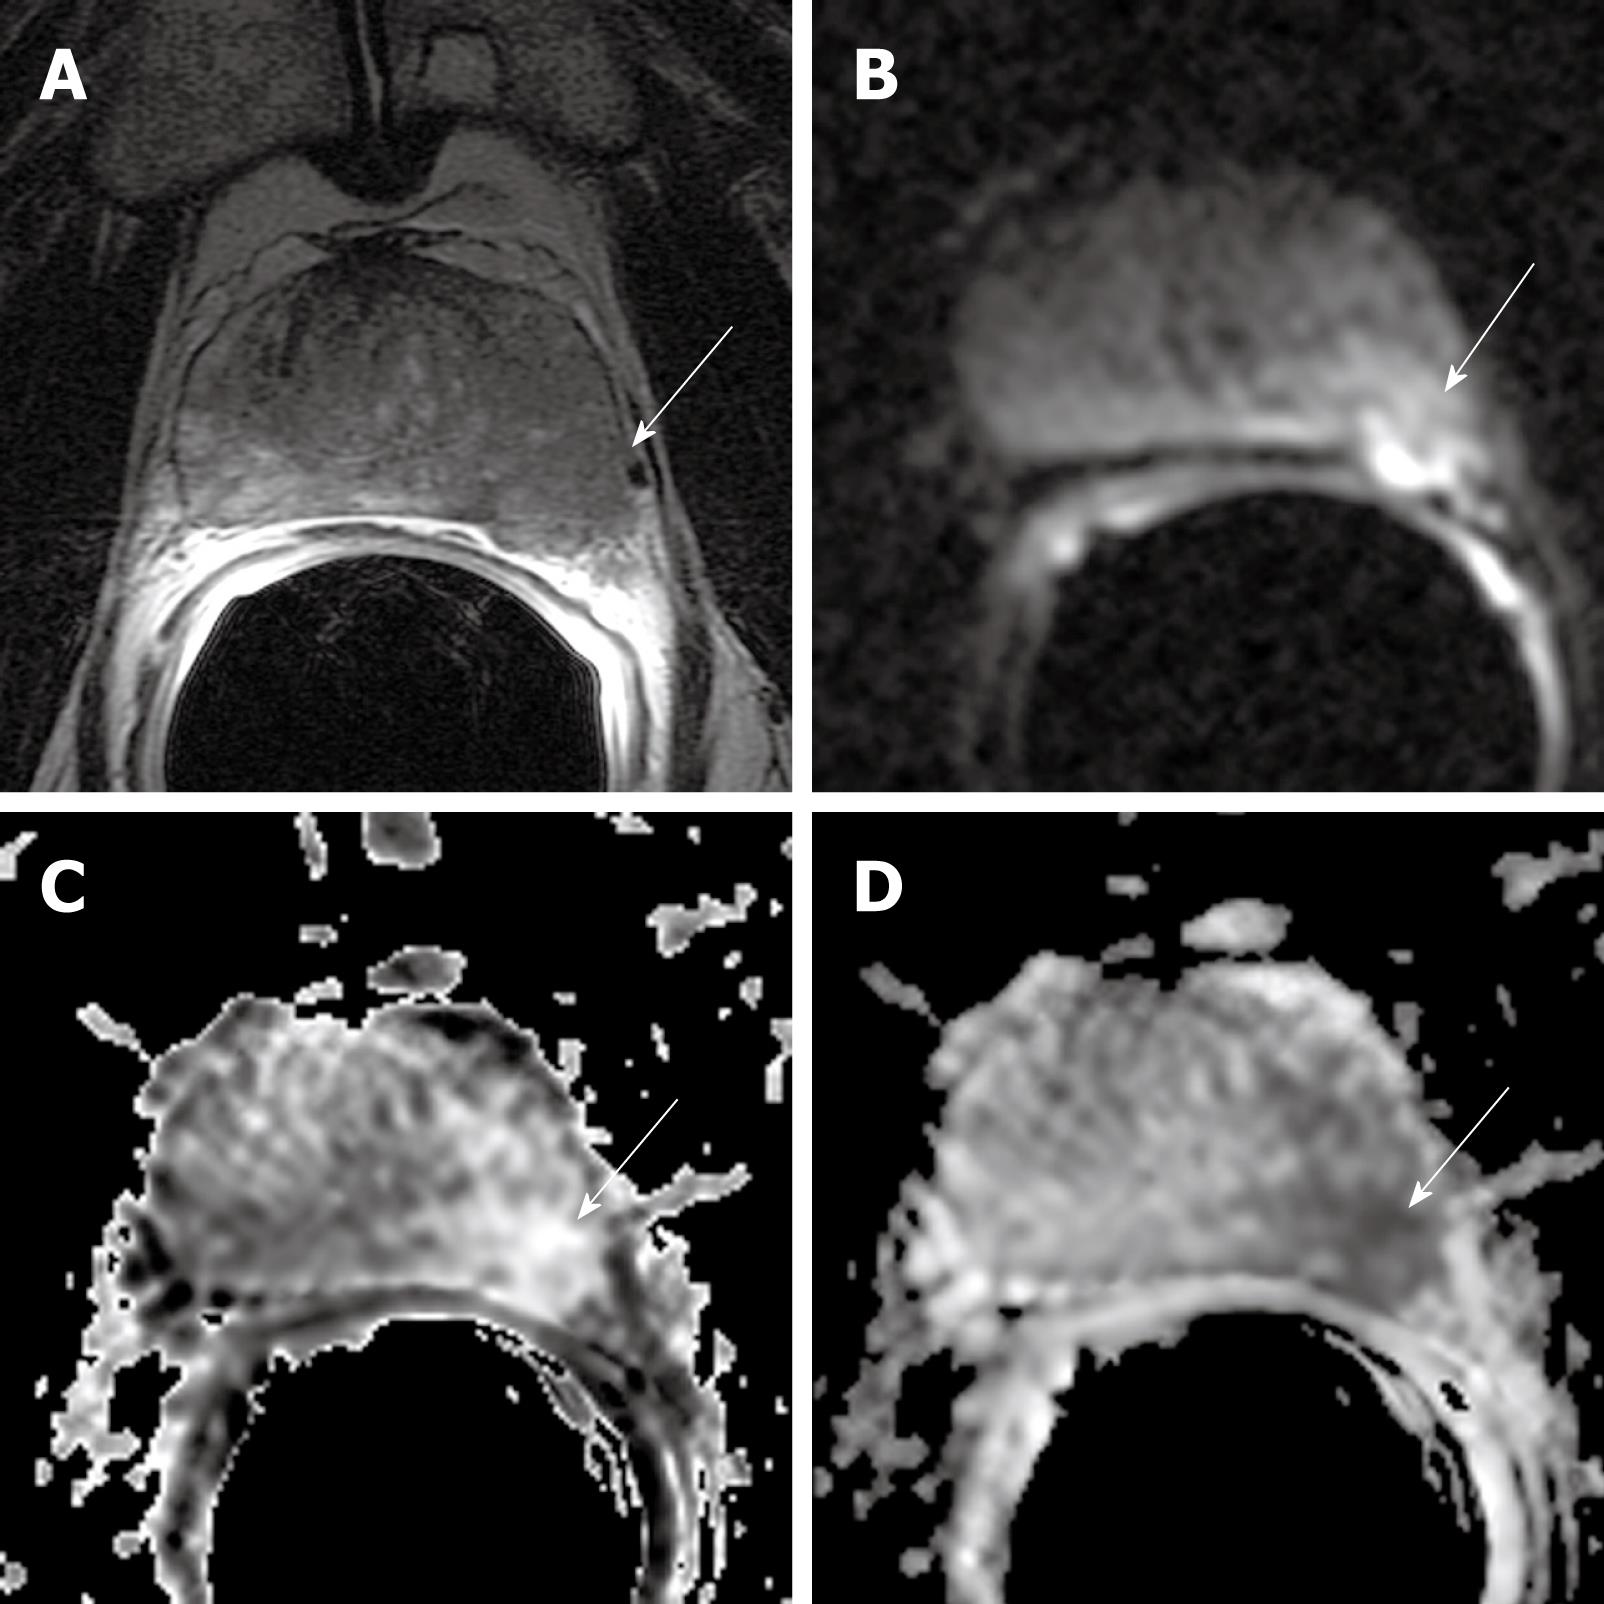
Figure 6 MR images of established ECE of prostate cancer into the periprostatic fat in a 59-year-old man with PSA level of 21.
7 ng/mL and Gleason grade 4 + 4 and PT3a. Transverse 3 mm-thick MR (5800/108) image (A) and transverse diffusion image (4000/85. b1000) (B), exponential ADC (C) and ADC (D) of the prostate mid-gland reveal an infiltrative peripheral zone tumor (arrows) that extends into the left periprostatic fat.
- Citation: Wang L. Incremental value of magnetic resonance imaging in the advanced management of prostate cancer. World J Radiol 2009; 1(1): 3-14
- URL: https://www.wjgnet.com/1949-8470/full/v1/i1/3.htm
- DOI: https://dx.doi.org/10.4329/wjr.v1.i1.3


