
















Copyright: ©Author(s) 2026.
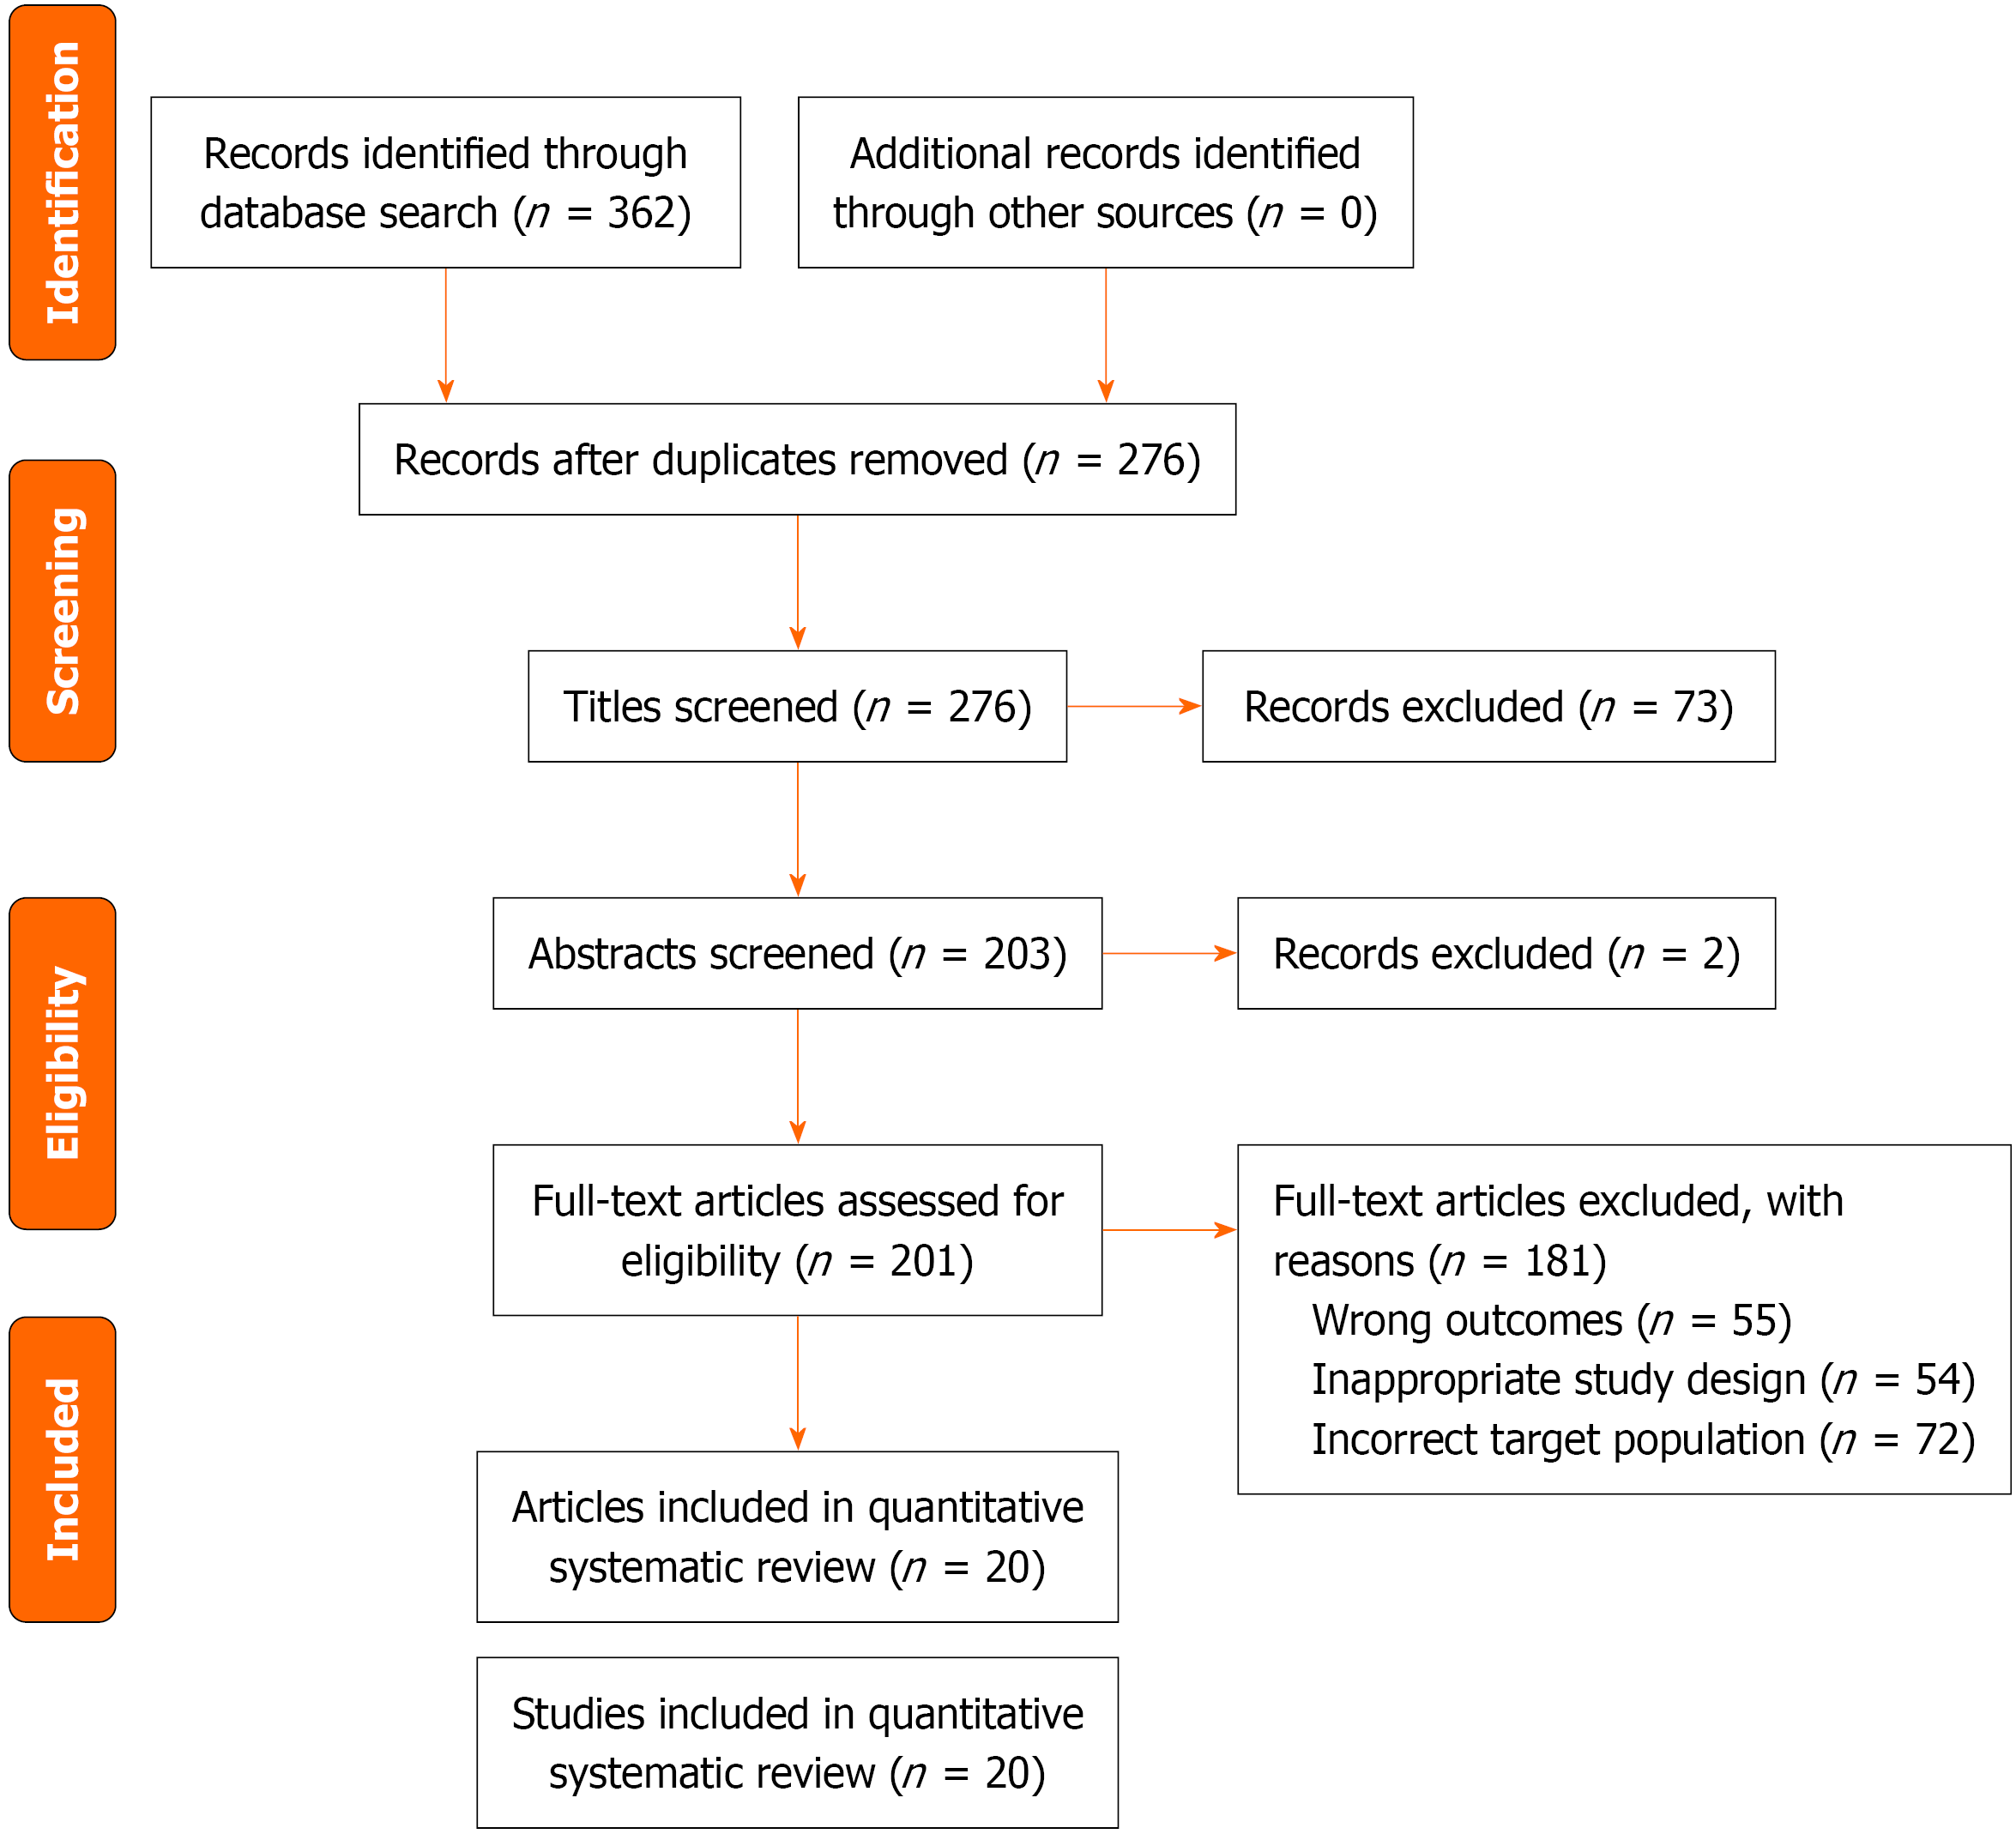
Figure 1 PRISMA 2009 flow diagram illustrating the literature search and study selection process.
Records were identified from PubMed (n = 176), Cochrane (n = 128), and EMBASE (n = 58). After removal of duplicates and ineligible records, 20 studies comprising 15515 patients were included in the final systematic review and meta-analysis.
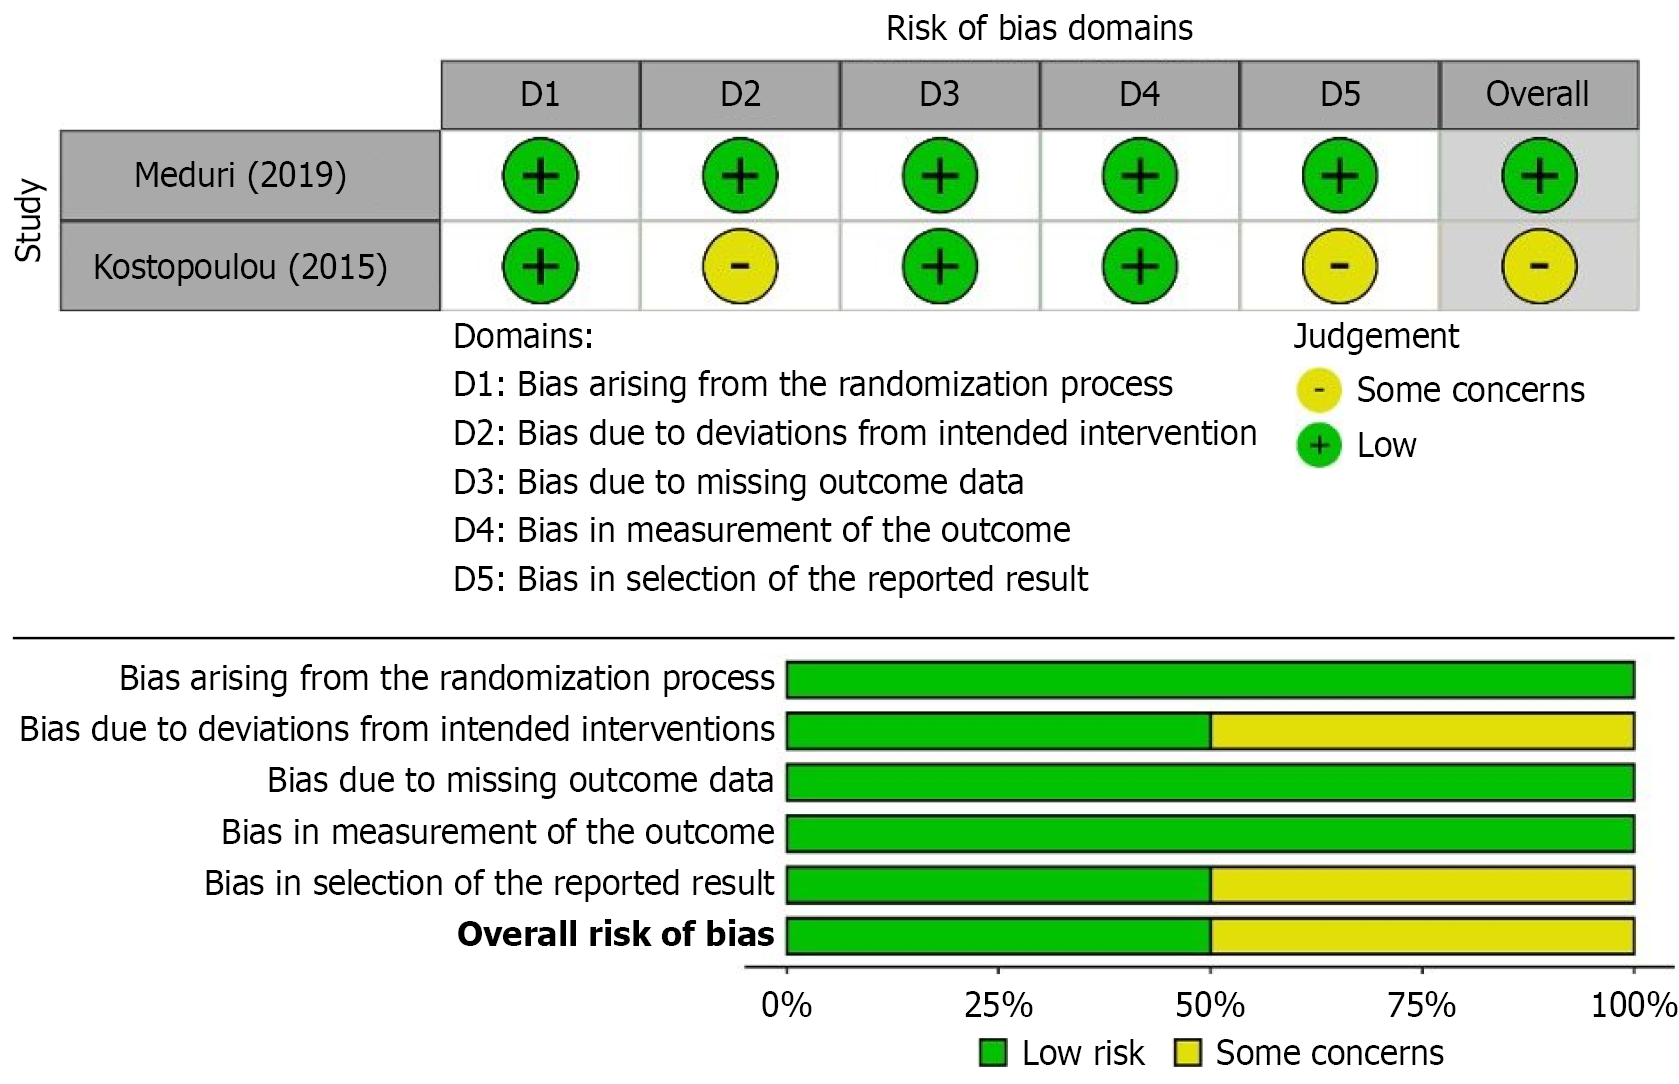
Figure 2 Risk of bias assessment.
Upper panel: Traffic lights plot depicting domain-level risk of bias for the two randomized controlled trials assessed using the Cochrane ROB2 tool. Lower panel: Summary plot depicting the distribution of ROB2 domain judgements across the same two randomized controlled trials. Green: Low risk; Yellow: Some concerns.
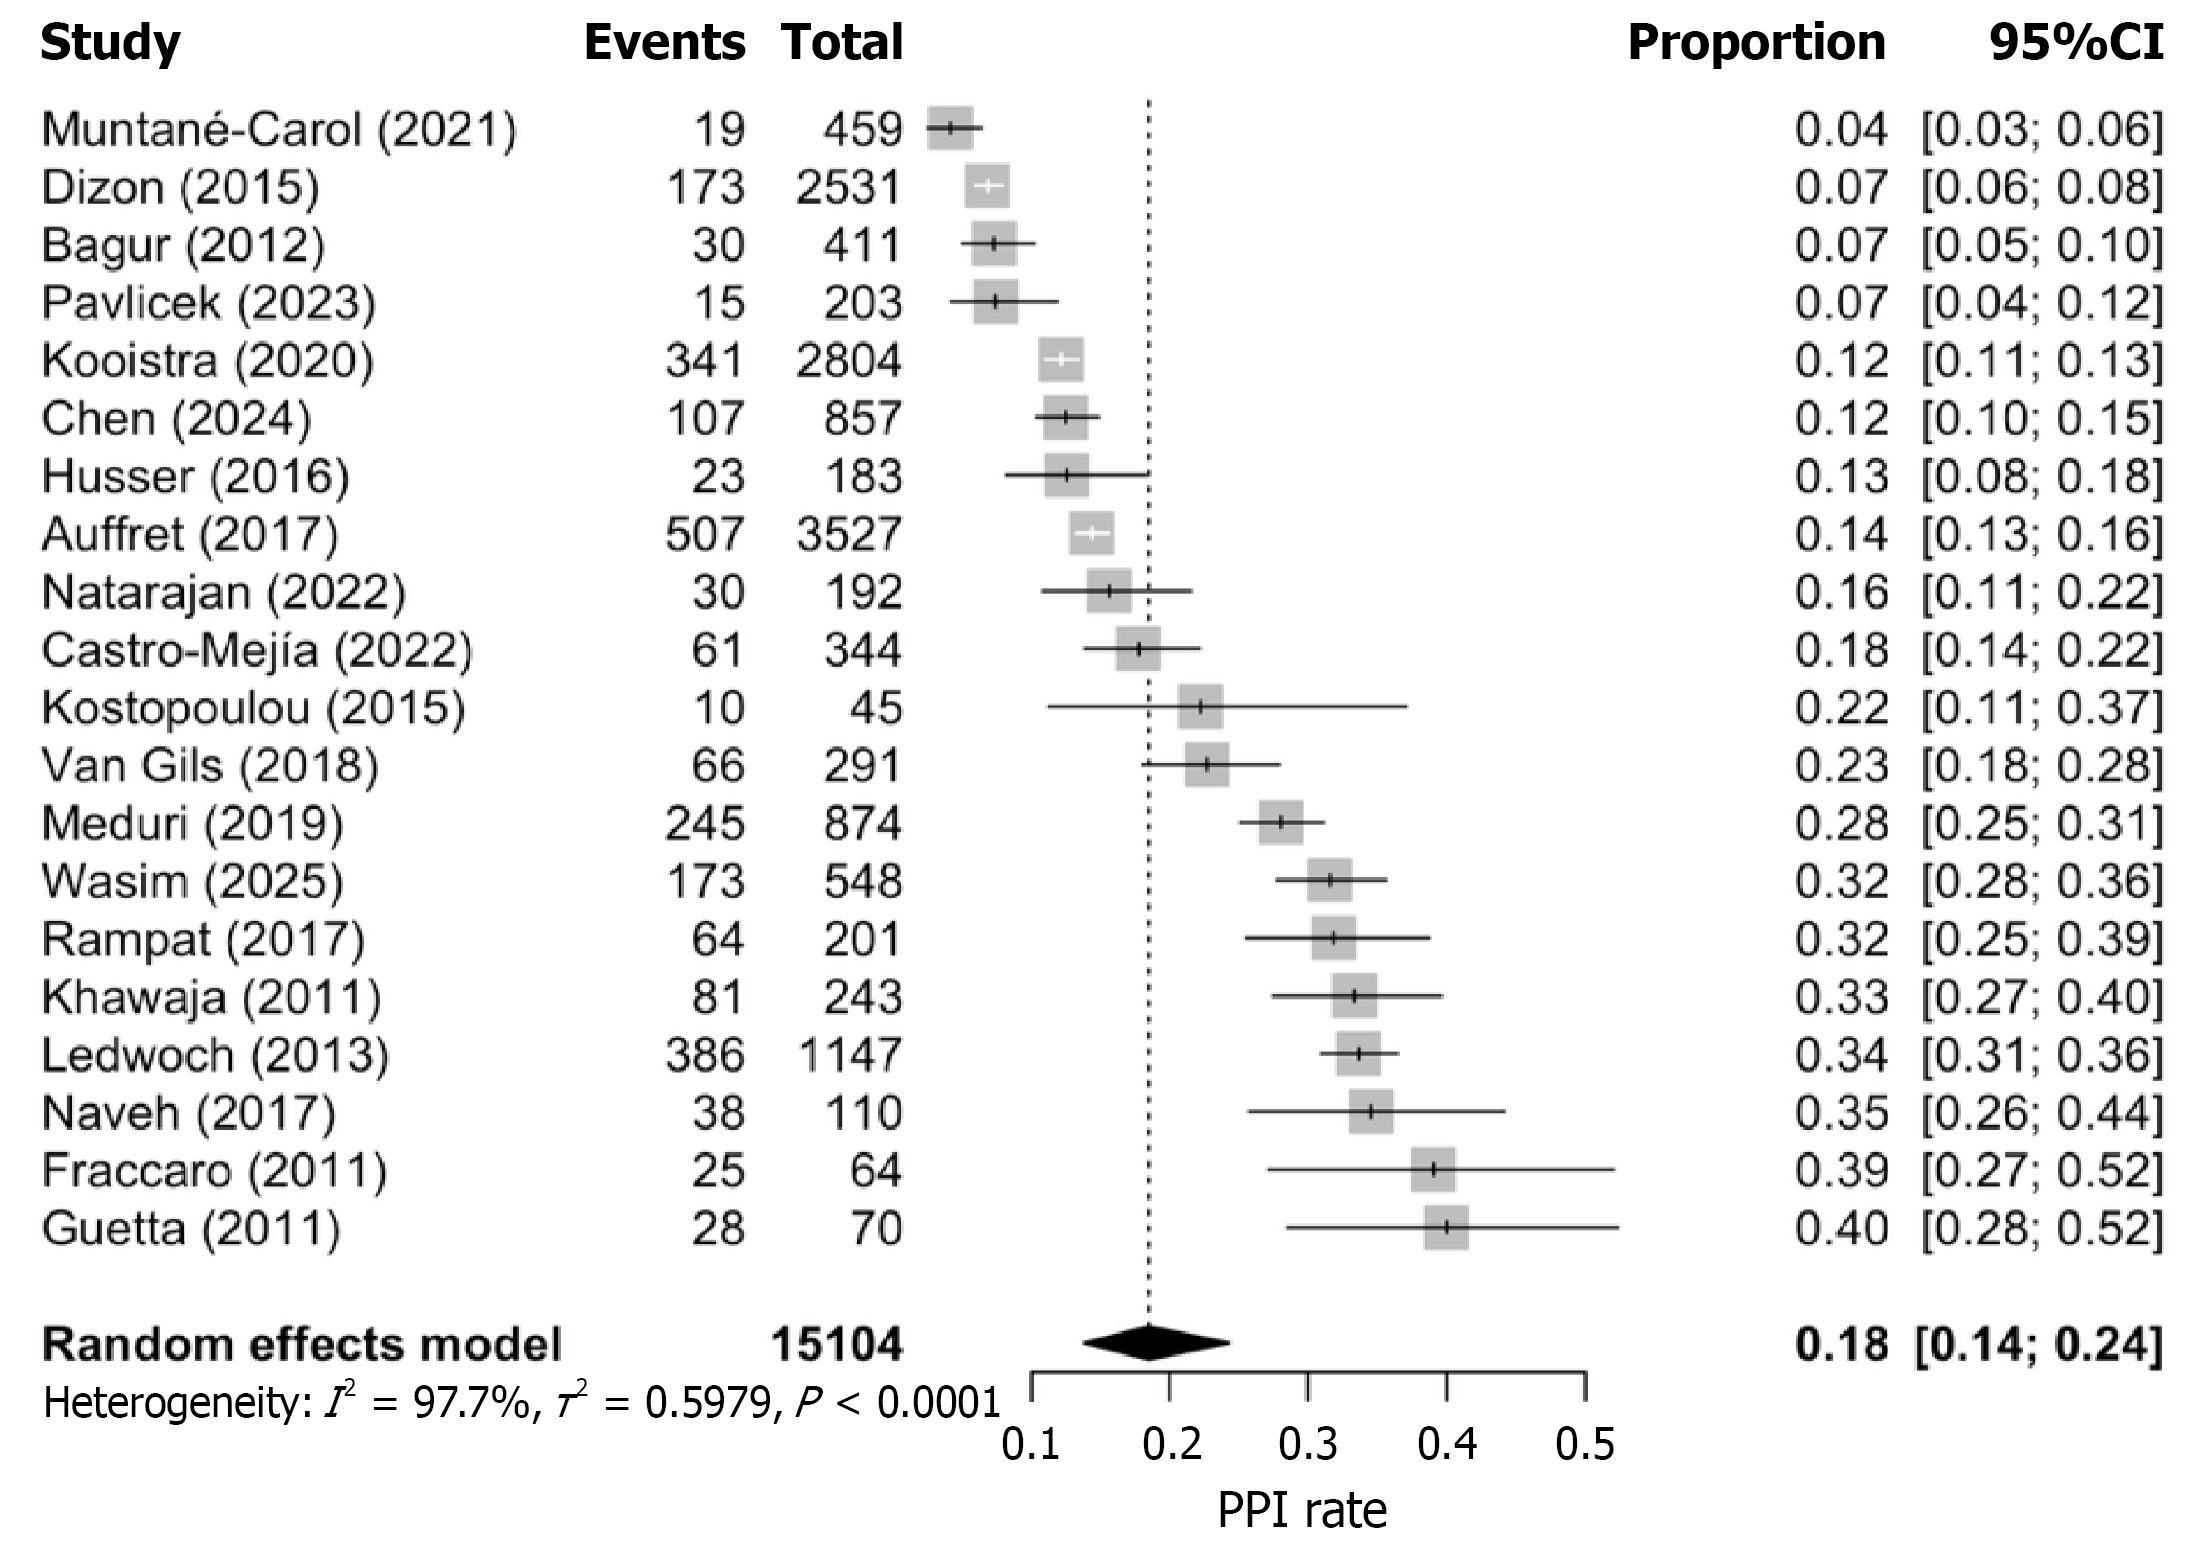
Figure 3 Forest plot depicting pooled incidence of new permanent pacemaker implantation following transcatheter aortic valve replacement across 20 studies (n = 15104) using an updated generalized linear mixed model analysis on the logit scale.
Pooled proportion 0.18 (95%CI: 0.14-0.24); I2 = 97.7%, indicating substantial heterogeneity attributable to differences in valve platform, implantation era, and pacing protocols. Each row represents one study; square size reflects study weight; diamond represents pooled estimate. PPI: Permanent pacemaker implantation.
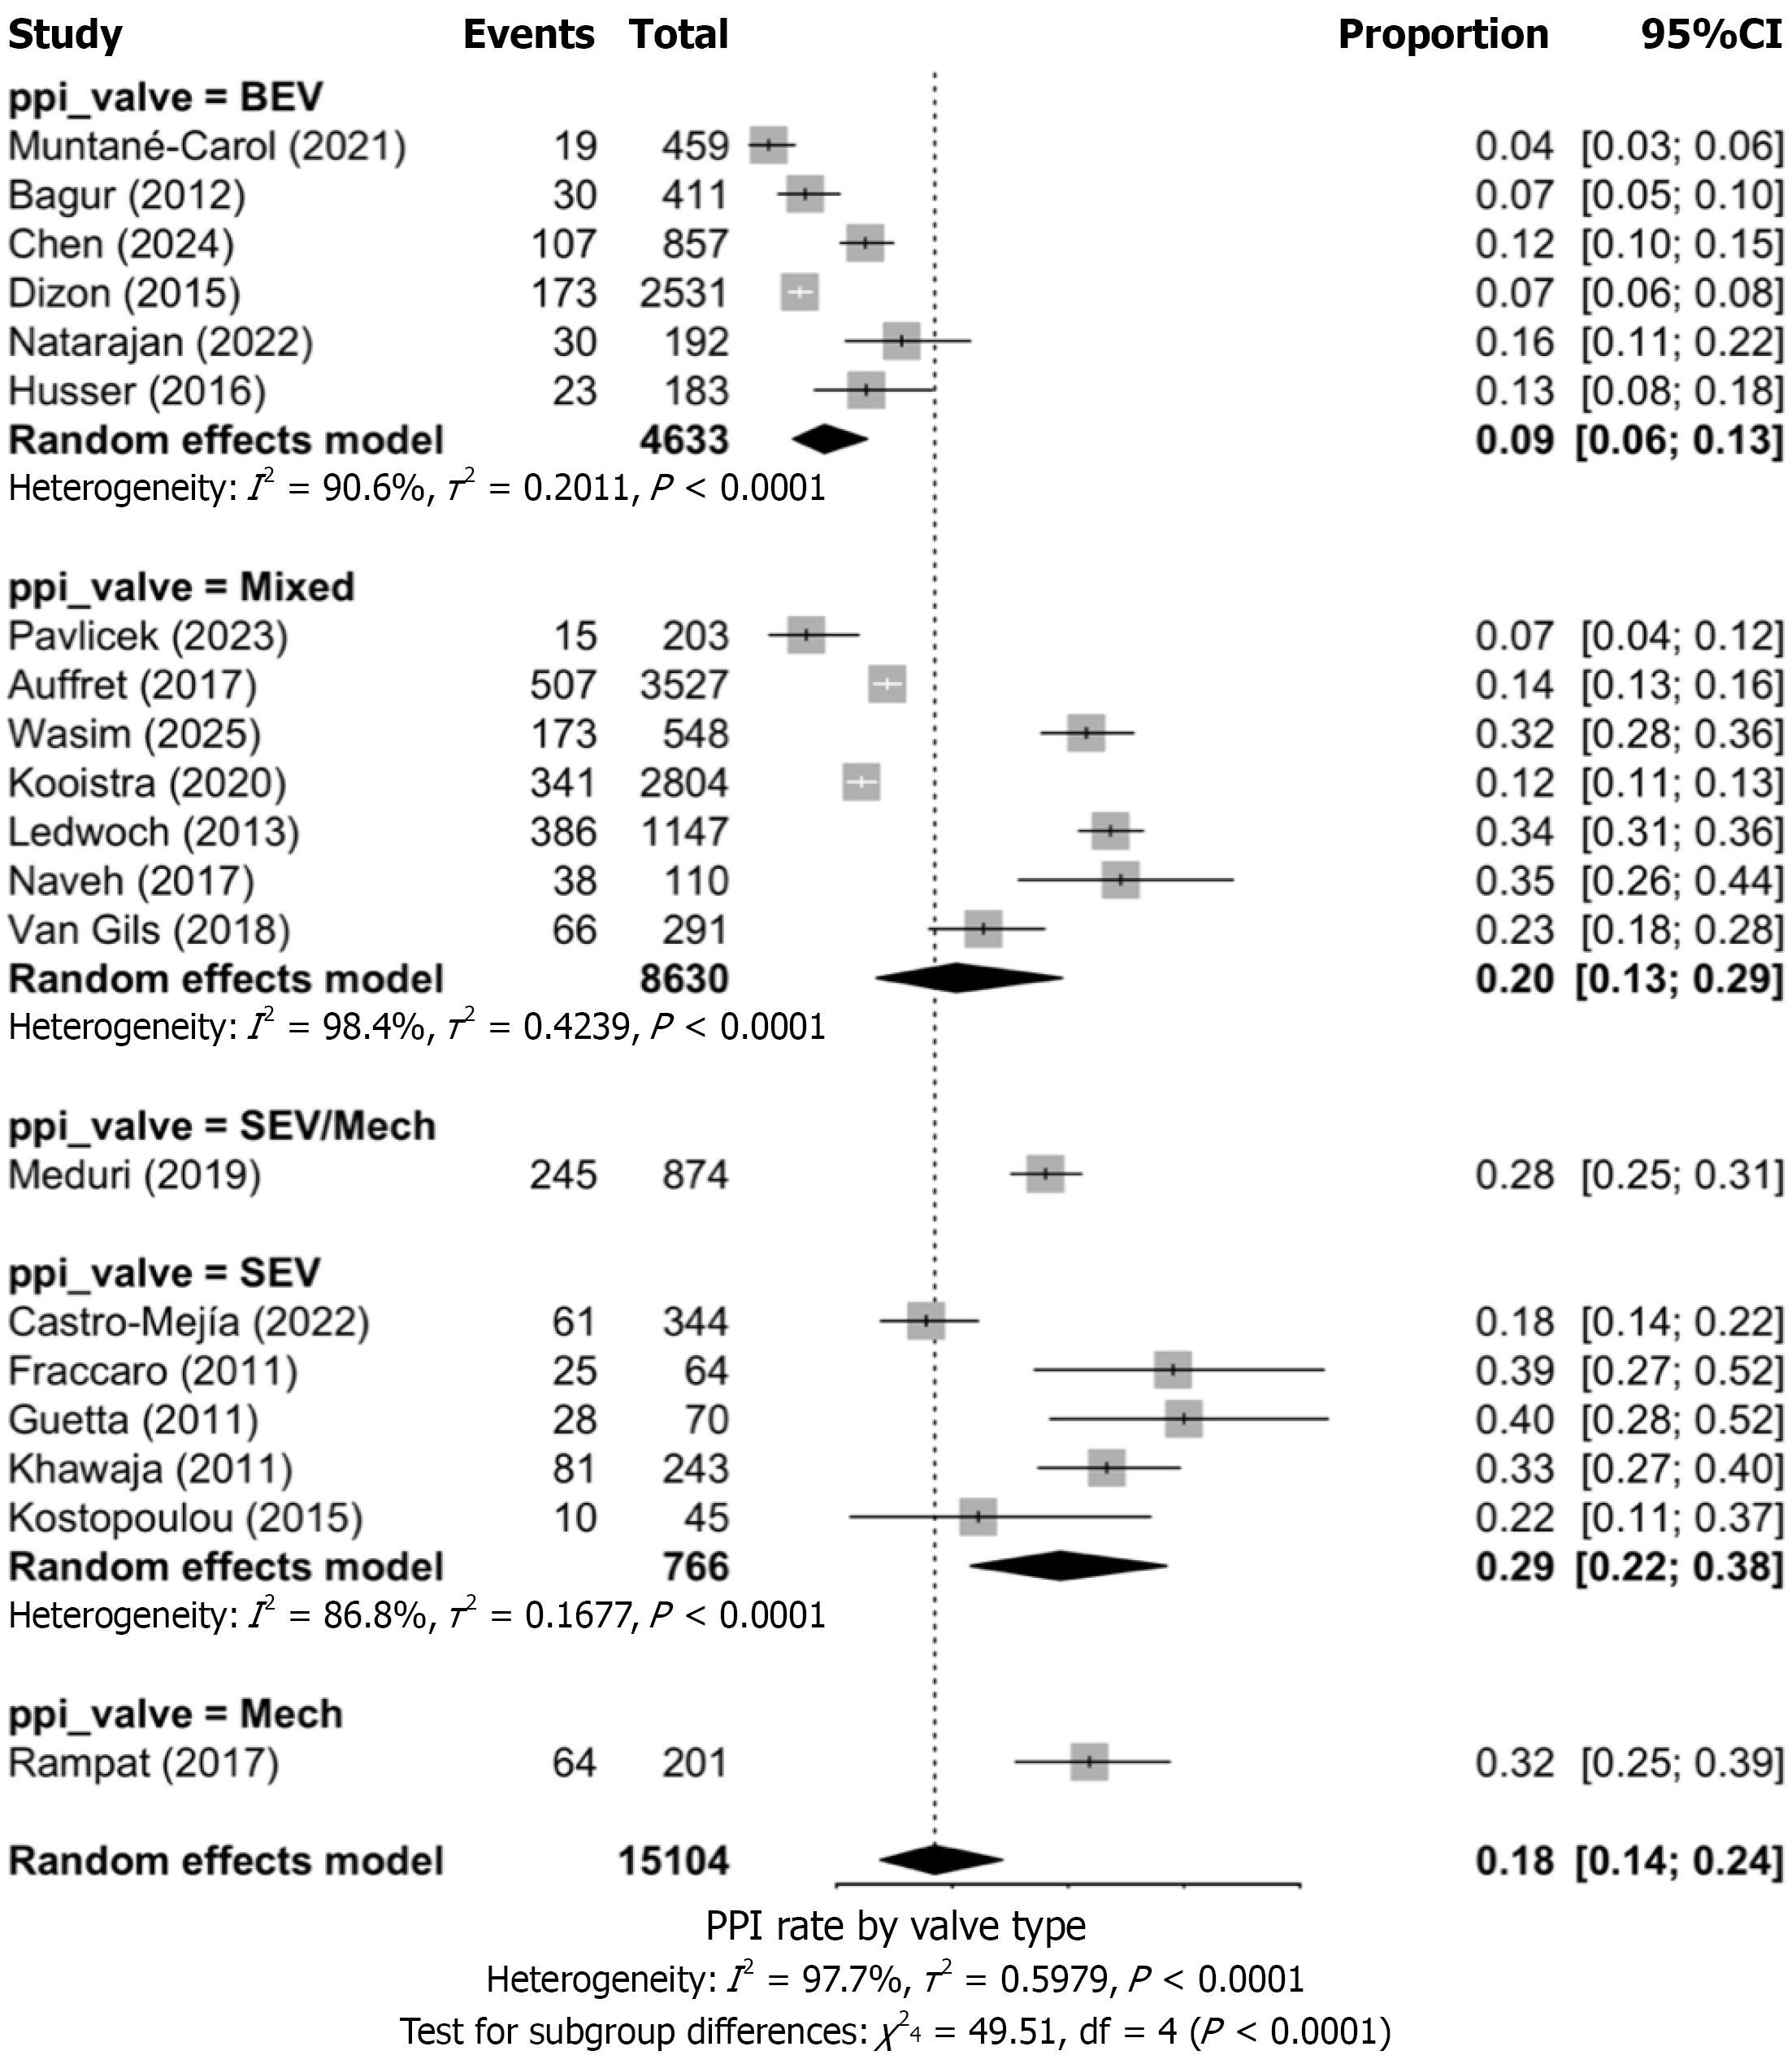
Figure 4 Valve-type subgroup analysis of pooled permanent pacemaker implantation incidence following transcatheter aortic valve replacement.
Studies were grouped into five valve-platform strata. Subgroup random-effects pooled proportions: Balloon-expandable valves 0.09 (95%CI: 0.06-0.13; I2 = 90.6%; 6 studies); mixed-platform cohorts 0.20 (95%CI: 0.13-0.29; I2 = 98.4%; 7 studies); self-expanding valves 0.29 (95%CI: 0.22-0.38; I2 = 86.8%; 5 studies). Two strata contained a single study each and were not pooled: Combined self-expanding and mechanically expanded valves 0.28 (95%CI: 0.25-0.31) and mechanically expanded valves alone 0.32 (95%CI: 0.25-0.39). Subgroup difference across all five strata: χ2 = 49.51, df = 4, P < 0.001. PPI: Permanent pacemaker implantation; BEV: Balloon-expandable valve; SEV: Self-expanding valve.
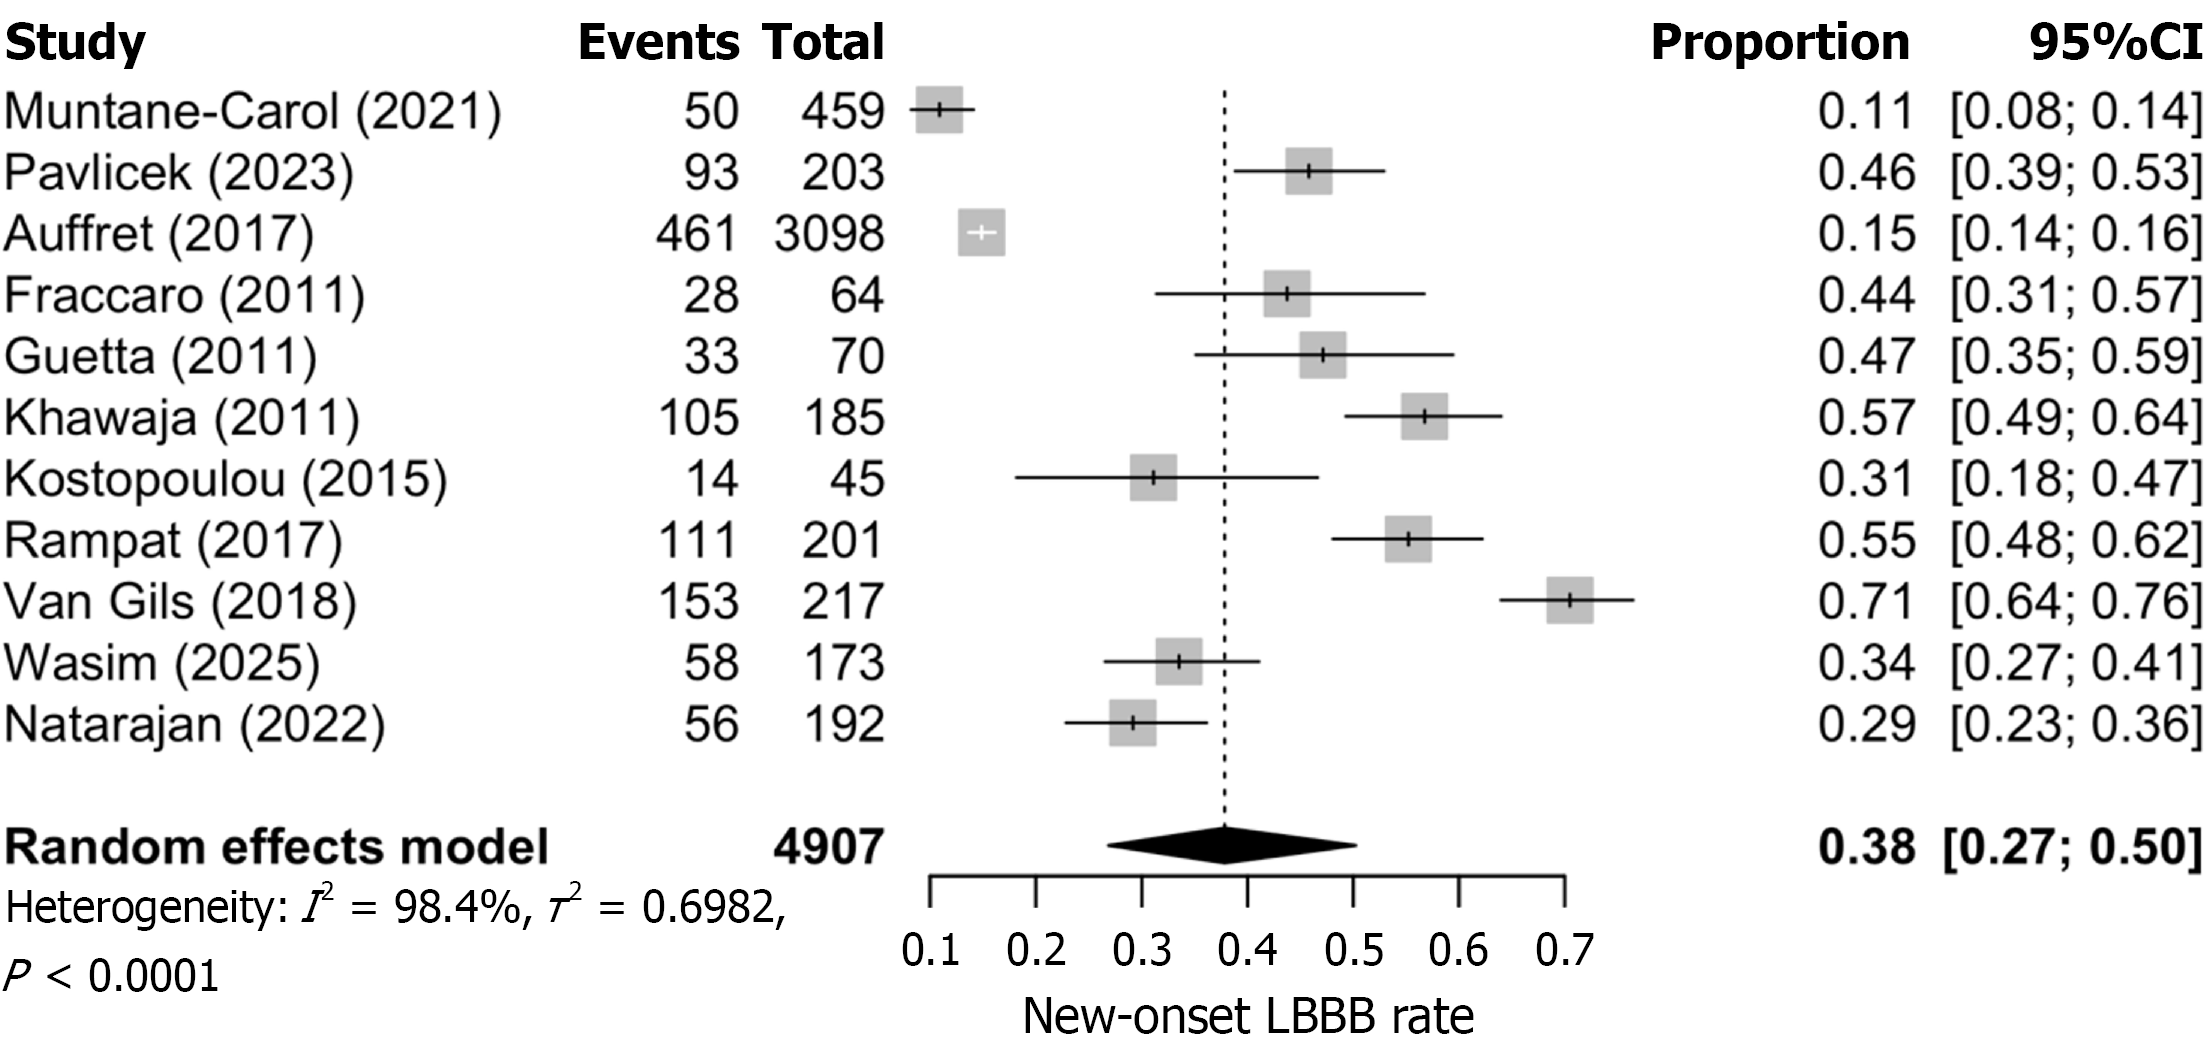
Figure 5 Forest plot depicting pooled incidence of new-onset left bundle branch block following transcatheter aortic valve replacement across 11 studies (n = 4907).
Random-effects model: Pooled proportion 0.38 (95%CI: 0.27-0.50); I2 = 98.4%, P < 0.0001, indicating substantial heterogeneity. Individual study proportions ranged from 0.11 (Muntané-Carol et al[18]) to 0.71 (Van Gils et al[29]), reflecting marked variation attributable to valve platform and implantation technique. LBBB: Left bundle branch block.
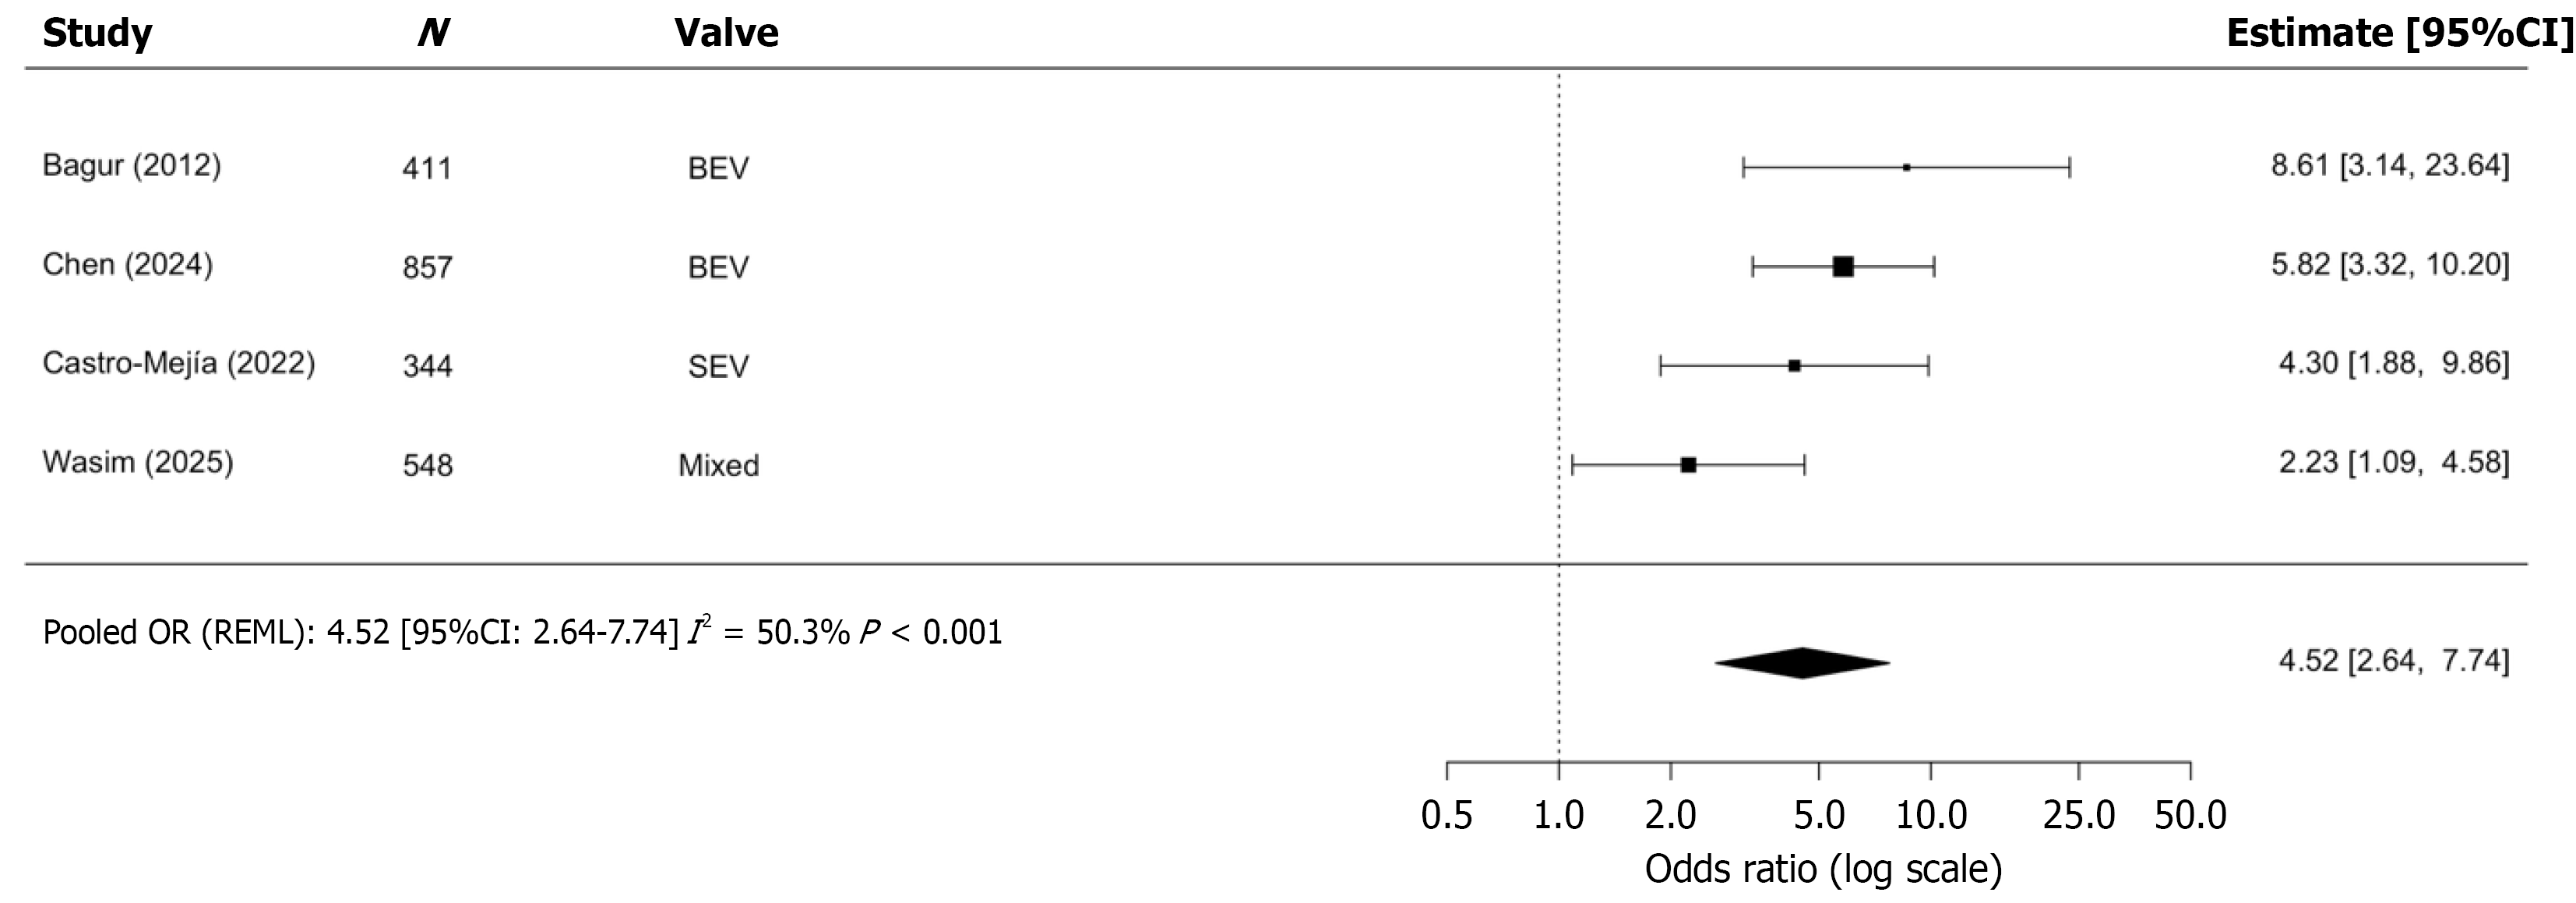
Figure 6 Forest plot depicting the association between pre-existing right bundle branch block and permanent pacemaker implantation after transcatheter aortic valve replacement across four studies (n = 2160) using random-effects restricted maximum likelihood analysis.
Pooled odds ratio (OR) = 4.52 (95%CI: 2.64-7.74); I2 = 50.3%, P < 0.001. Individual study ORs ranged from 2.23 (Wasim et al[30]) to 8.61 (Bagur et al[23]). Valve platforms are indicated per study. OR: Odds ratio; BEV: Balloon-expandable valve; SEV: Self-expanding valve.
- Citation: Fuchs TK, Jones C, Patterson JB. Impact of pre-existing conduction abnormalities on permanent pacemaker implantation after transcatheter aortic valve replacement: A meta-analysis. World J Cardiol 2026; 18(8): 123559
- URL: https://www.wjgnet.com/1949-8462/full/v18/i8/123559.htm
- DOI: https://dx.doi.org/10.4330/wjc.123559