Copyright
©The Author(s) 2025.
World J Cardiol. Nov 26, 2025; 17(11): 114140
Published online Nov 26, 2025. doi: 10.4330/wjc.v17.i11.114140
Published online Nov 26, 2025. doi: 10.4330/wjc.v17.i11.114140
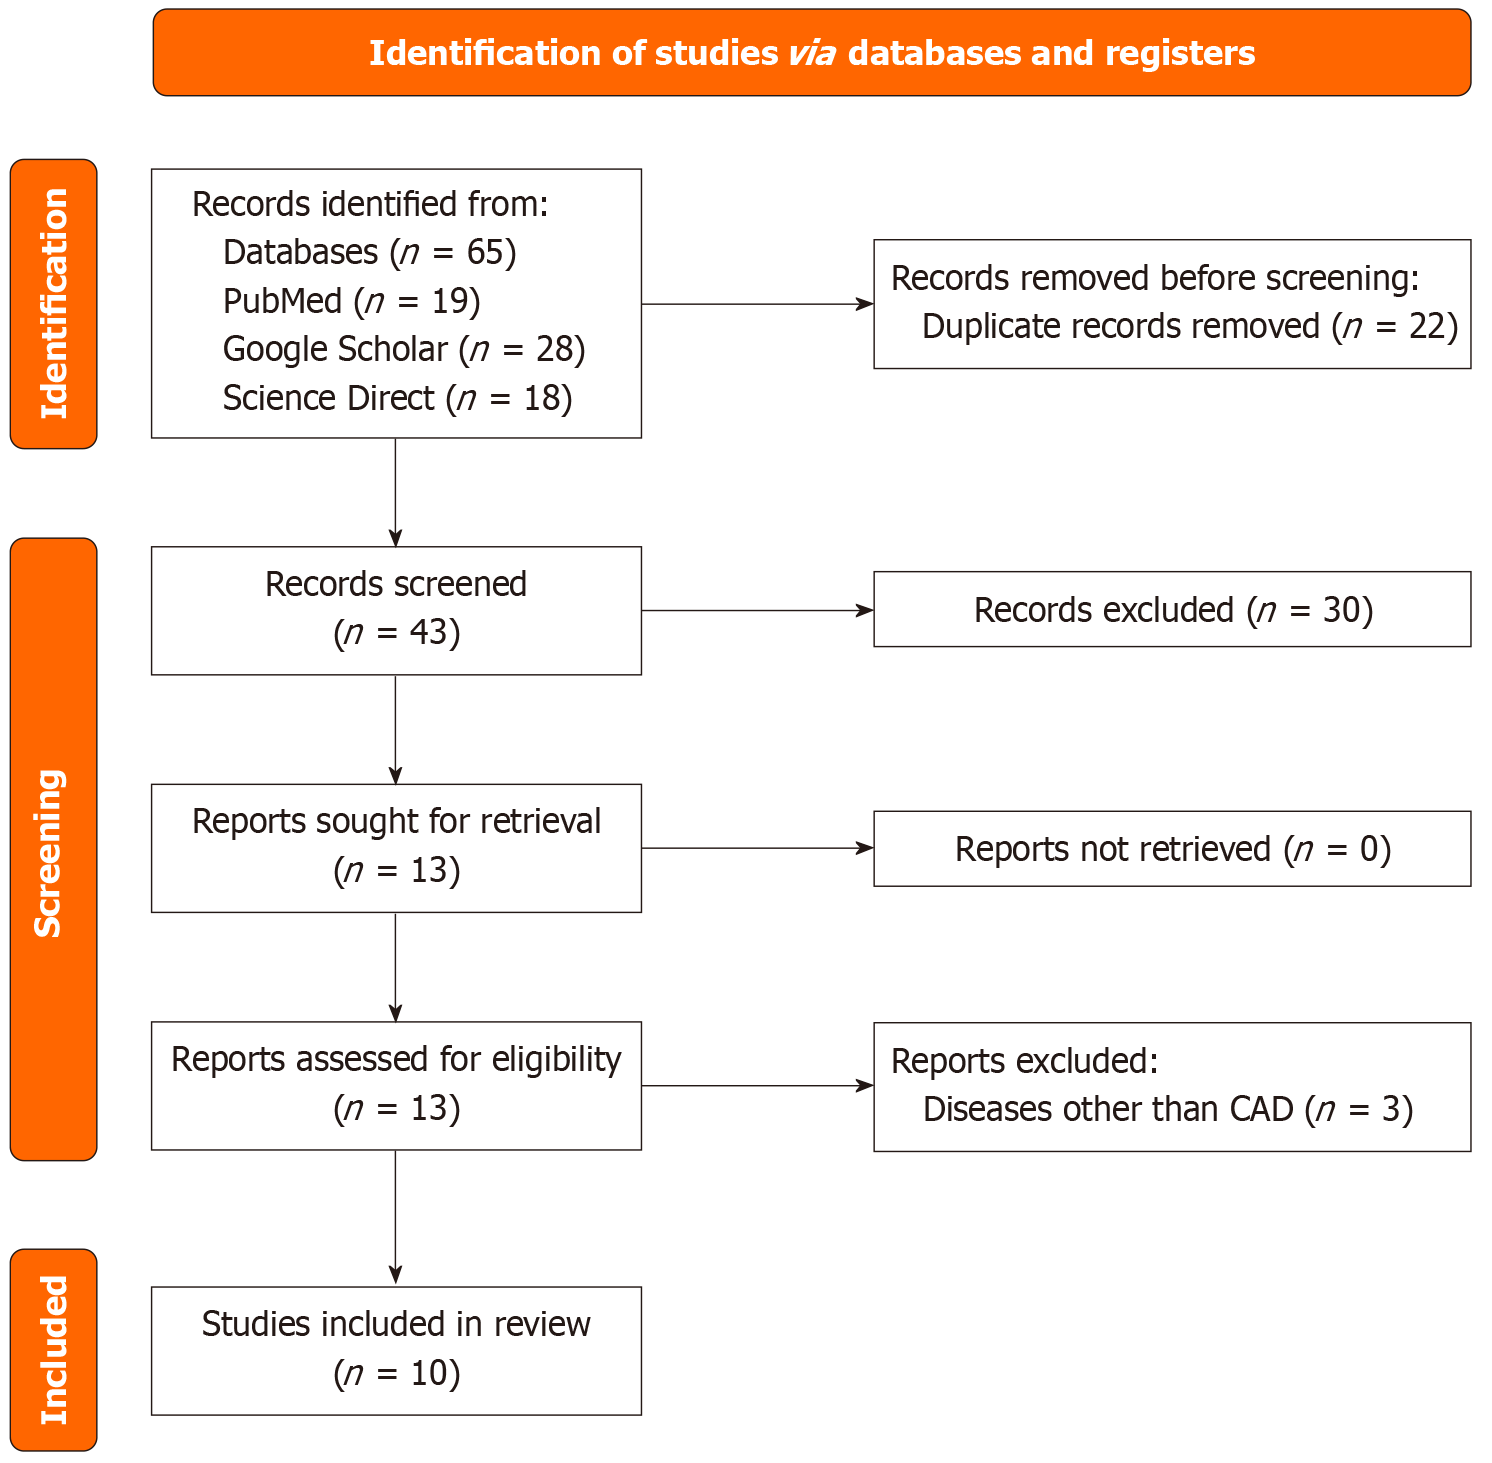
Figure 1
Flowchart showing the Preferred Reporting Items for Systematic Reviews and Meta-Analyses study selection process.
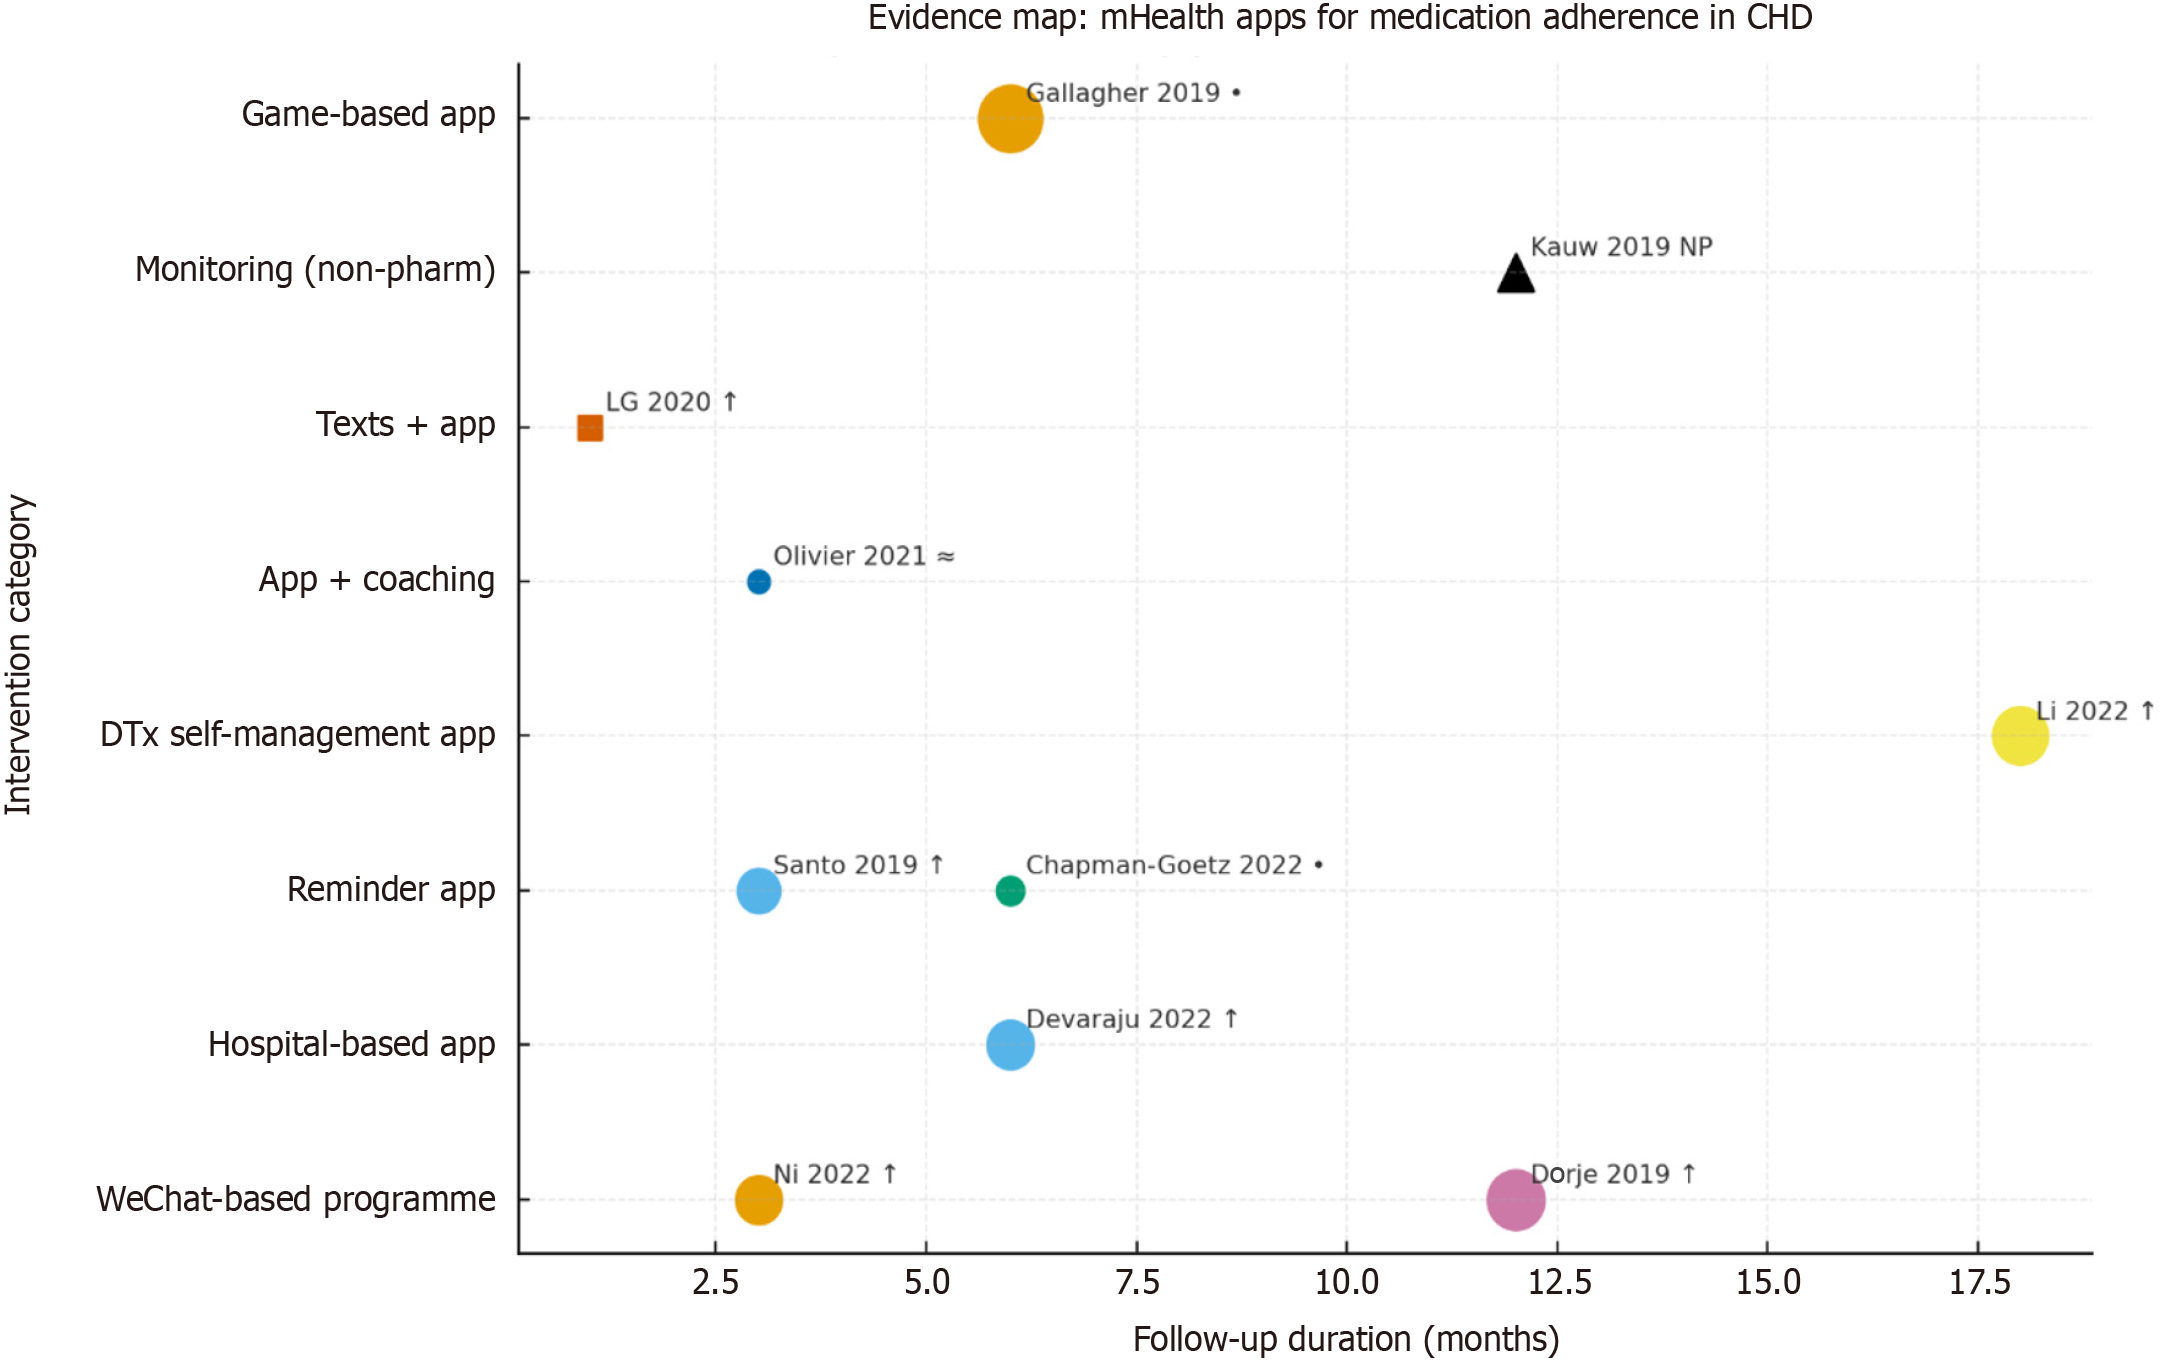
Figure 2 Bubble evidence map.
Follow-up on X-axis, intervention category on Y-axis; bubble size represents total sample; shape represents design; annotation represents author-year + outcome. CHD: Congenital heart disease; DTx: Digital therapeutics; mHealth: Mobile health.
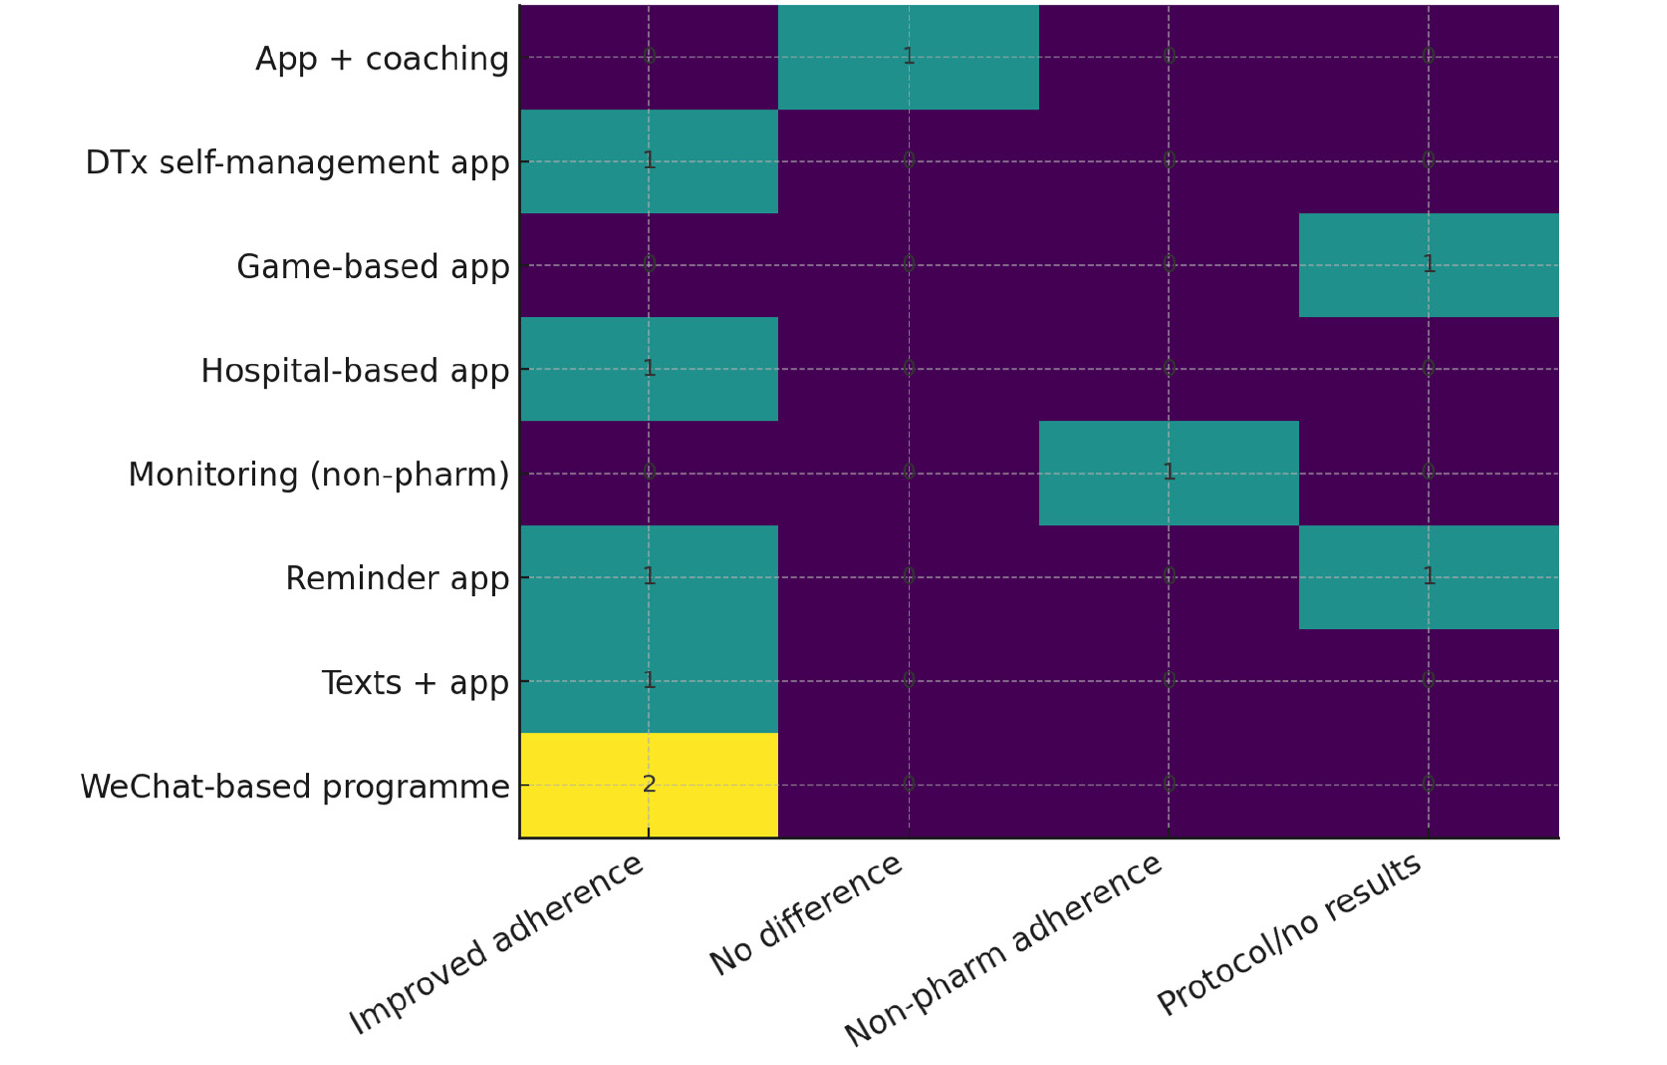
Figure 3 Evidence matrix heatmap (intervention category × outcome category, with counts).
DTx: Digital therapeutics.
- Citation: Seyam MK, Shaik RA, Miraj M, Alzahrani NS, Shaik AR, Ajmera P, Kalra S, Miraj SA, Shawky GM, Nurani KM, A P. Effect of mobile phone applications on medication adherence among patients with coronary artery diseases: A scoping review. World J Cardiol 2025; 17(11): 114140
- URL: https://www.wjgnet.com/1949-8462/full/v17/i11/114140.htm
- DOI: https://dx.doi.org/10.4330/wjc.v17.i11.114140


