Copyright
©The Author(s) 2025.
World J Cardiol. Nov 26, 2025; 17(11): 109739
Published online Nov 26, 2025. doi: 10.4330/wjc.v17.i11.109739
Published online Nov 26, 2025. doi: 10.4330/wjc.v17.i11.109739
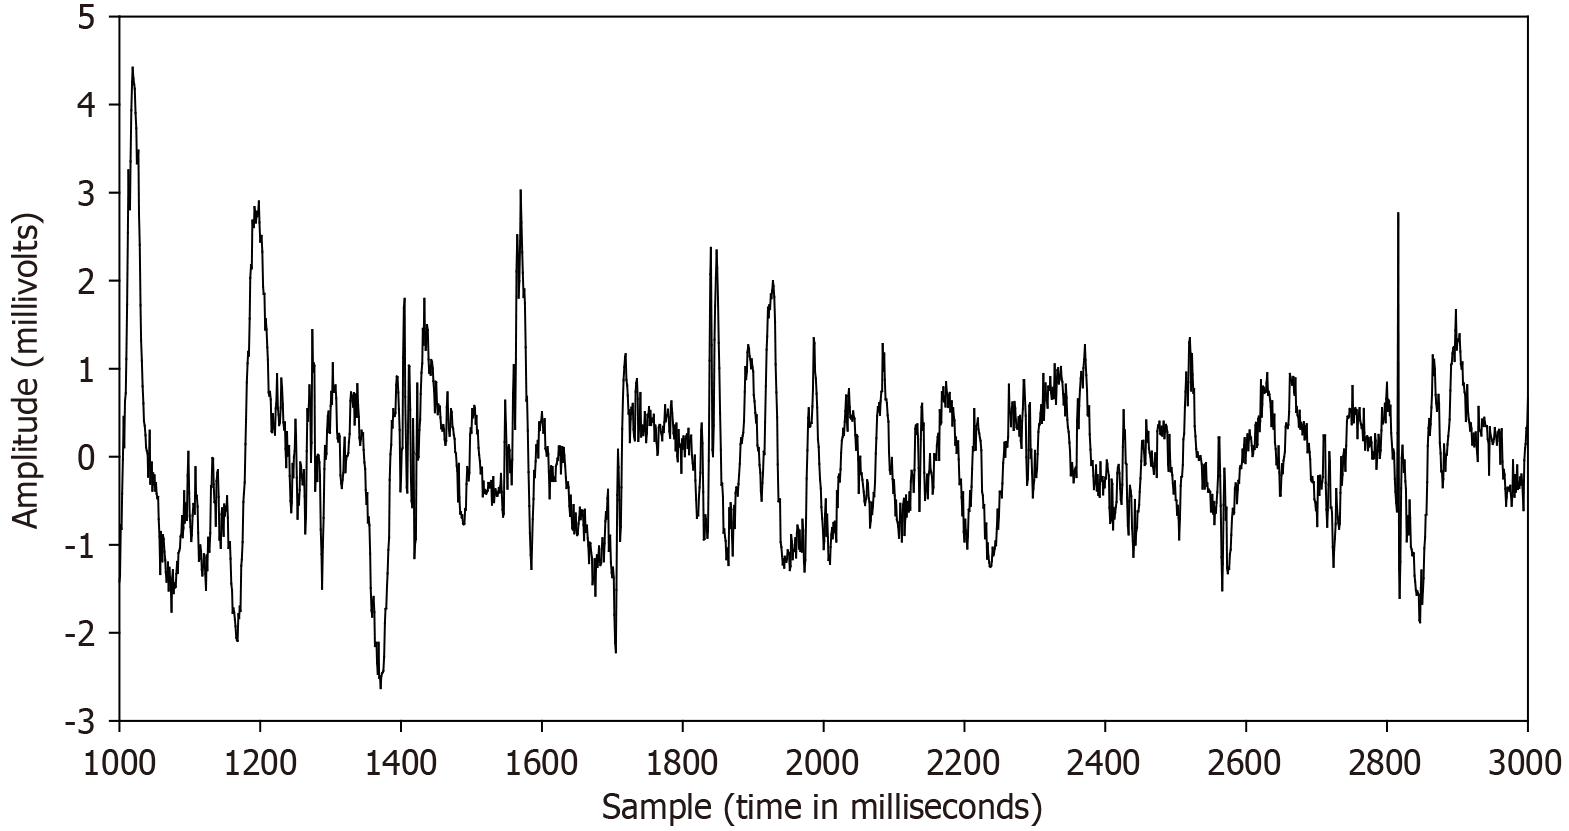
Figure 1 Example of a complex fractionated atrial electrogram from a paroxysmal atrial fibrillation patient.
Complex fractionated atrial electrograms are fractionated electrograms comprised of multiple deflections each atrial cycle, caused by the presence of multiple asynchronous electrical activation points. The electrogram deflections often appear to be random, varying in size and shape. Peaks are usually of low amplitude, although larger peaks may be interspersed. The fractionated electrogram recordings tend to differ in patients with paroxysmal vs persistent atrial fibrillation, which may reflect the degree of substrate remodeling. Satisfactory quantitative methods to characterize these electrograms are yet lacking.
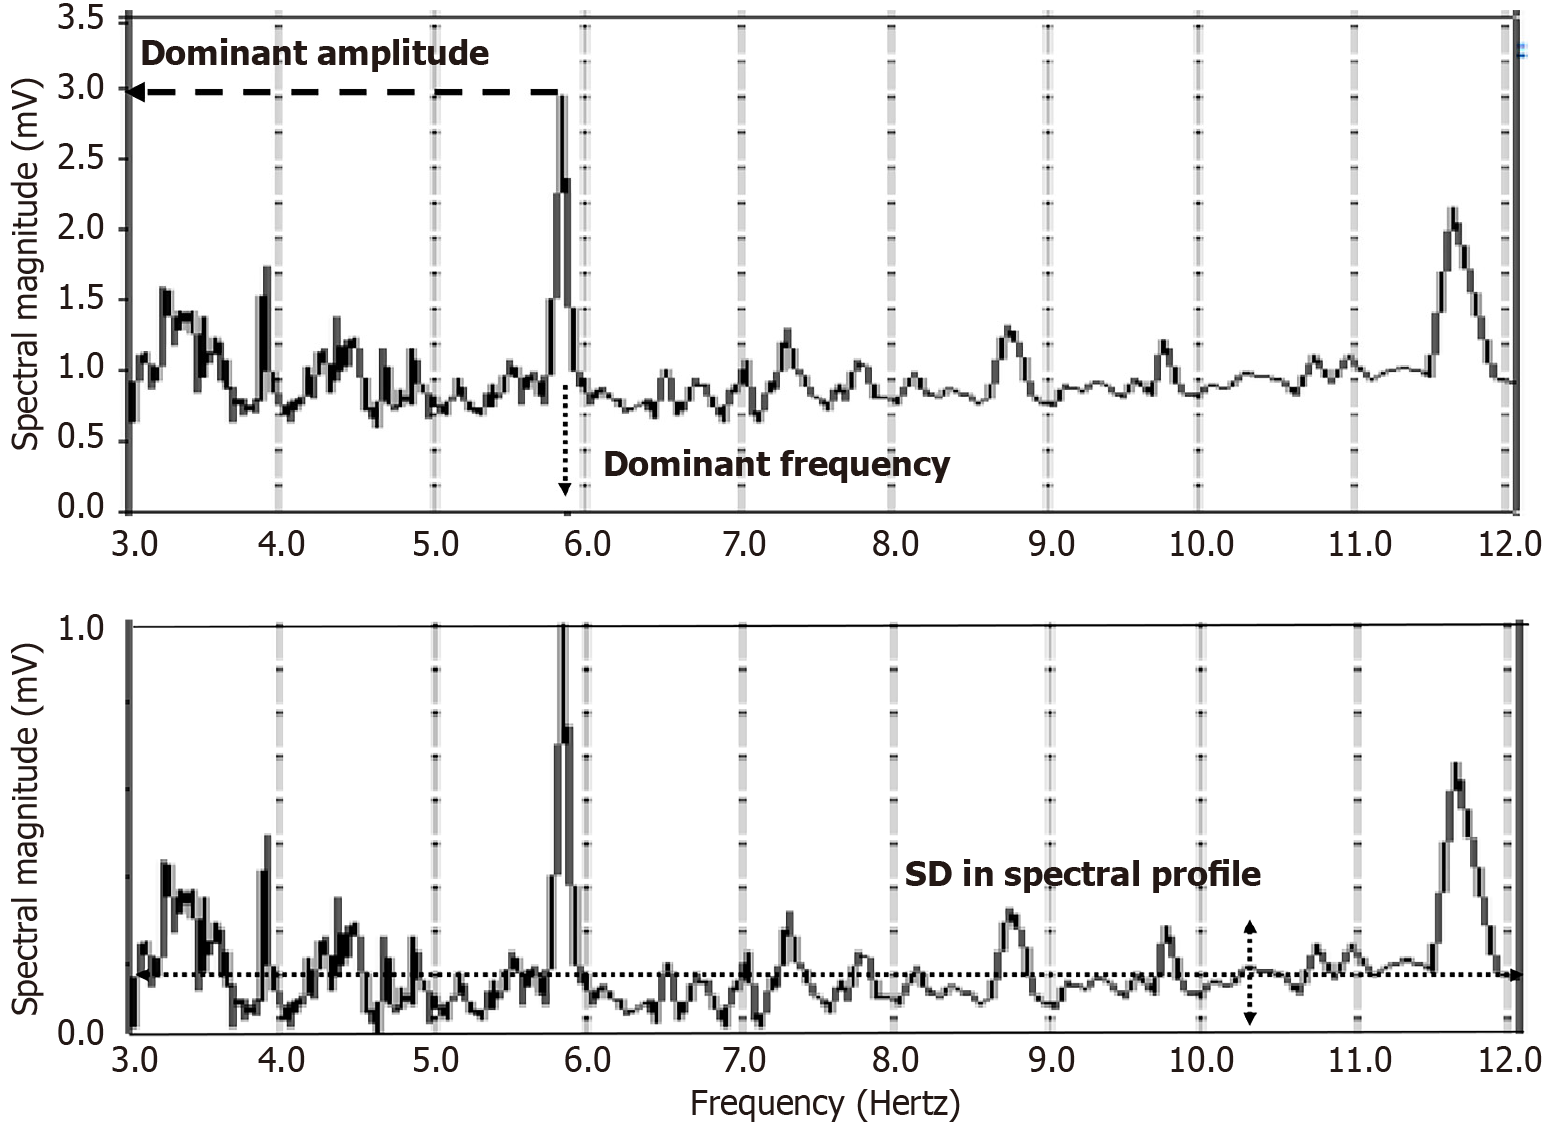
Figure 2 An example frequency spectrum (top panel) generated from an atrial electrogram which was acquired during atrial fibrillation in a persistent atrial fibrillation patient.
The largest spectral peak in the physiologic range of interest, typically 3–12 Hz, which is not a harmonic, is defined as the dominant frequency or DF. The amplitude or magnitude of that frequency component is labeled the dominant amplitude or DA. Two other parameters can be described by first normalizing the range of the ordinate axis to 0–1 mV (bottom panel). The mean value of this normalized frequency spectrum is termed the mean spectral profile (MP), and its SD is labeled the spectral profile (SP). The MP will be larger when the atrial electrogram is more random, such that there is no predominant spectral peak. The SP will tend to increase as the number of spectral components of varying amplitudes increases.
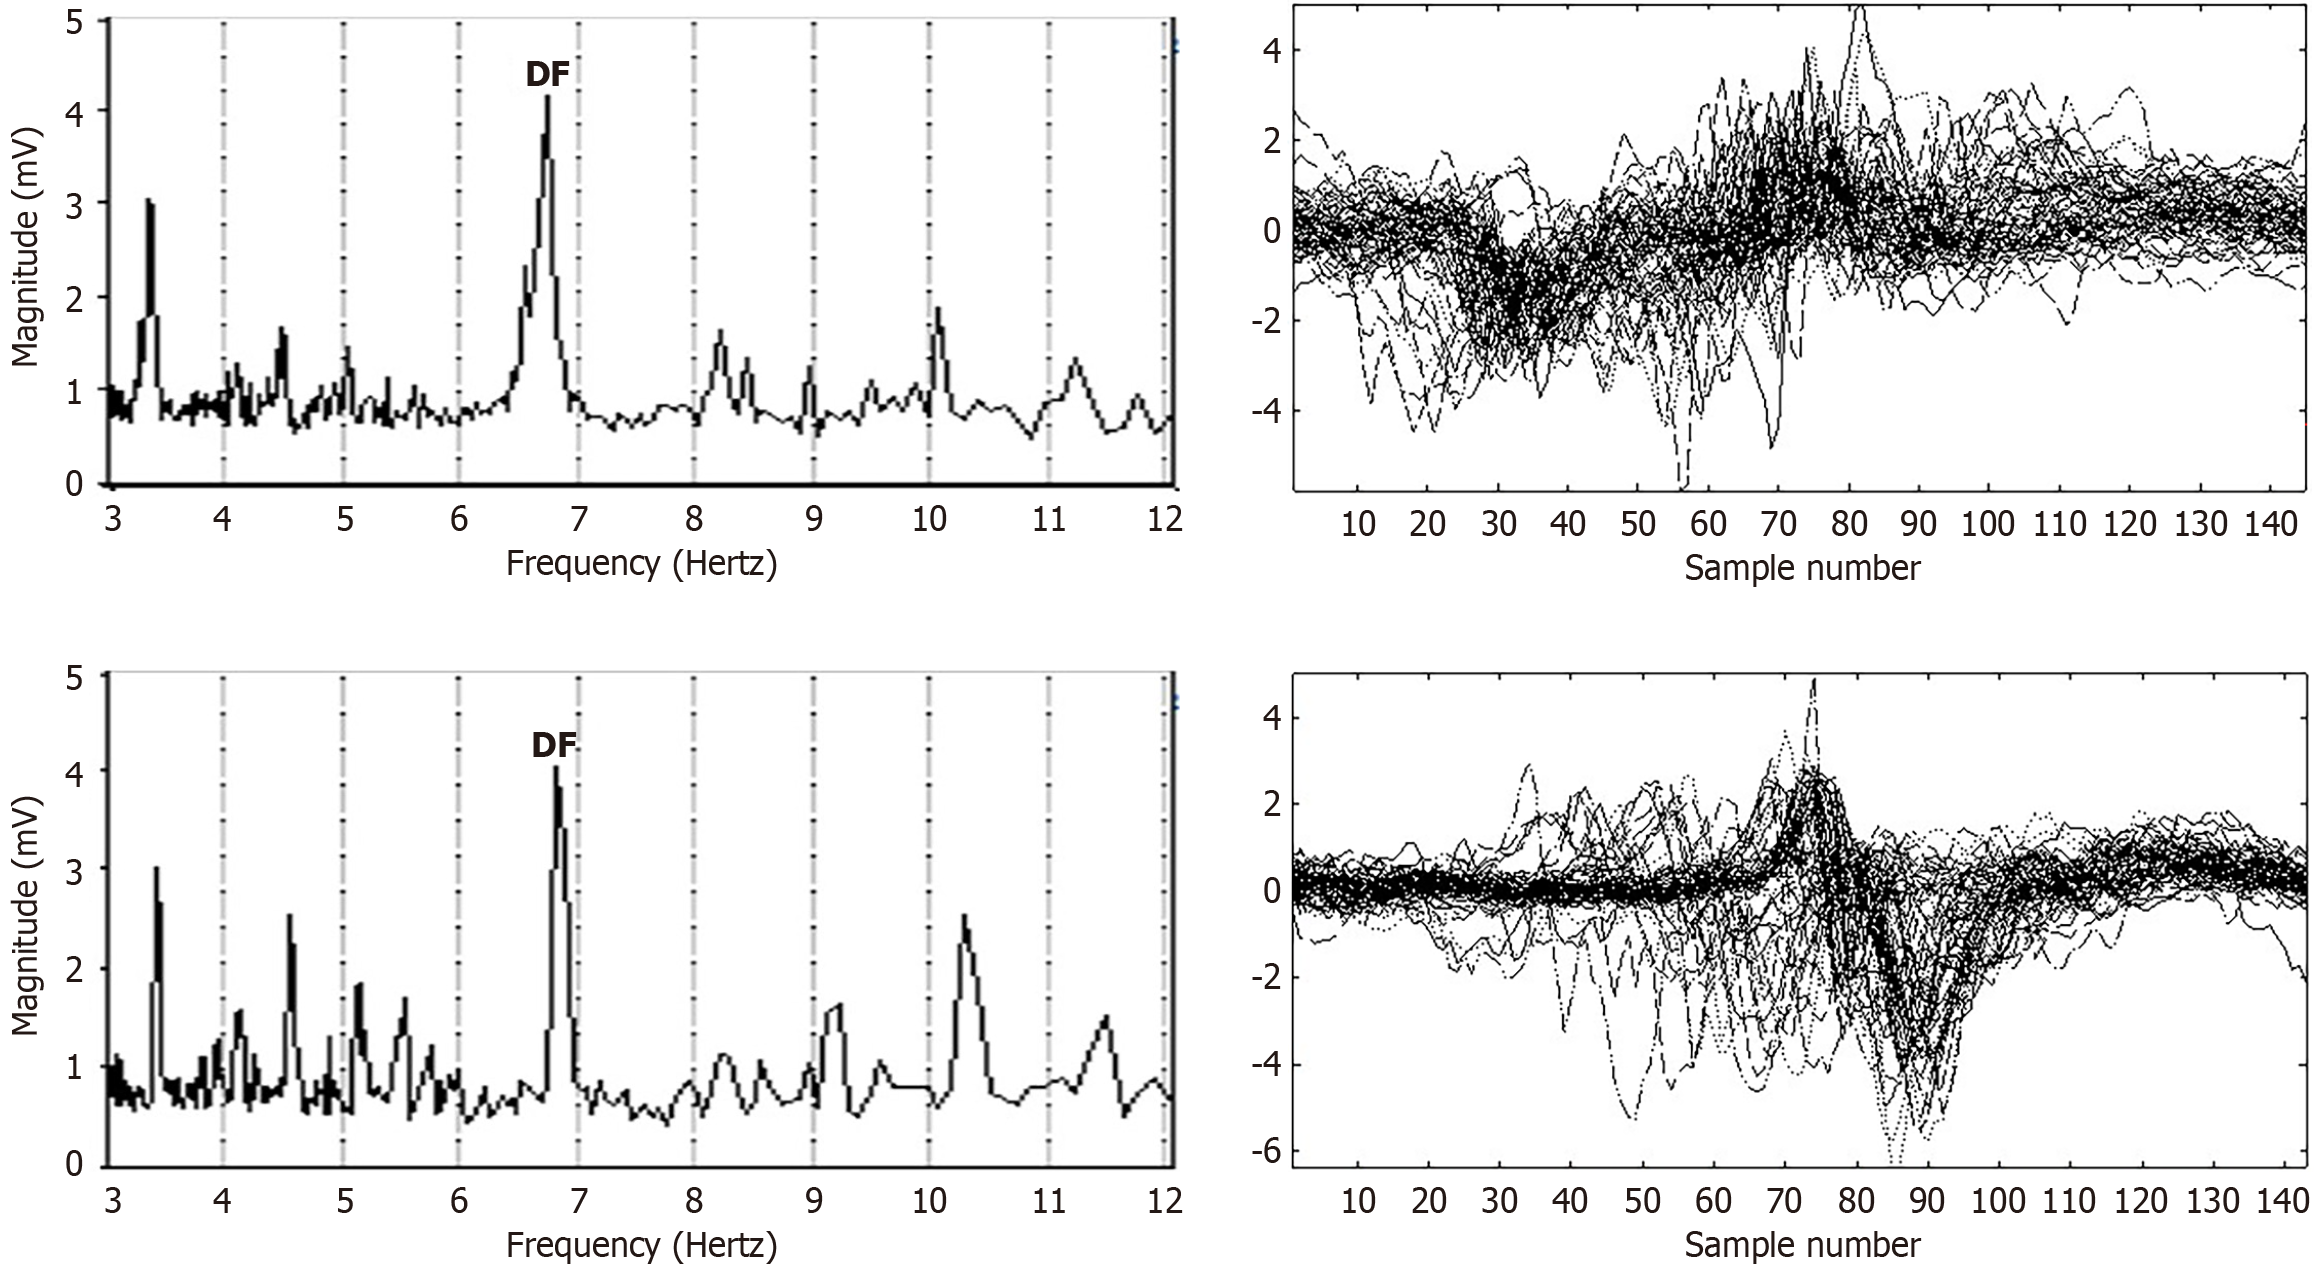
Figure 3 To show variability of atrial fibrillation electrograms (patient with persistent atrial fibrillation) the frequency spectrum was first computed for electrograms acquired at dual sites in proximity in the left atrium.
Similar values of dominant frequency (DF) are evident (left panels), and it is apparent that the DF in each case is the predominant frequency–only a few lesser frequency components are evident in each spectrum. Addressing this scenario, the time series was windowed based on the period of each DF, with the resulting segments evident in the right panels. The electrogram deflections for each DF cycle are often overlapping. In the top right panel, the electrogram is broad and biphasic, starting with a negative deflection and ending with a positive deflection. Although there is some cycle-to-cycle variability, the gross morphologic properties appear mostly consistent. The same basic shape and pattern are evident in each cycle, except for a few deviations. The deviations include earlier onset of the early deflection, which corresponds to earlier arrival of the wavefront at the negative pole of the bipolar electrode. The abscissa is given as sample number, and for the digitization rate of 1200 Hz it is an approximation of the time in milliseconds. Likewise, for the overlap of the lower right panel electrogram, there is similarity between segments, although the entire biphasic deflection sometimes occurs earlier in the cycle, suggesting earlier breakthrough from the source or earlier completion of the reentrant circuit, with variable degree of earliness. DF: Dominant frequency.
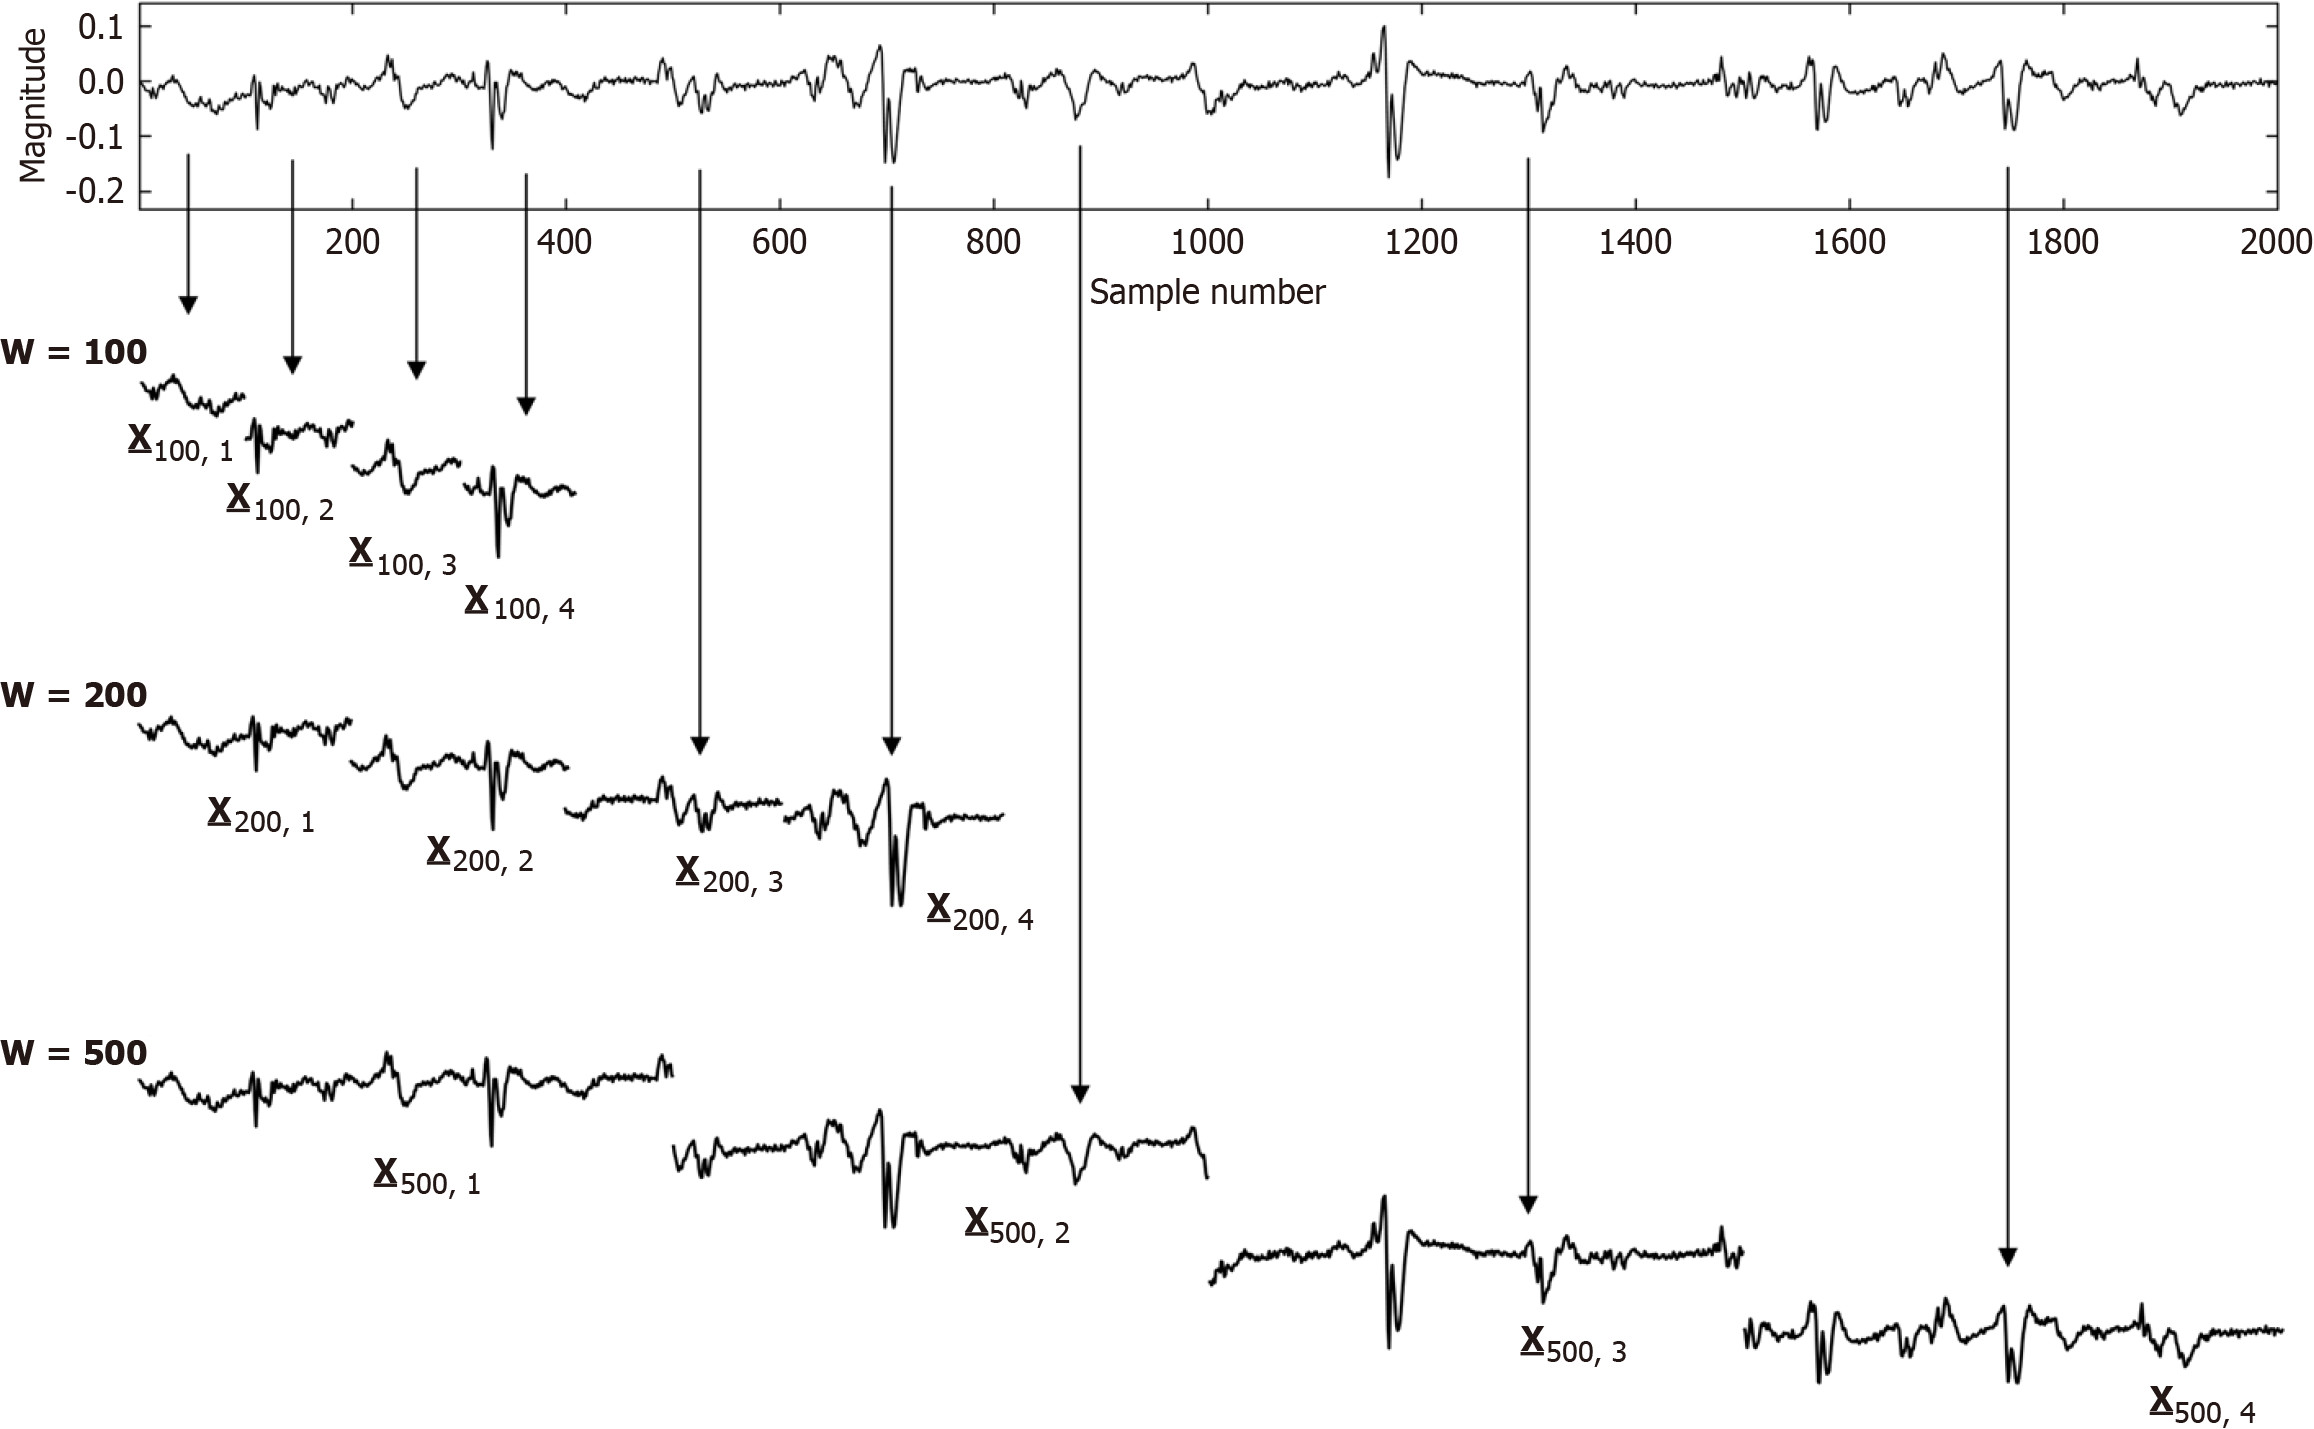
Figure 4 An example atrial fibrillation electrogram is shown in the top graph with variable deflection rate and morphology.
The ensemble mean or average of electrogram signal segments of length w can be determined from such a signal. The signal can be segmented using a window width w, where frequency = 1/w. For each w, the signal segments can be summed to compute spectral power at that frequency. This method, an alternate to Fourier analysis, is termed the Novel or New Spectral Estimator. The dominant frequency or DF so computed (peak frequency) describes the power at the activation rate of the signal. Greater power reflects those larger portions of the substrate in the field of view of the bipolar electrode activating at time intervals w, i.e. the coupling interval or cycle length. Since activation is randomized, it is likely indicative of the local refractory period, with longer coupling intervals portending longer local refractory periods.
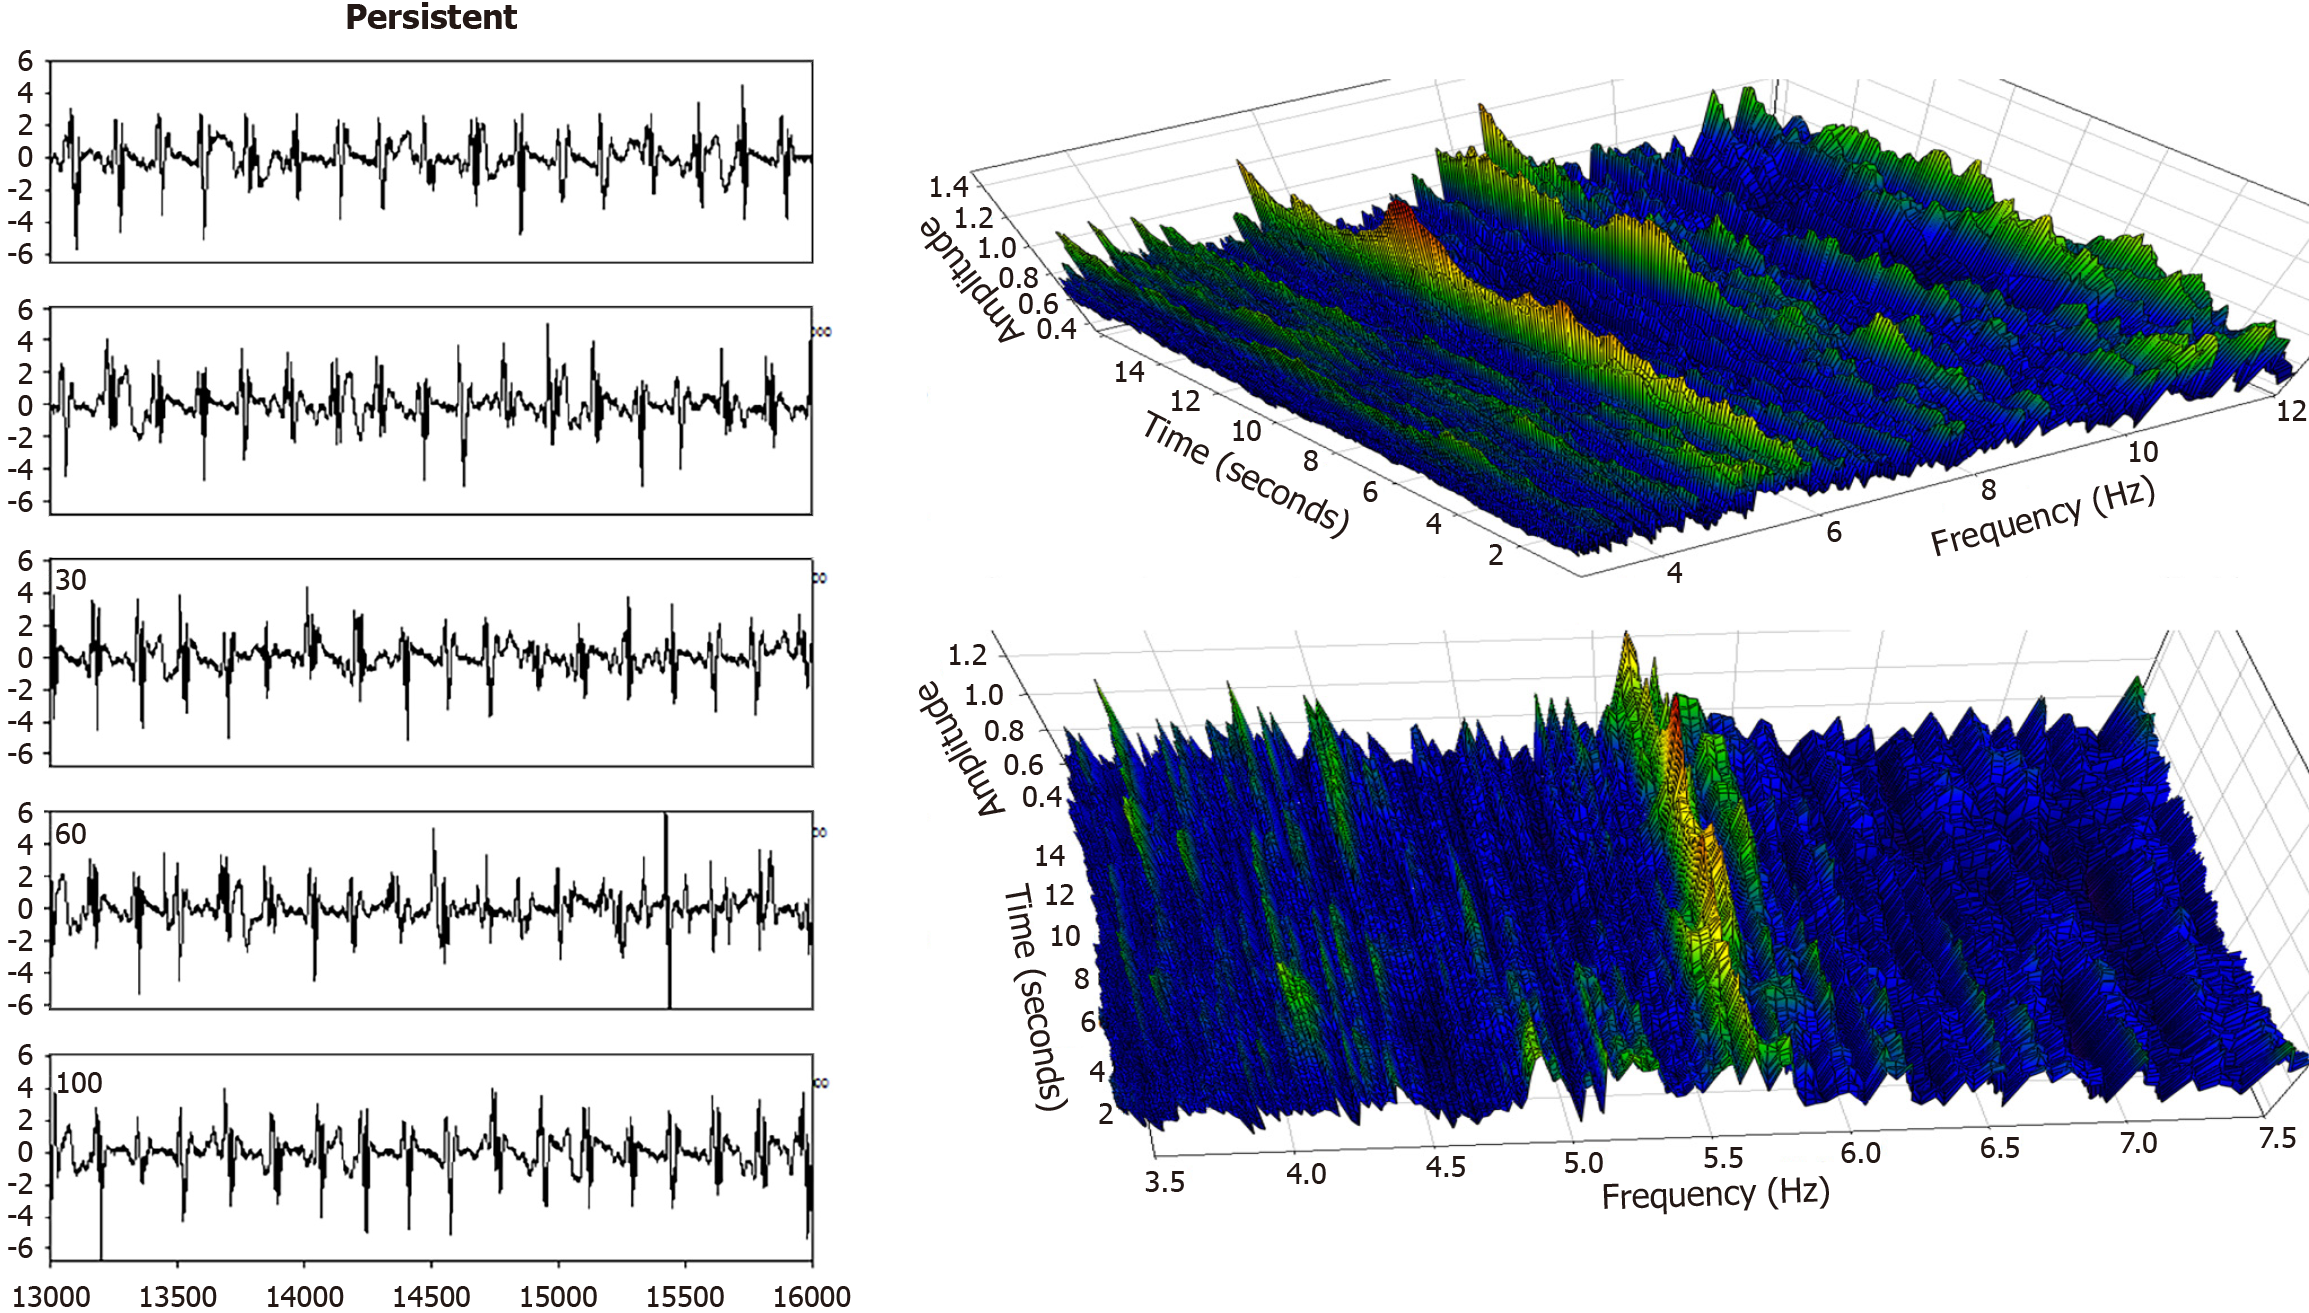
Figure 5 Left panel-successive time series segments from an atrial fibrillation recording in a persistent atrial fibrillation patient, anterior free wall.
The electrogram morphology is highly variable from one cycle to the next, yet the individual cycles are distinguishable, and the cycle length is evident. This observation translates to a similar and approximately constant dominant frequency (DF) spectrum (right panels) which is highlighted as the highest amplitude value (red, orange, and yellow color) over time. The DF for this persistent atrial fibrillation patient is therefore on the order of approximately 5.7 Hz, but it varies and bifurcates.
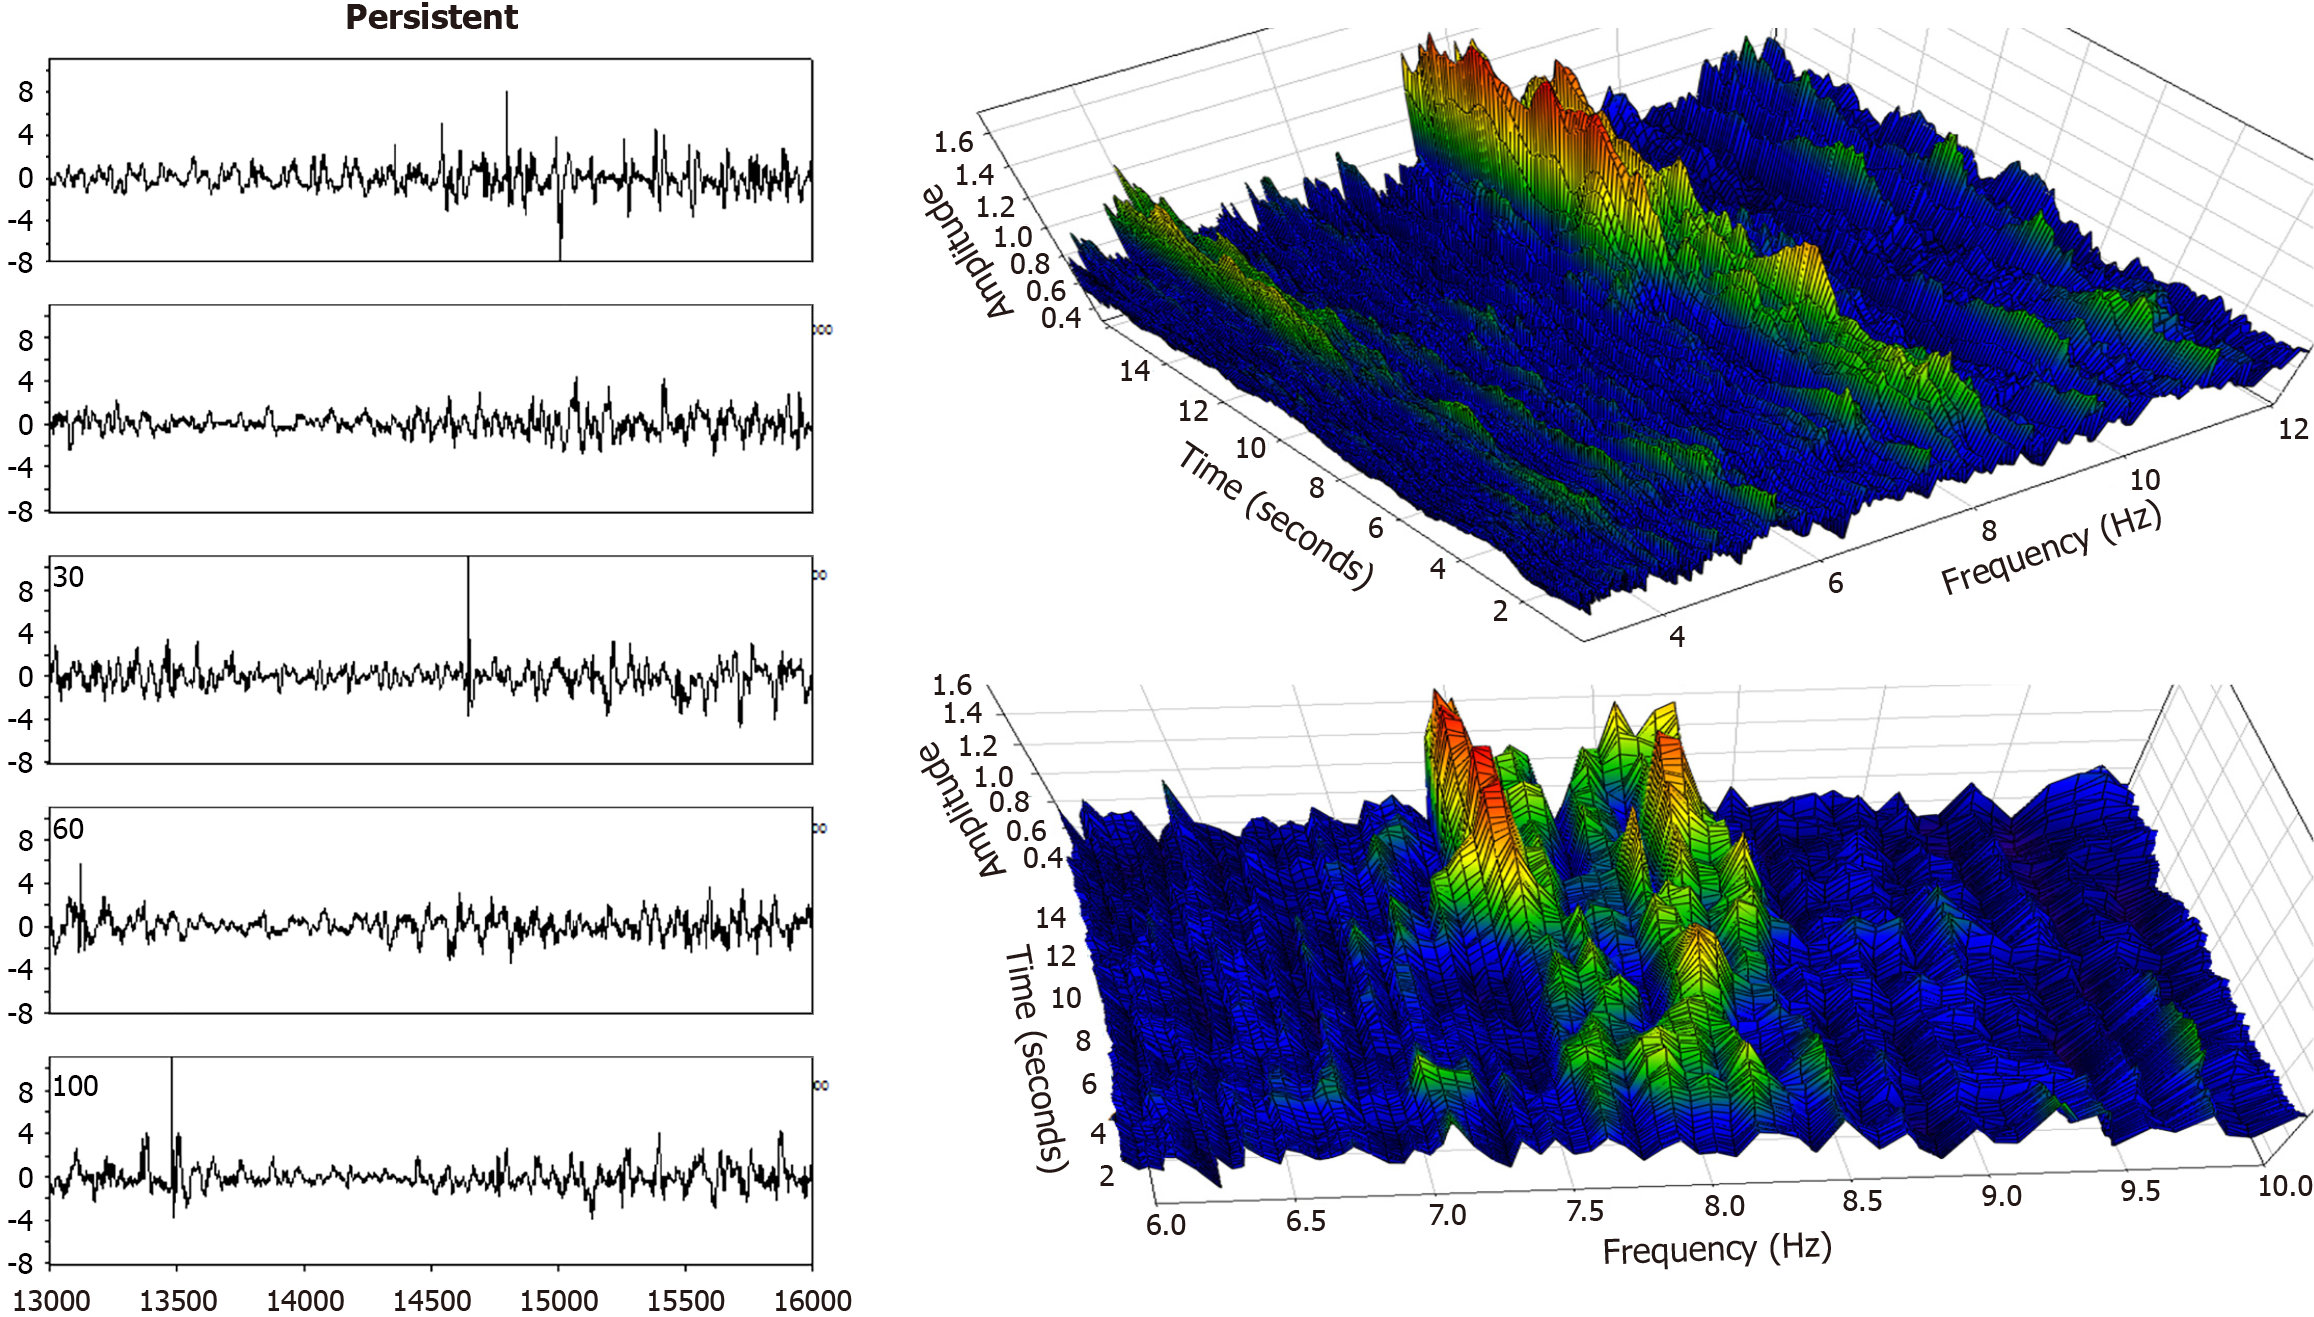
Figure 6 Left panel: An atrial fibrillation electrogram, posterior free wall, taken from the same persistent atrial fibrillation patient as in Figure 5.
Here the signal amplitude is more vacillating (left panel) vs Figure 5, and this translates into a more changeable spectral magnitude (maximum amplitude or color, right panels). As is evident in the lower frequency graph, there is less organization at signal onset (first 8 seconds) with only a low power dominant frequency (green and some yellow color above the blue background). During the latter half of the interval, however, two apparently competing dominant frequencies arise and form large spectral components (red and orange colors).
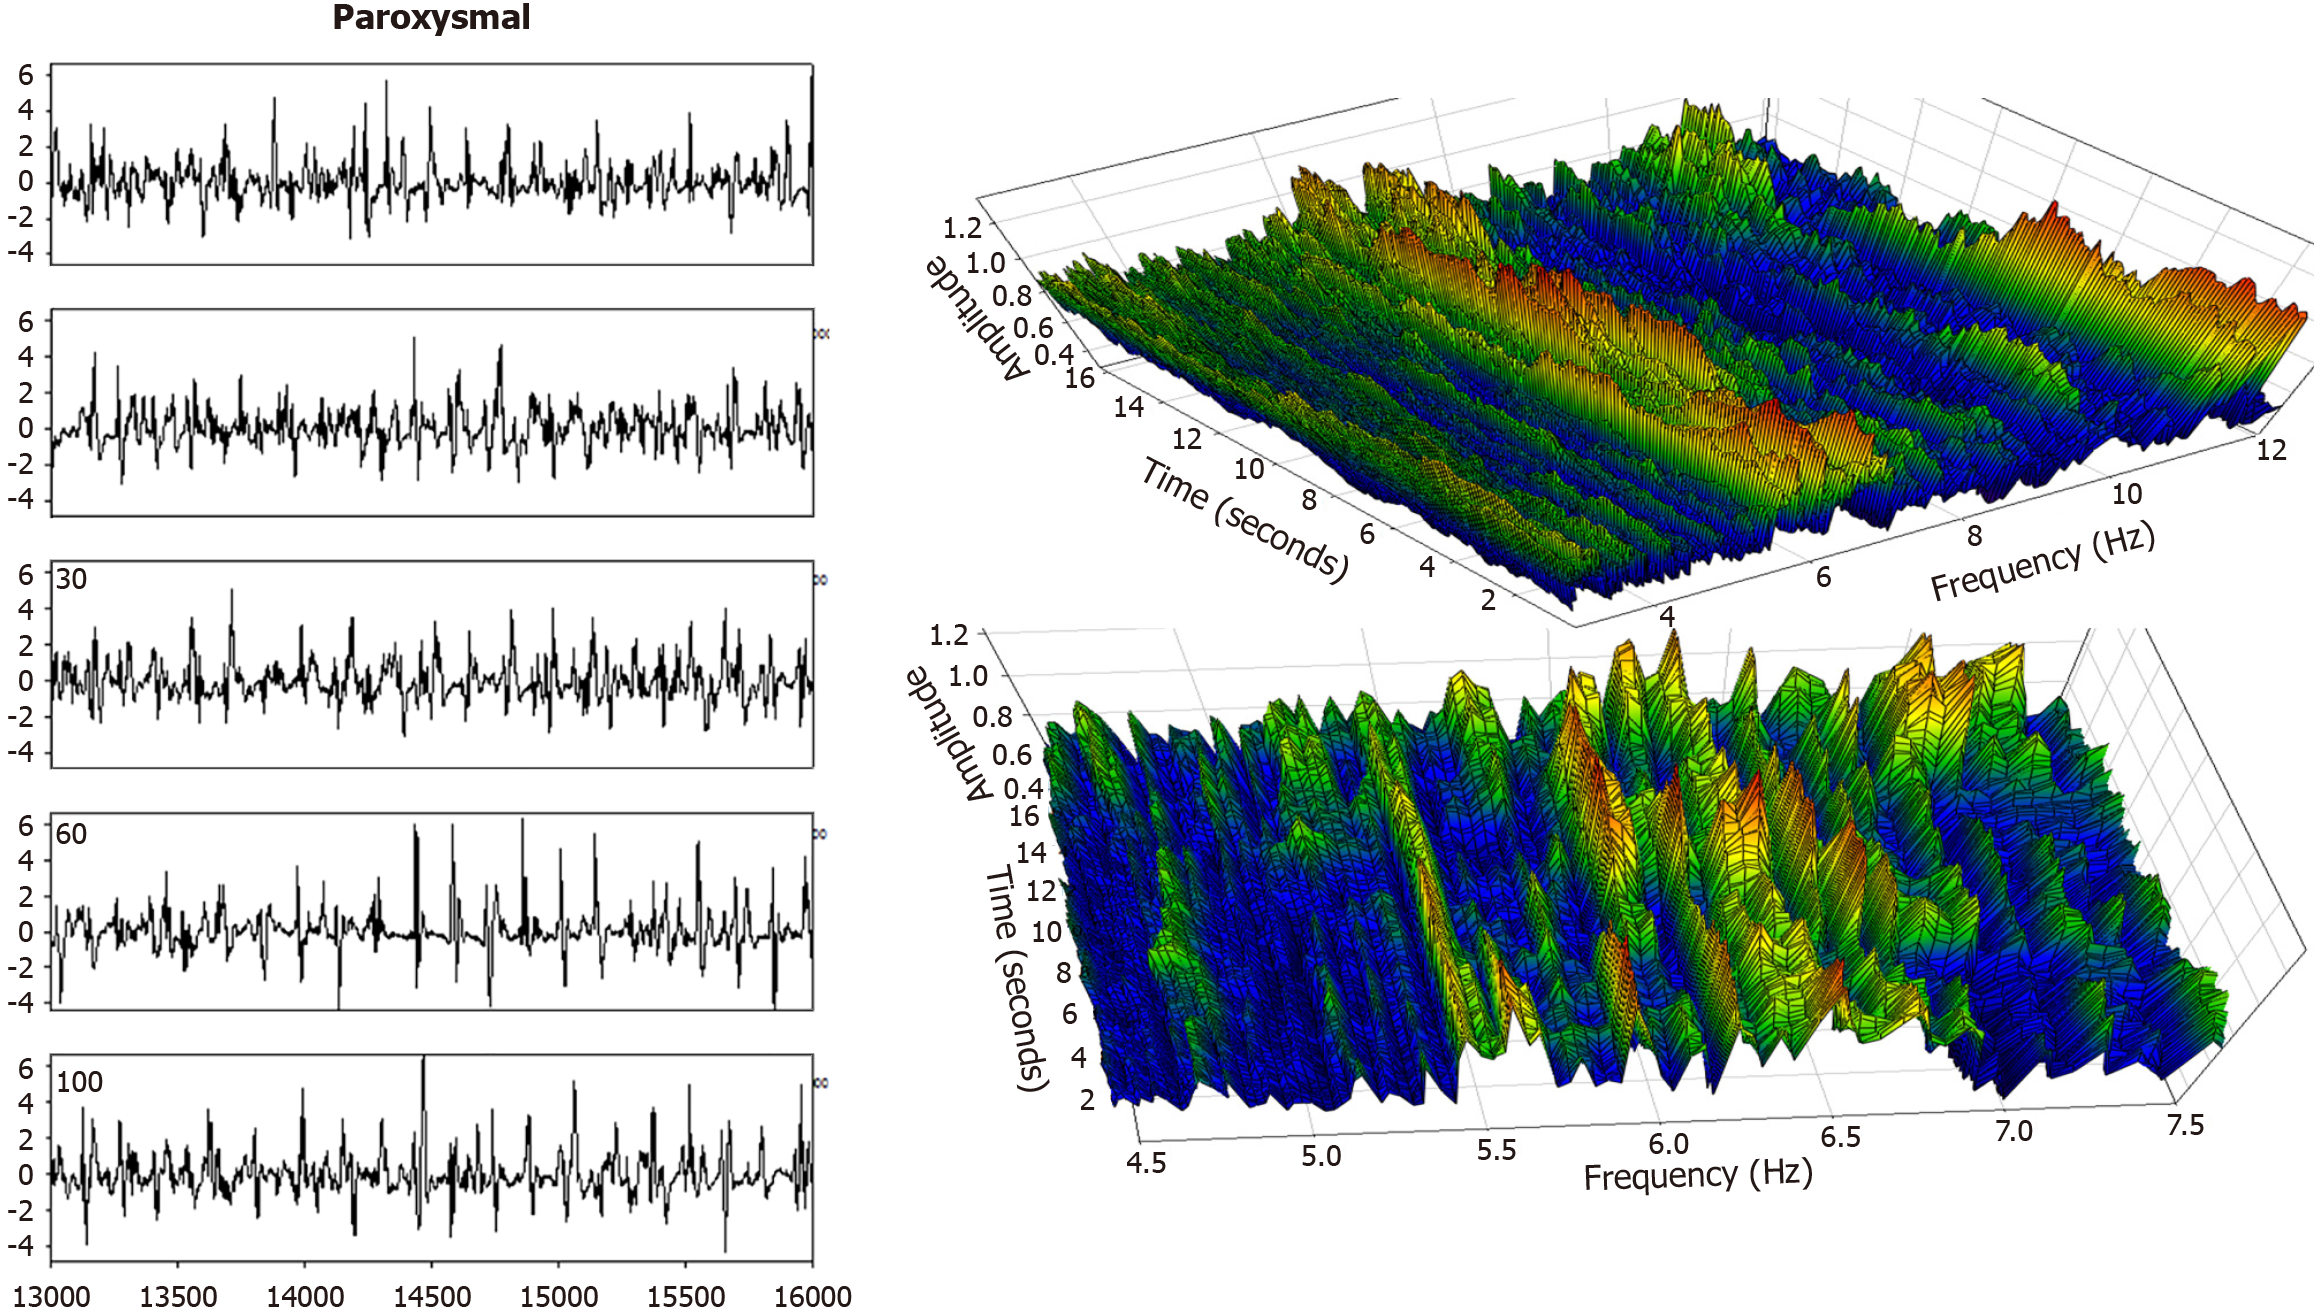
Figure 7 Paroxysmal atrial fibrillation patient data.
To the left is the sequence of successive intervals from a left atrial recording during atrial fibrillation, anterior free wall. The deflections appear to be more randomized (variable deflection shape, duration, and interval between deflections), as compared with those from the persistent AF patient, Figures 5 and 6. Indeed, a more randomized frequency spectrum is evident in the right panels. The dominant frequency (DF) in this case ranges from about 6–6.5 Hz. Thus, it is fluctuating in frequency over time. Furthermore, the DF magnitude or amplitude is quite variable even over short time intervals, particularly evident in the zoom-in lower frequency graph.
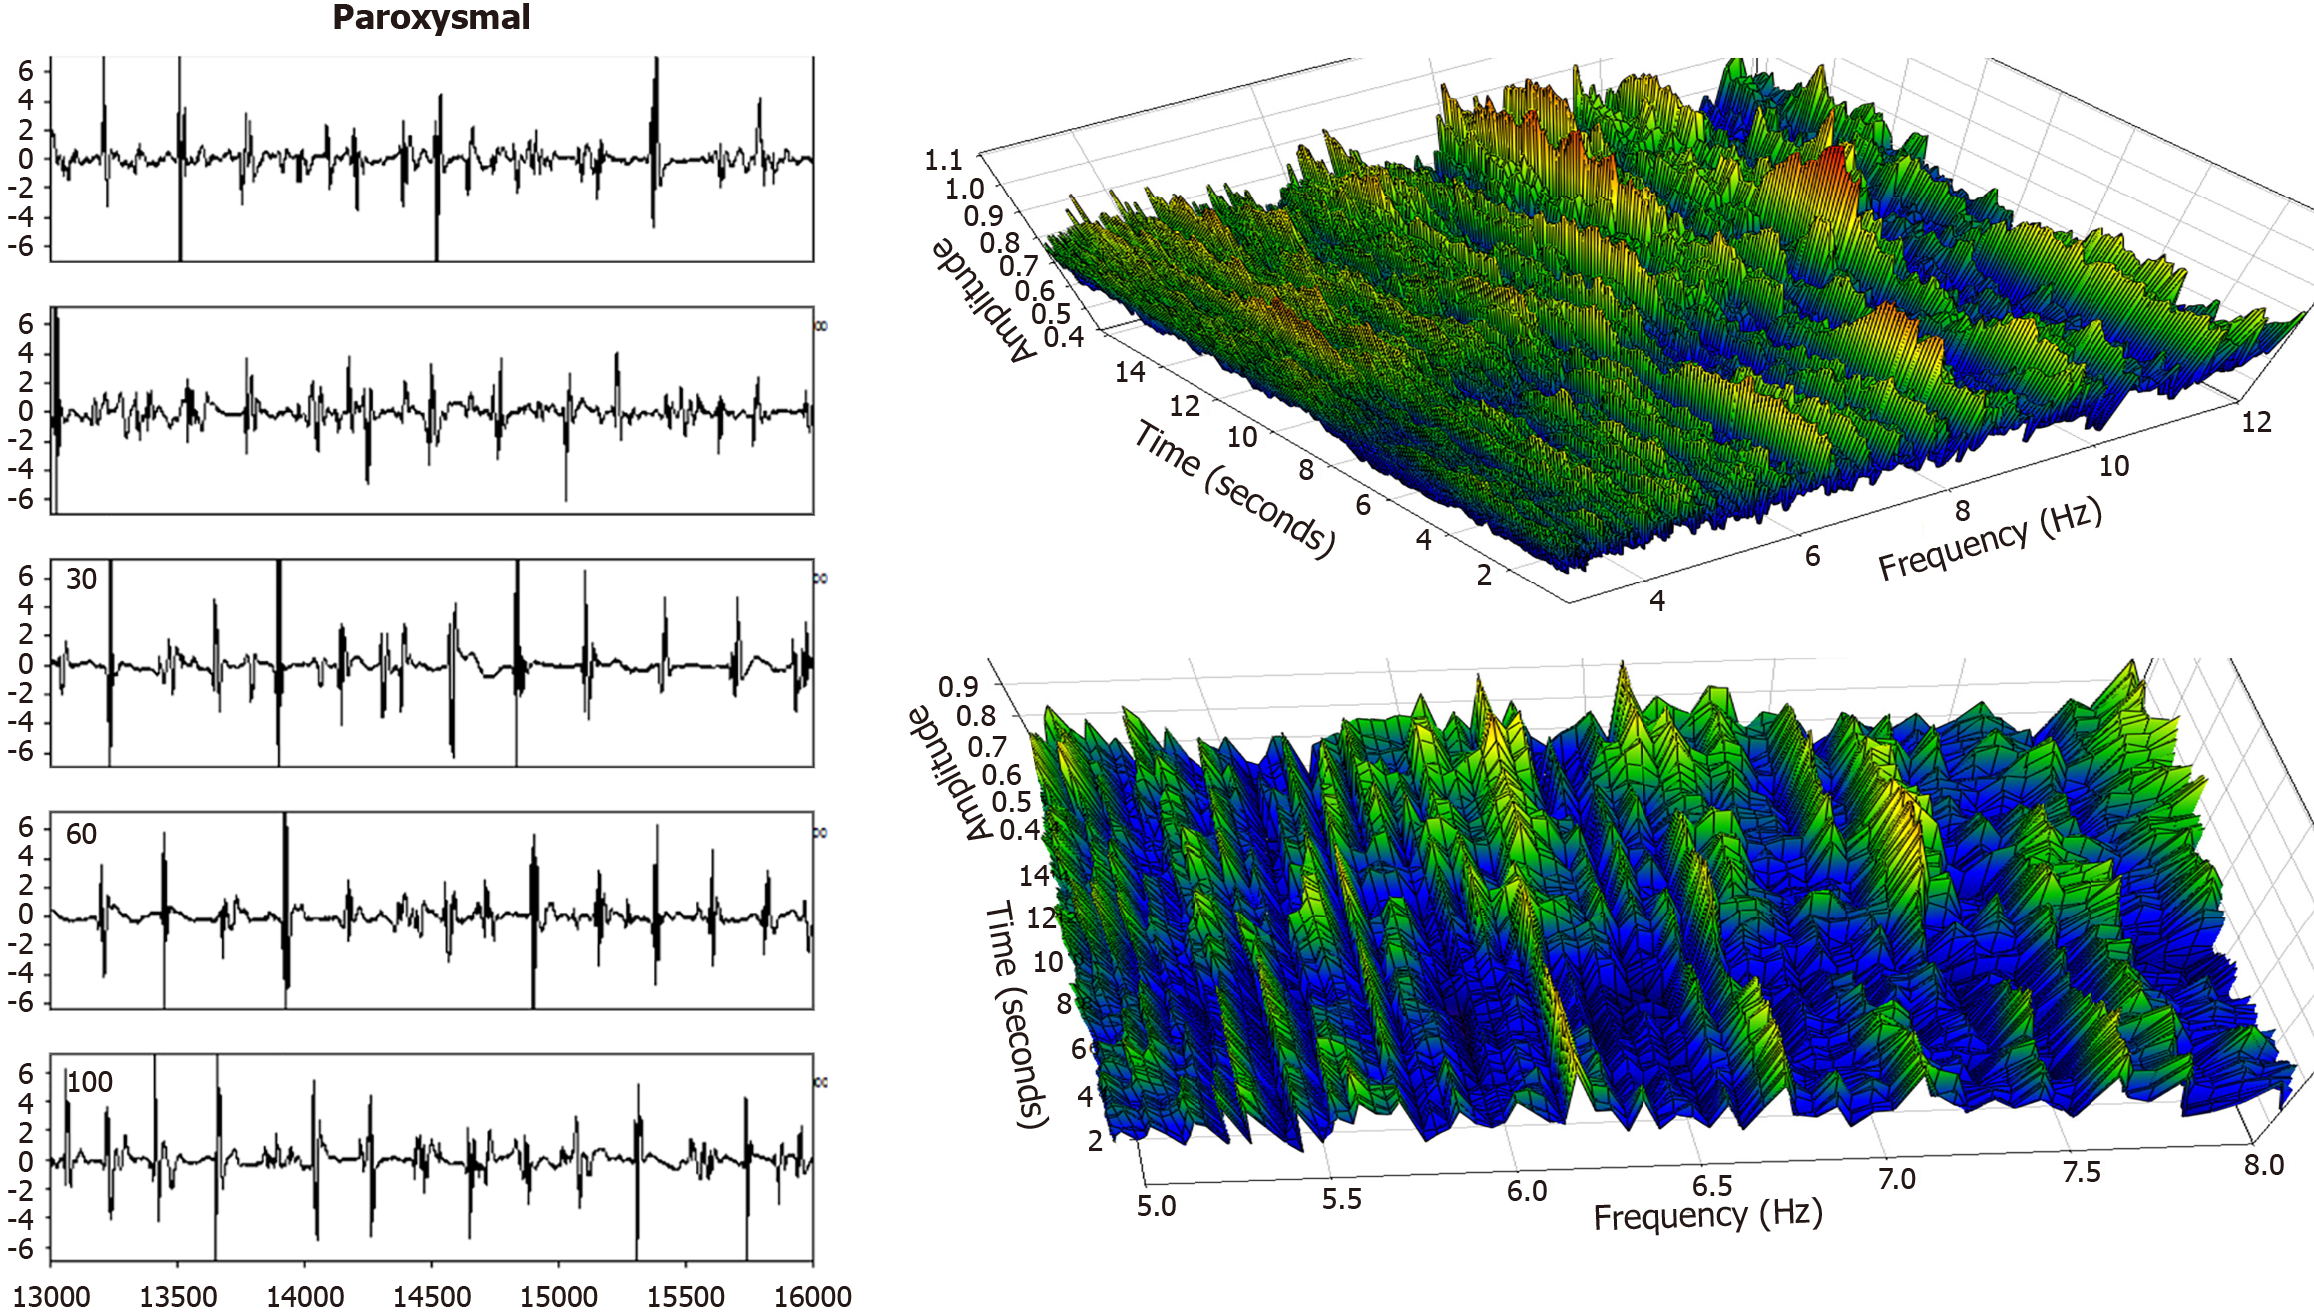
Figure 8 In this bipolar signal recording from the same paroxysmal atrial fibrillation patient, posterior free wall, there are longer isoelectric intervals between time series activation deflections (left panel) with irregular morphology.
Yet, this substrate may be more organized in the sense of activating more or less simultaneously, though it is less organized in the sense of variability in the deflection morphology and timing of each of these activation events. Overall, it results in the frequency spectrum (right panels) being composed of mostly low-power areas, and very little constancy in the dominant frequency (use of clinical data and its analysis for construction of the Figures 1, 2, 3, 4, 5, 6, 7 and 8 contained herein was approved by the Institutional Review Board of Columbia University Irving Medical Center).
- Citation: Ciaccio EJ, Hsia HH, Yarmohammadi H, Wan EY, Peters NS, Saluja D, Biviano AB. Atrial fibrillation substrate mapping with emphasis on voltage-based guidance. World J Cardiol 2025; 17(11): 109739
- URL: https://www.wjgnet.com/1949-8462/full/v17/i11/109739.htm
- DOI: https://dx.doi.org/10.4330/wjc.v17.i11.109739


