Copyright
©The Author(s) 2025.
World J Cardiol. Oct 26, 2025; 17(10): 112001
Published online Oct 26, 2025. doi: 10.4330/wjc.v17.i10.112001
Published online Oct 26, 2025. doi: 10.4330/wjc.v17.i10.112001
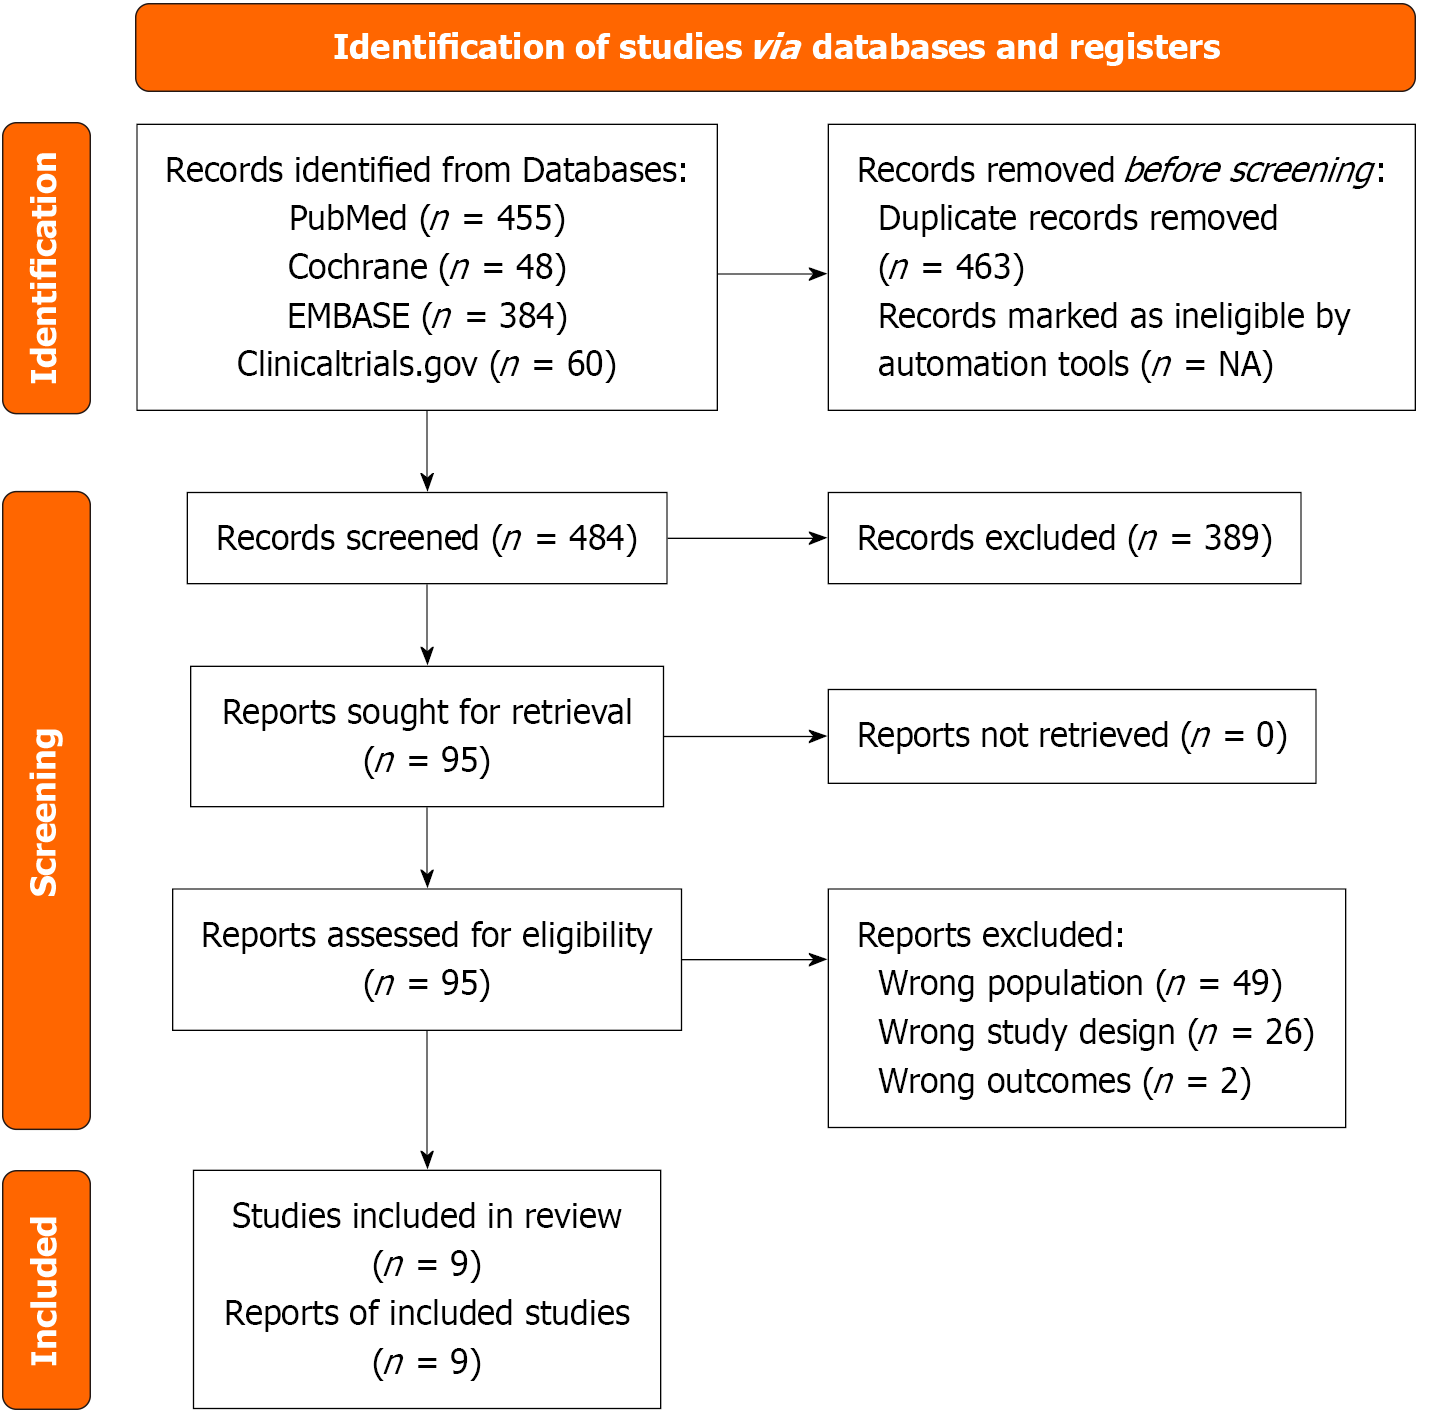
Figure 1
Preferred Reporting Items for Systematic Reviews and Meta-Analysis flowchart for literature search.
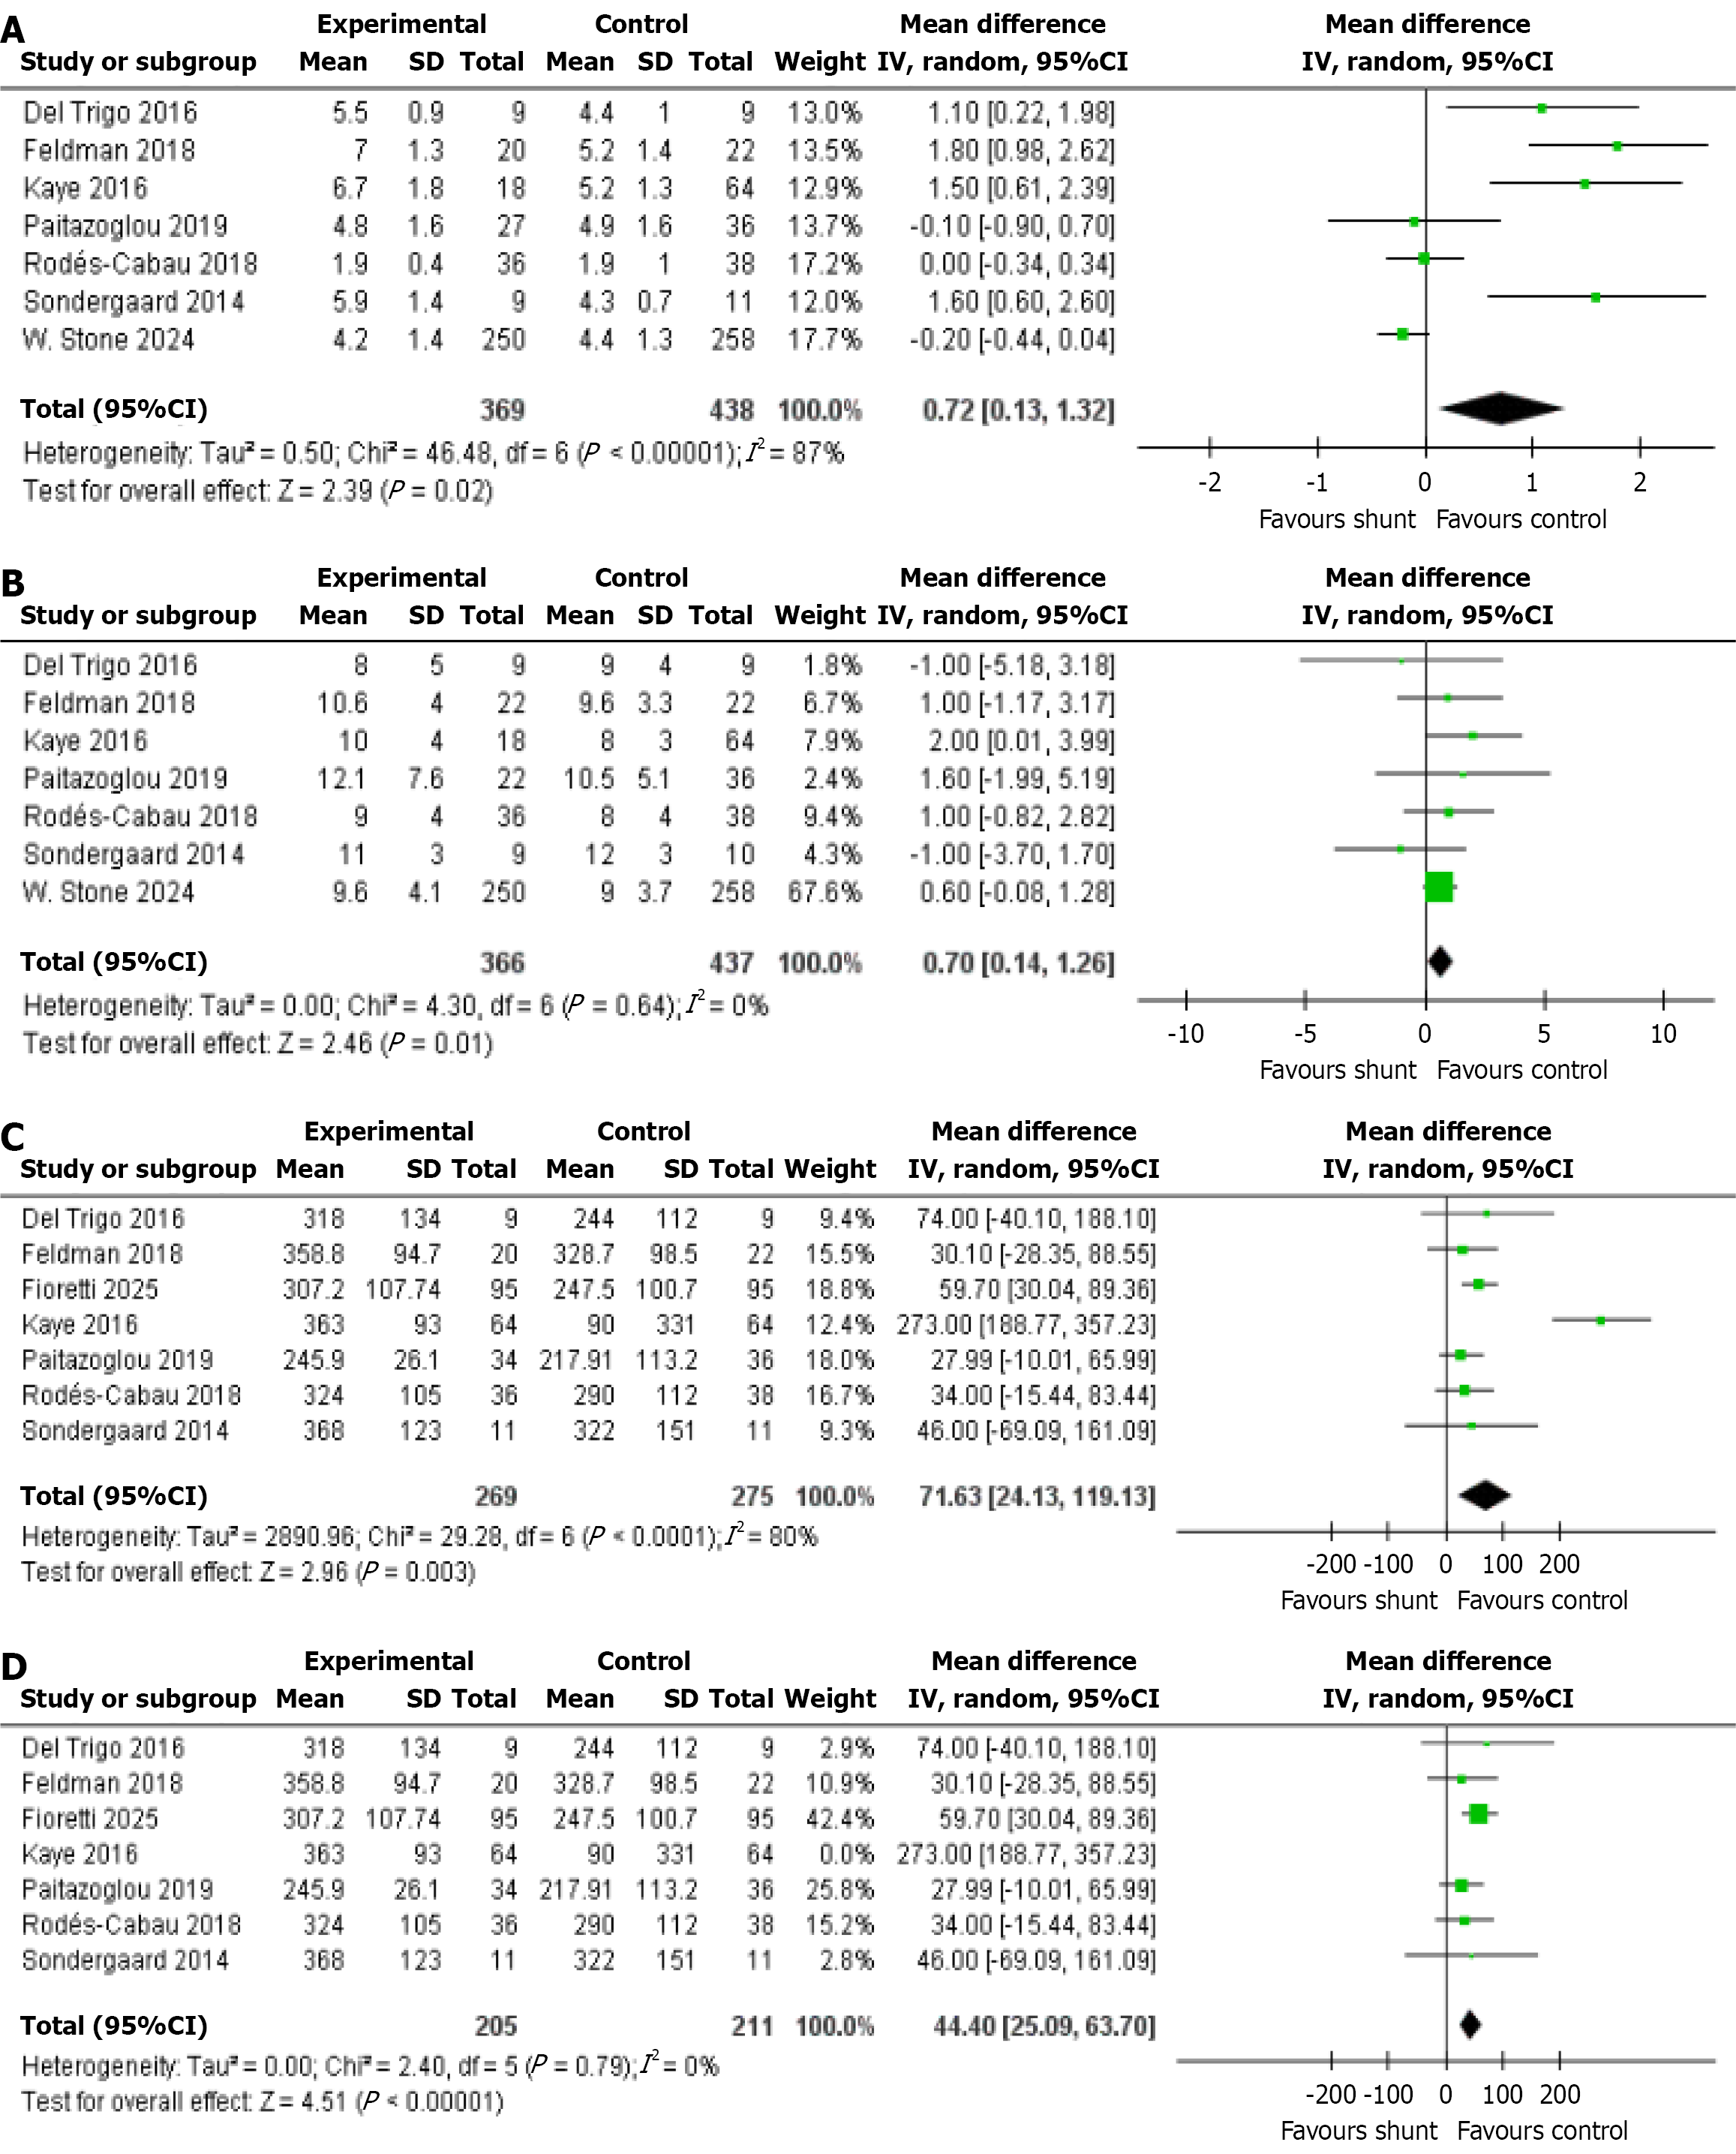
Figure 2 Forest plots for cardiac function and exercise capacity.
A: Cardiac output; B: Right atrial pressure; C: 6-minute walk distance (6MWD); D: 6MWD leave-one-out analysis.
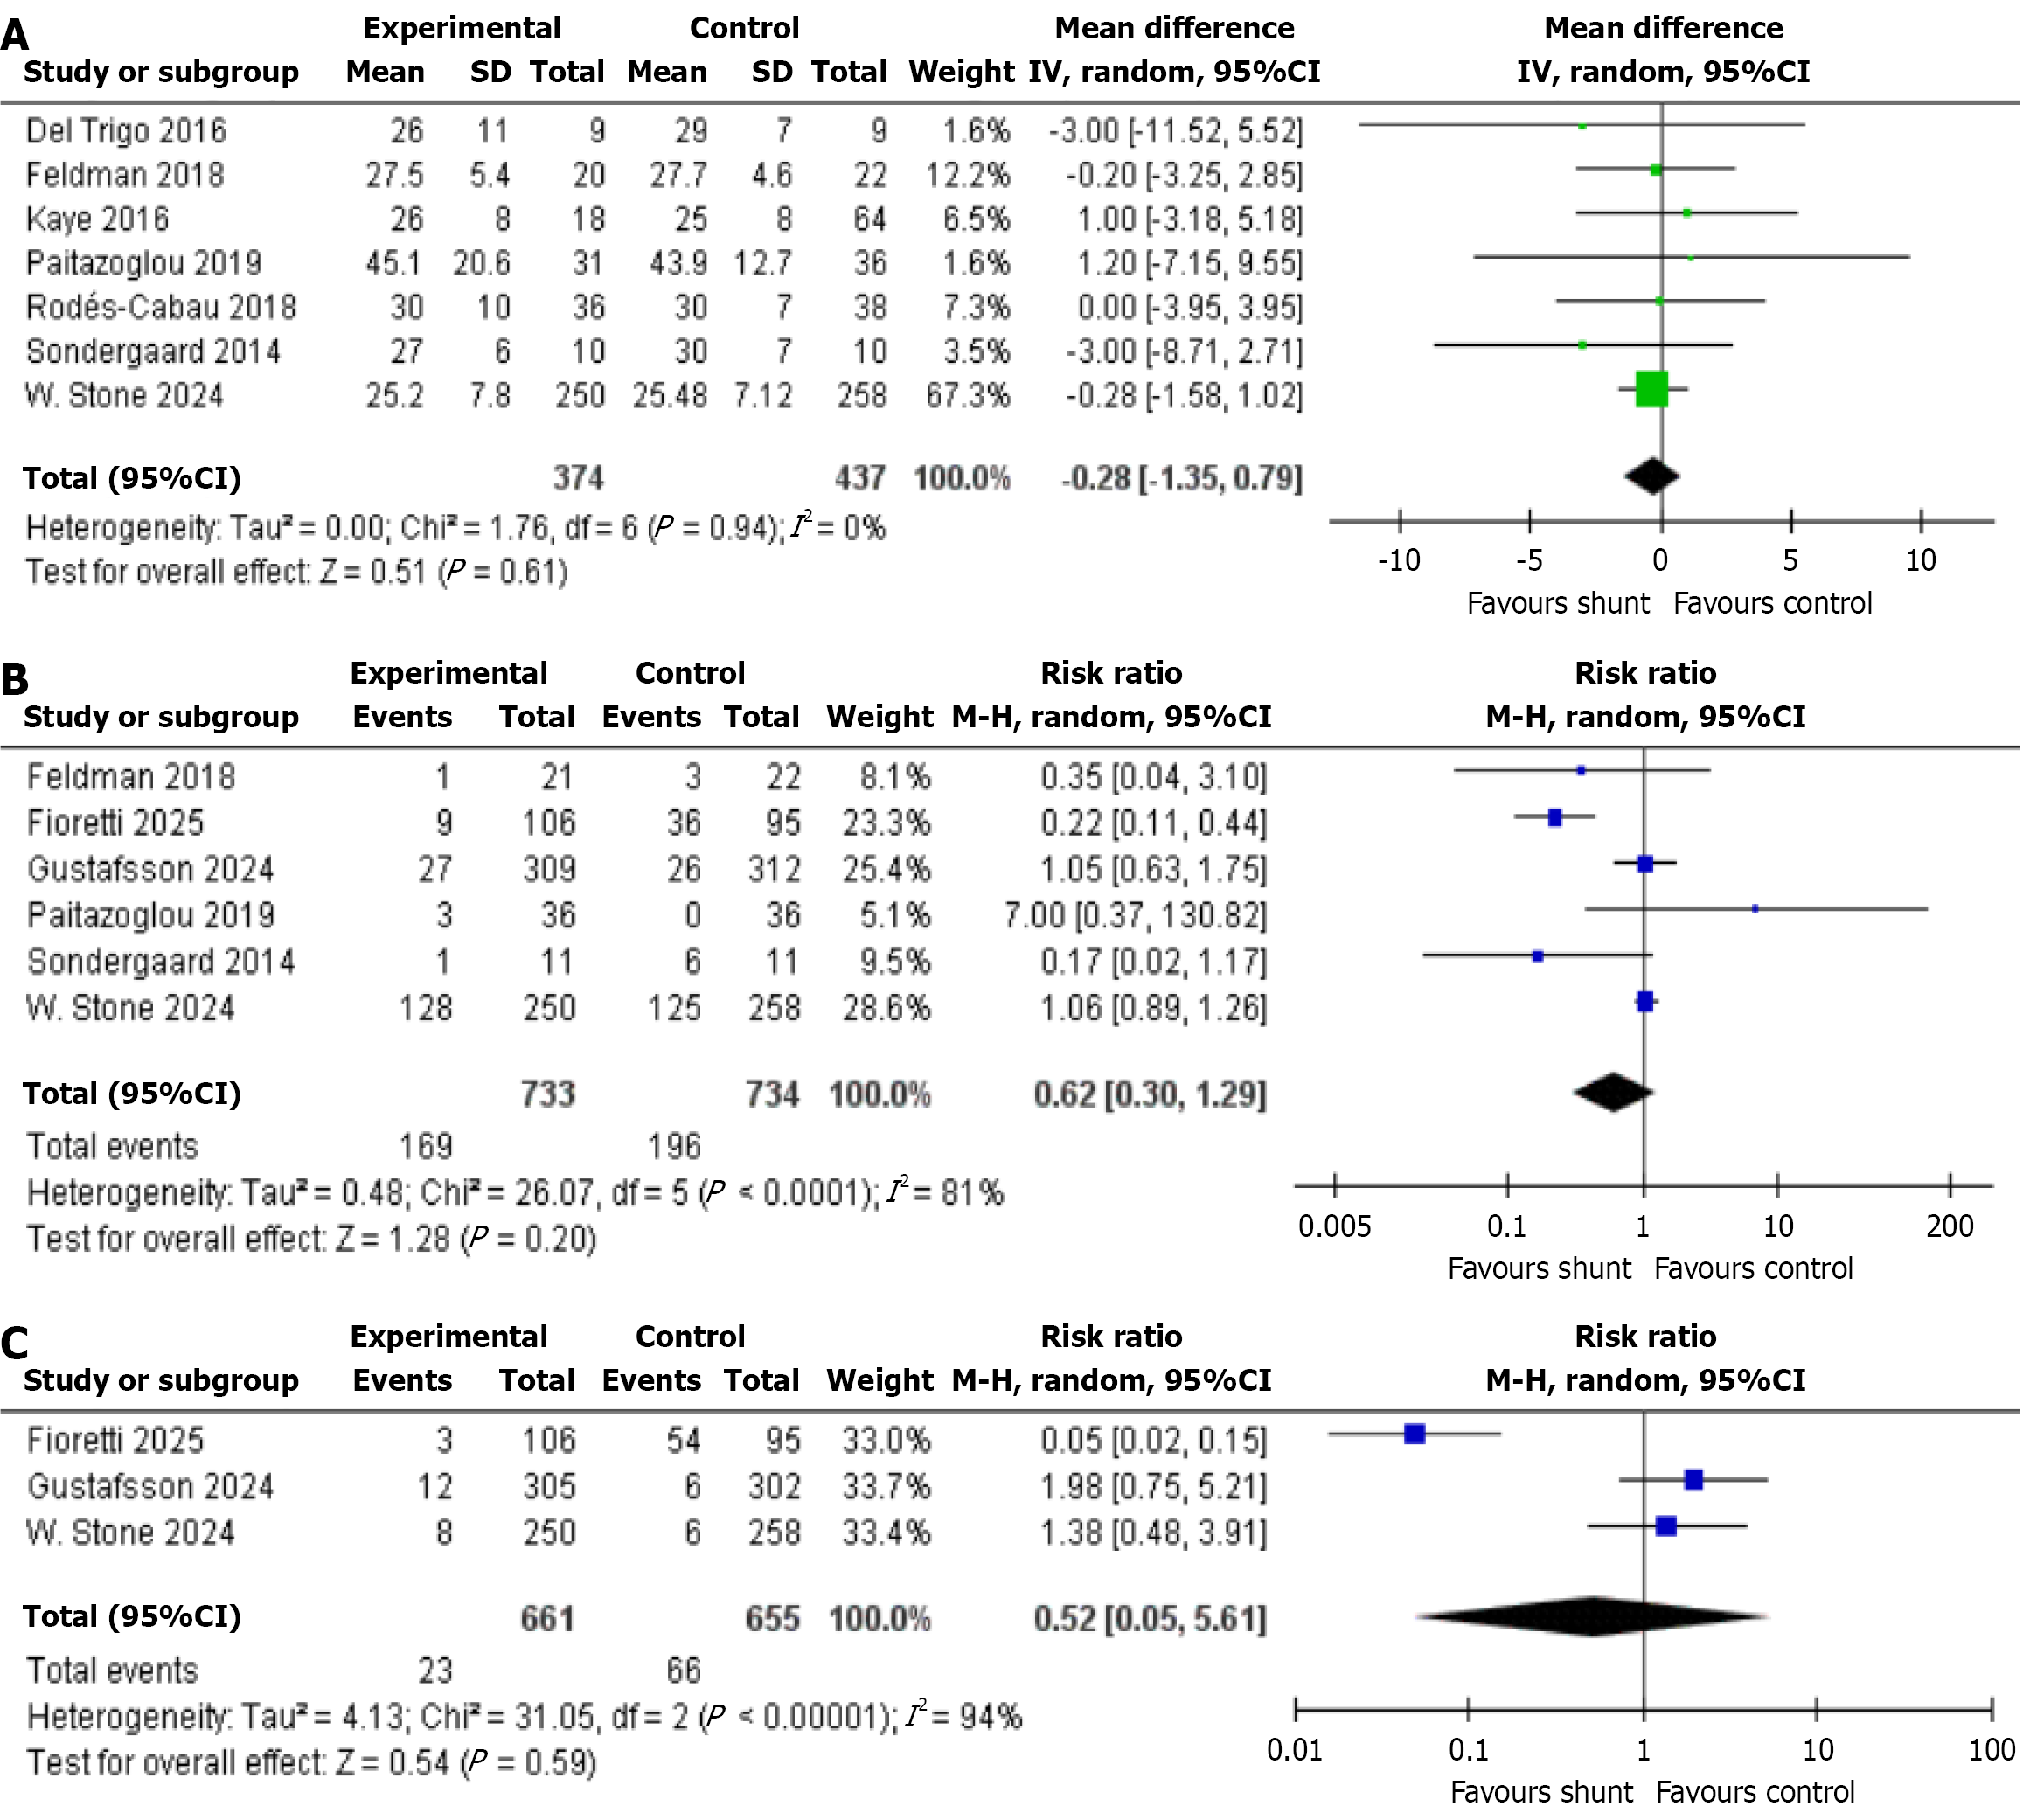
Figure 3 Forest plots for pulmonary pressure and heart failure outcomes.
A: Mean pulmonary artery pressure; B: All-cause heart failure events; C: Cardiac death.
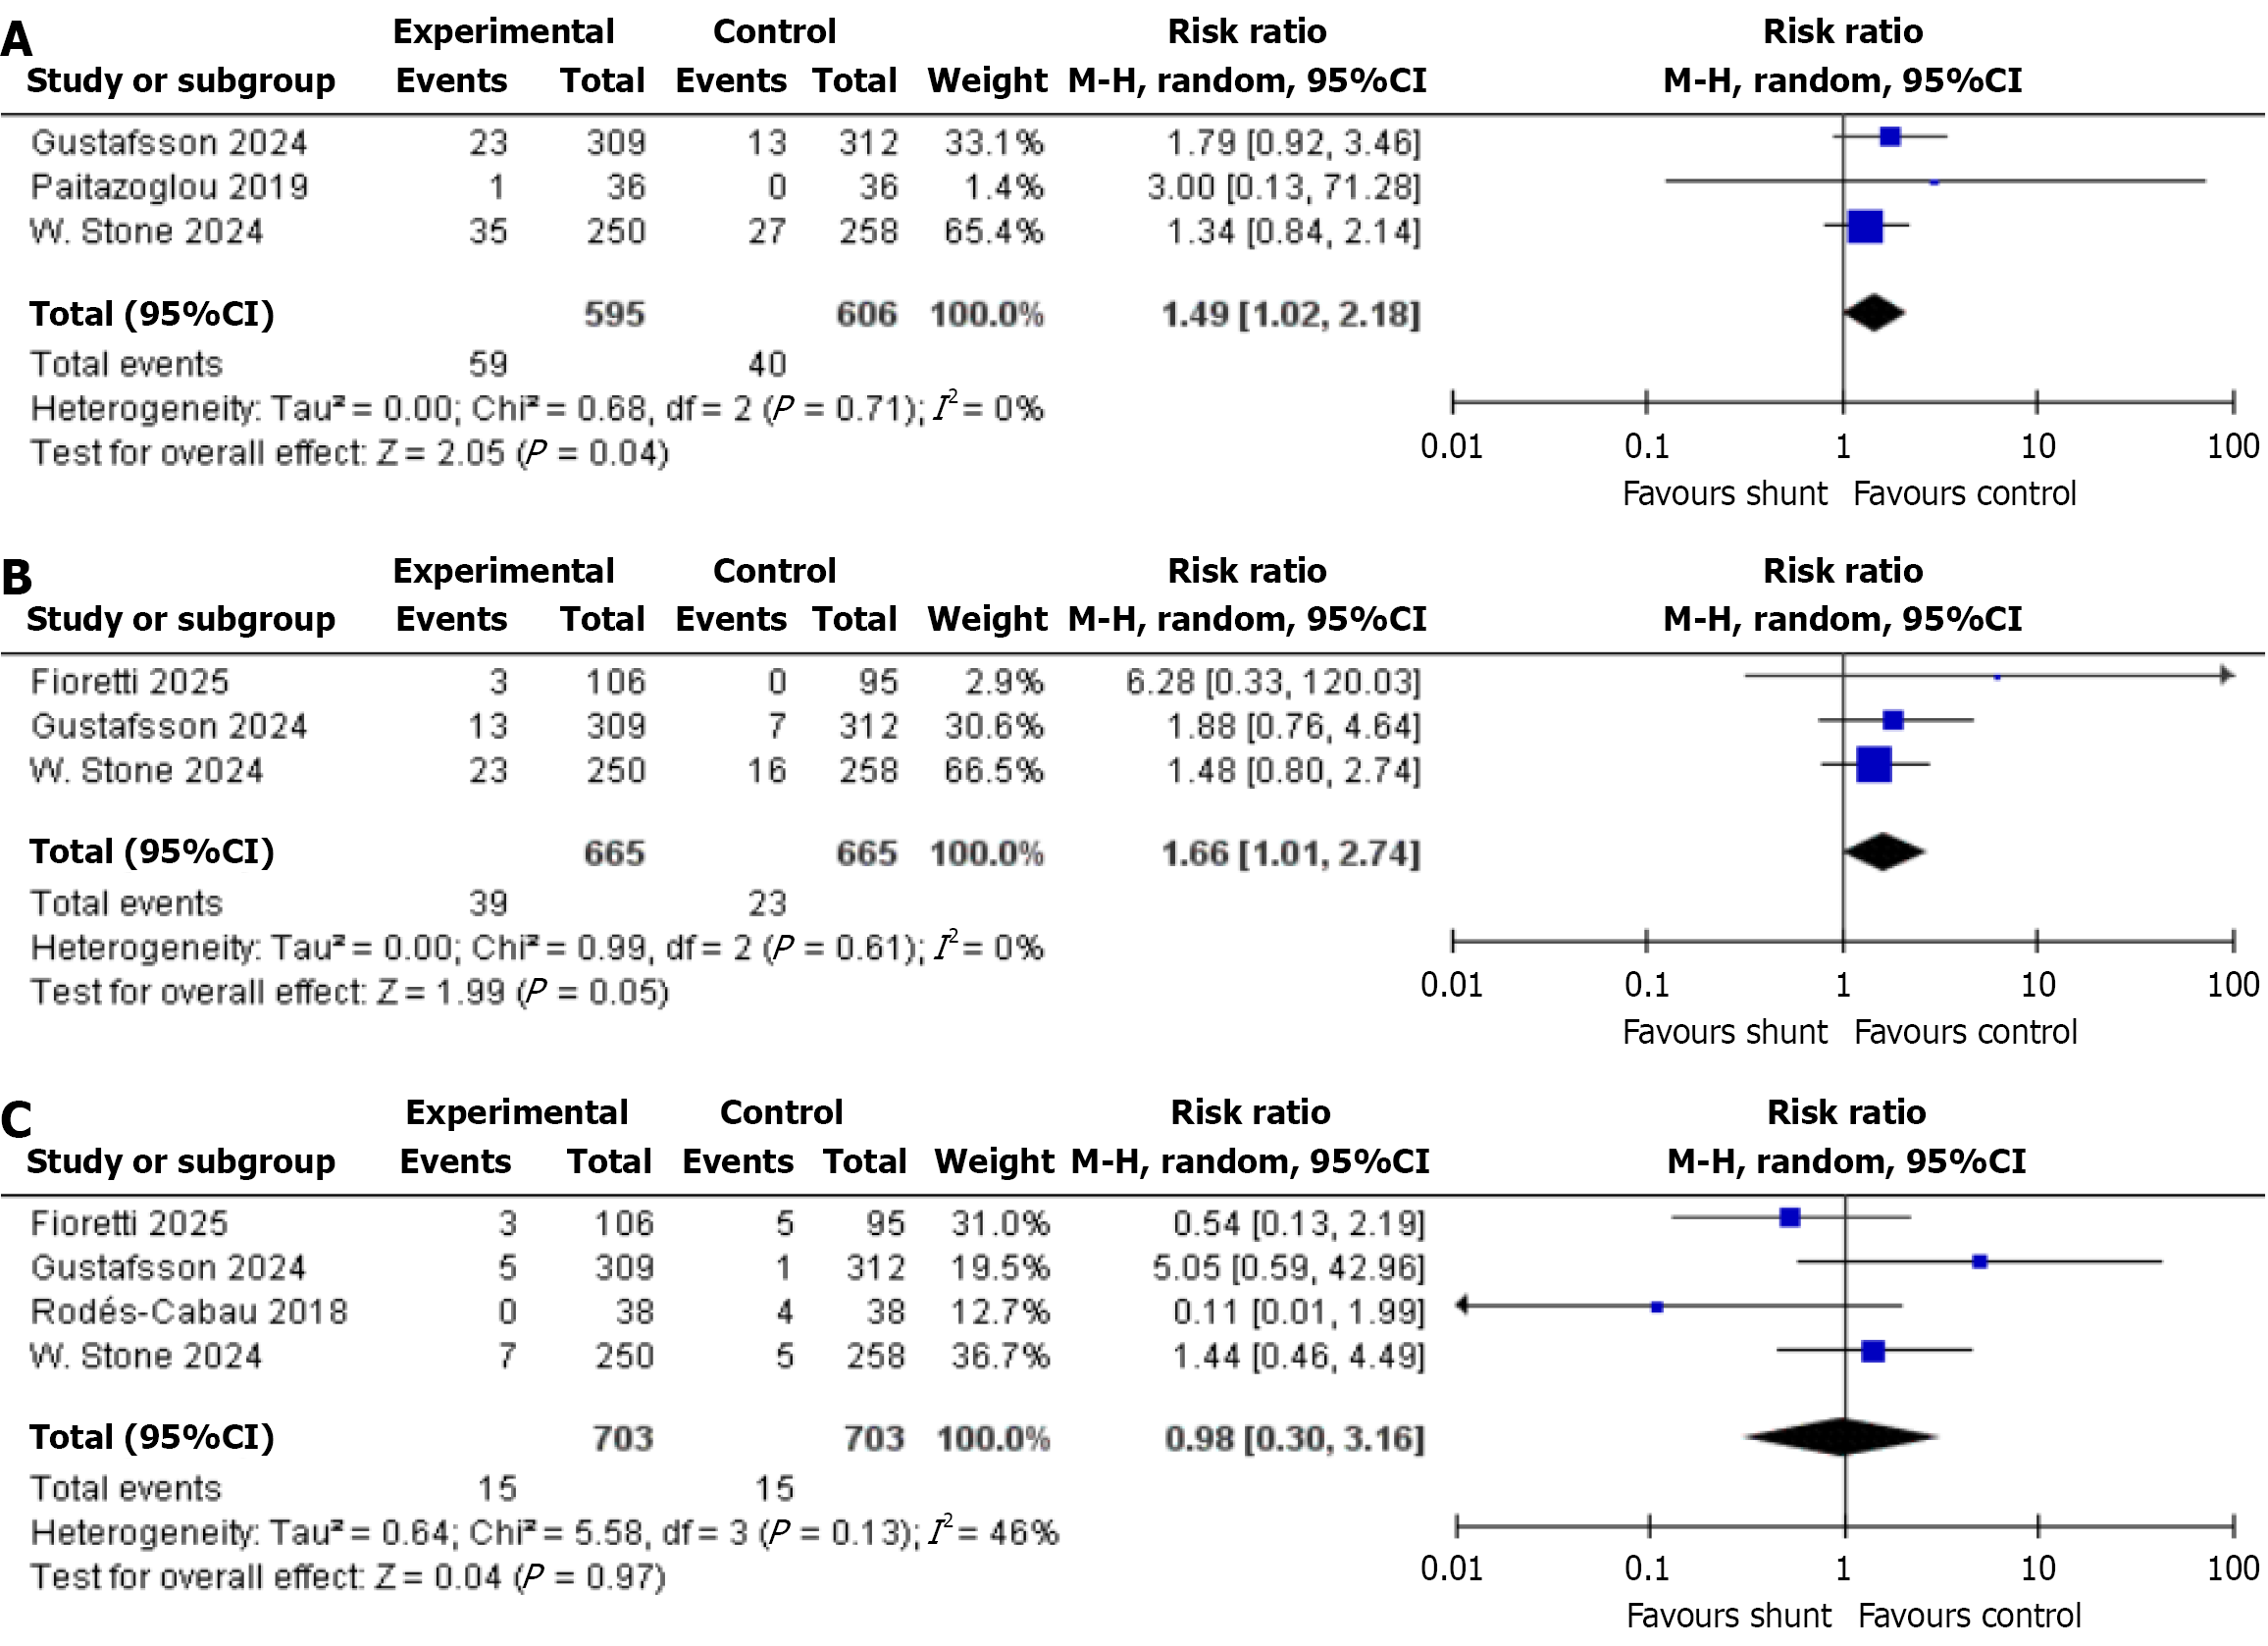
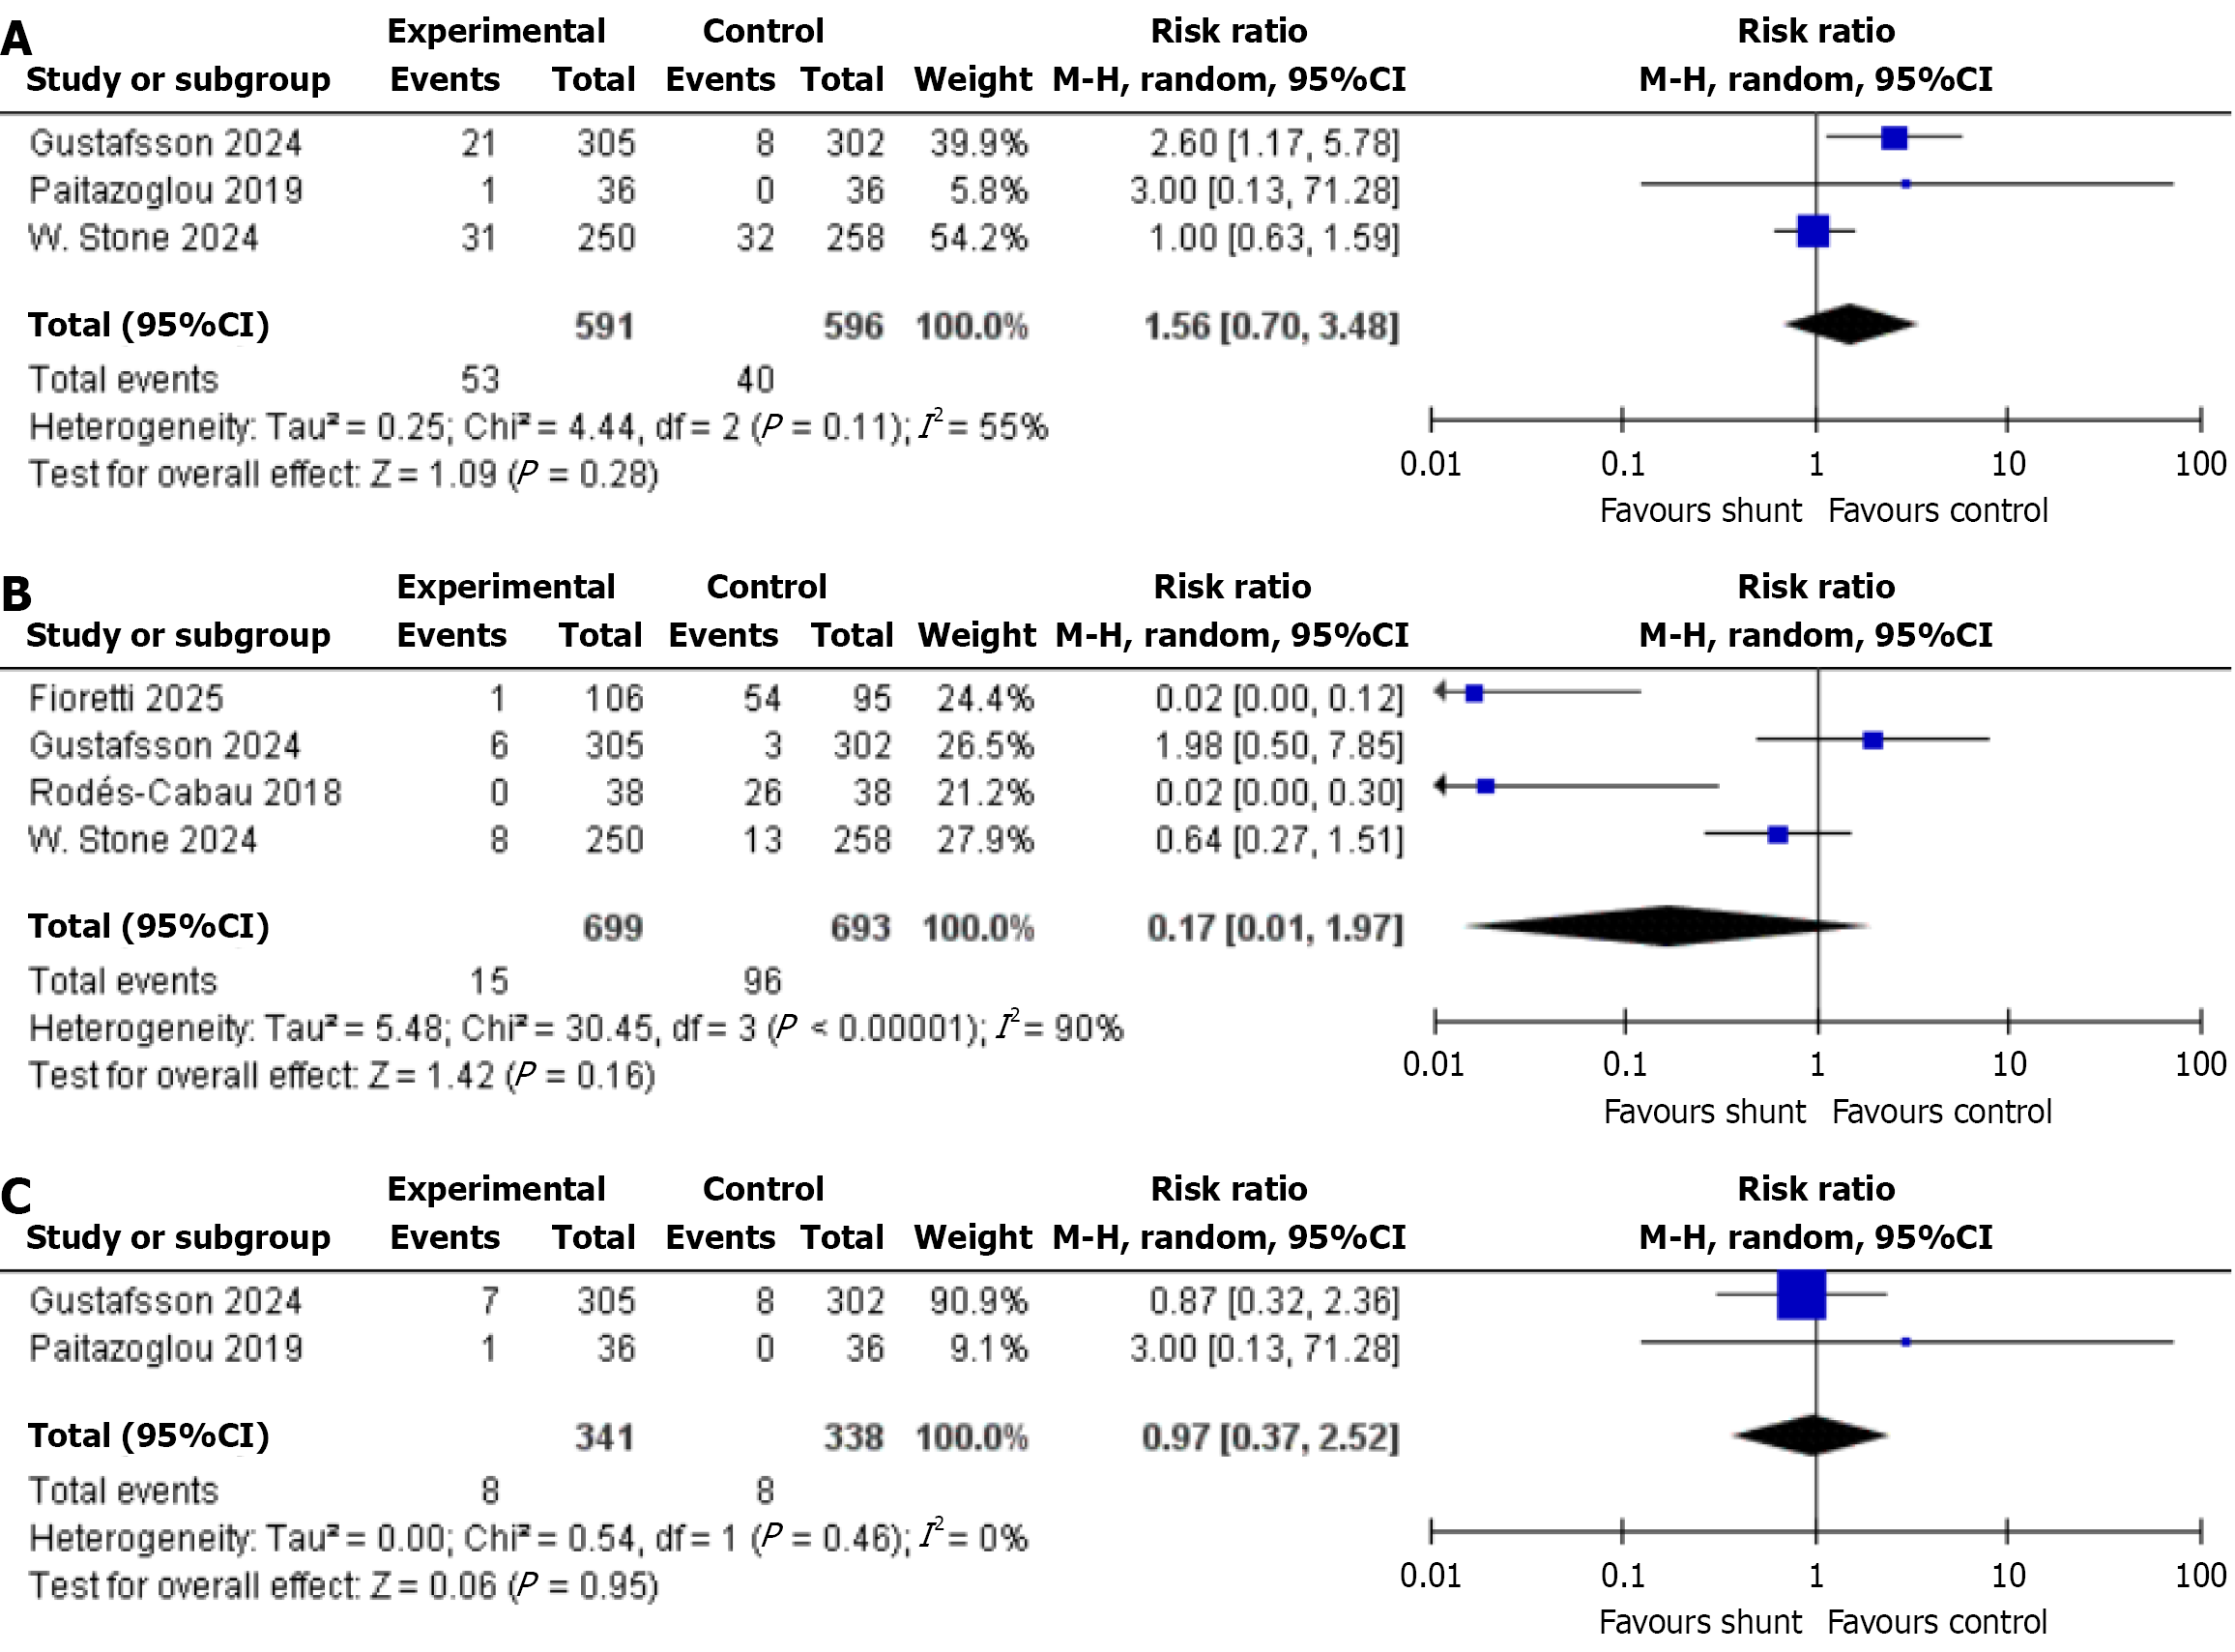
Figure 4 Forest plots for mortality and cerebrovascular outcomes.
A: All-cause mortality; B: Cardiovascular death; C: Ischemic stroke.
Figure 5 Forest plots for cardiovascular adverse events.
A: Major adverse cardiovascular events; B: Myocardial infarction; C: New-onset atrial fibrillation.
- Citation: Khan A, Rath S, Fatima N, Hayat U, Dawer P, Khan H, Ullah W, Ud Din Z, Sehar A, Hassan IN. Efficacy and safety of interatrial shunt treatment for heart failure: A systematic review and meta-analysis. World J Cardiol 2025; 17(10): 112001
- URL: https://www.wjgnet.com/1949-8462/full/v17/i10/112001.htm
- DOI: https://dx.doi.org/10.4330/wjc.v17.i10.112001


