©The Author(s) 2020.
World J Cardiol. Jun 26, 2020; 12(6): 248-261
Published online Jun 26, 2020. doi: 10.4330/wjc.v12.i6.248
Published online Jun 26, 2020. doi: 10.4330/wjc.v12.i6.248
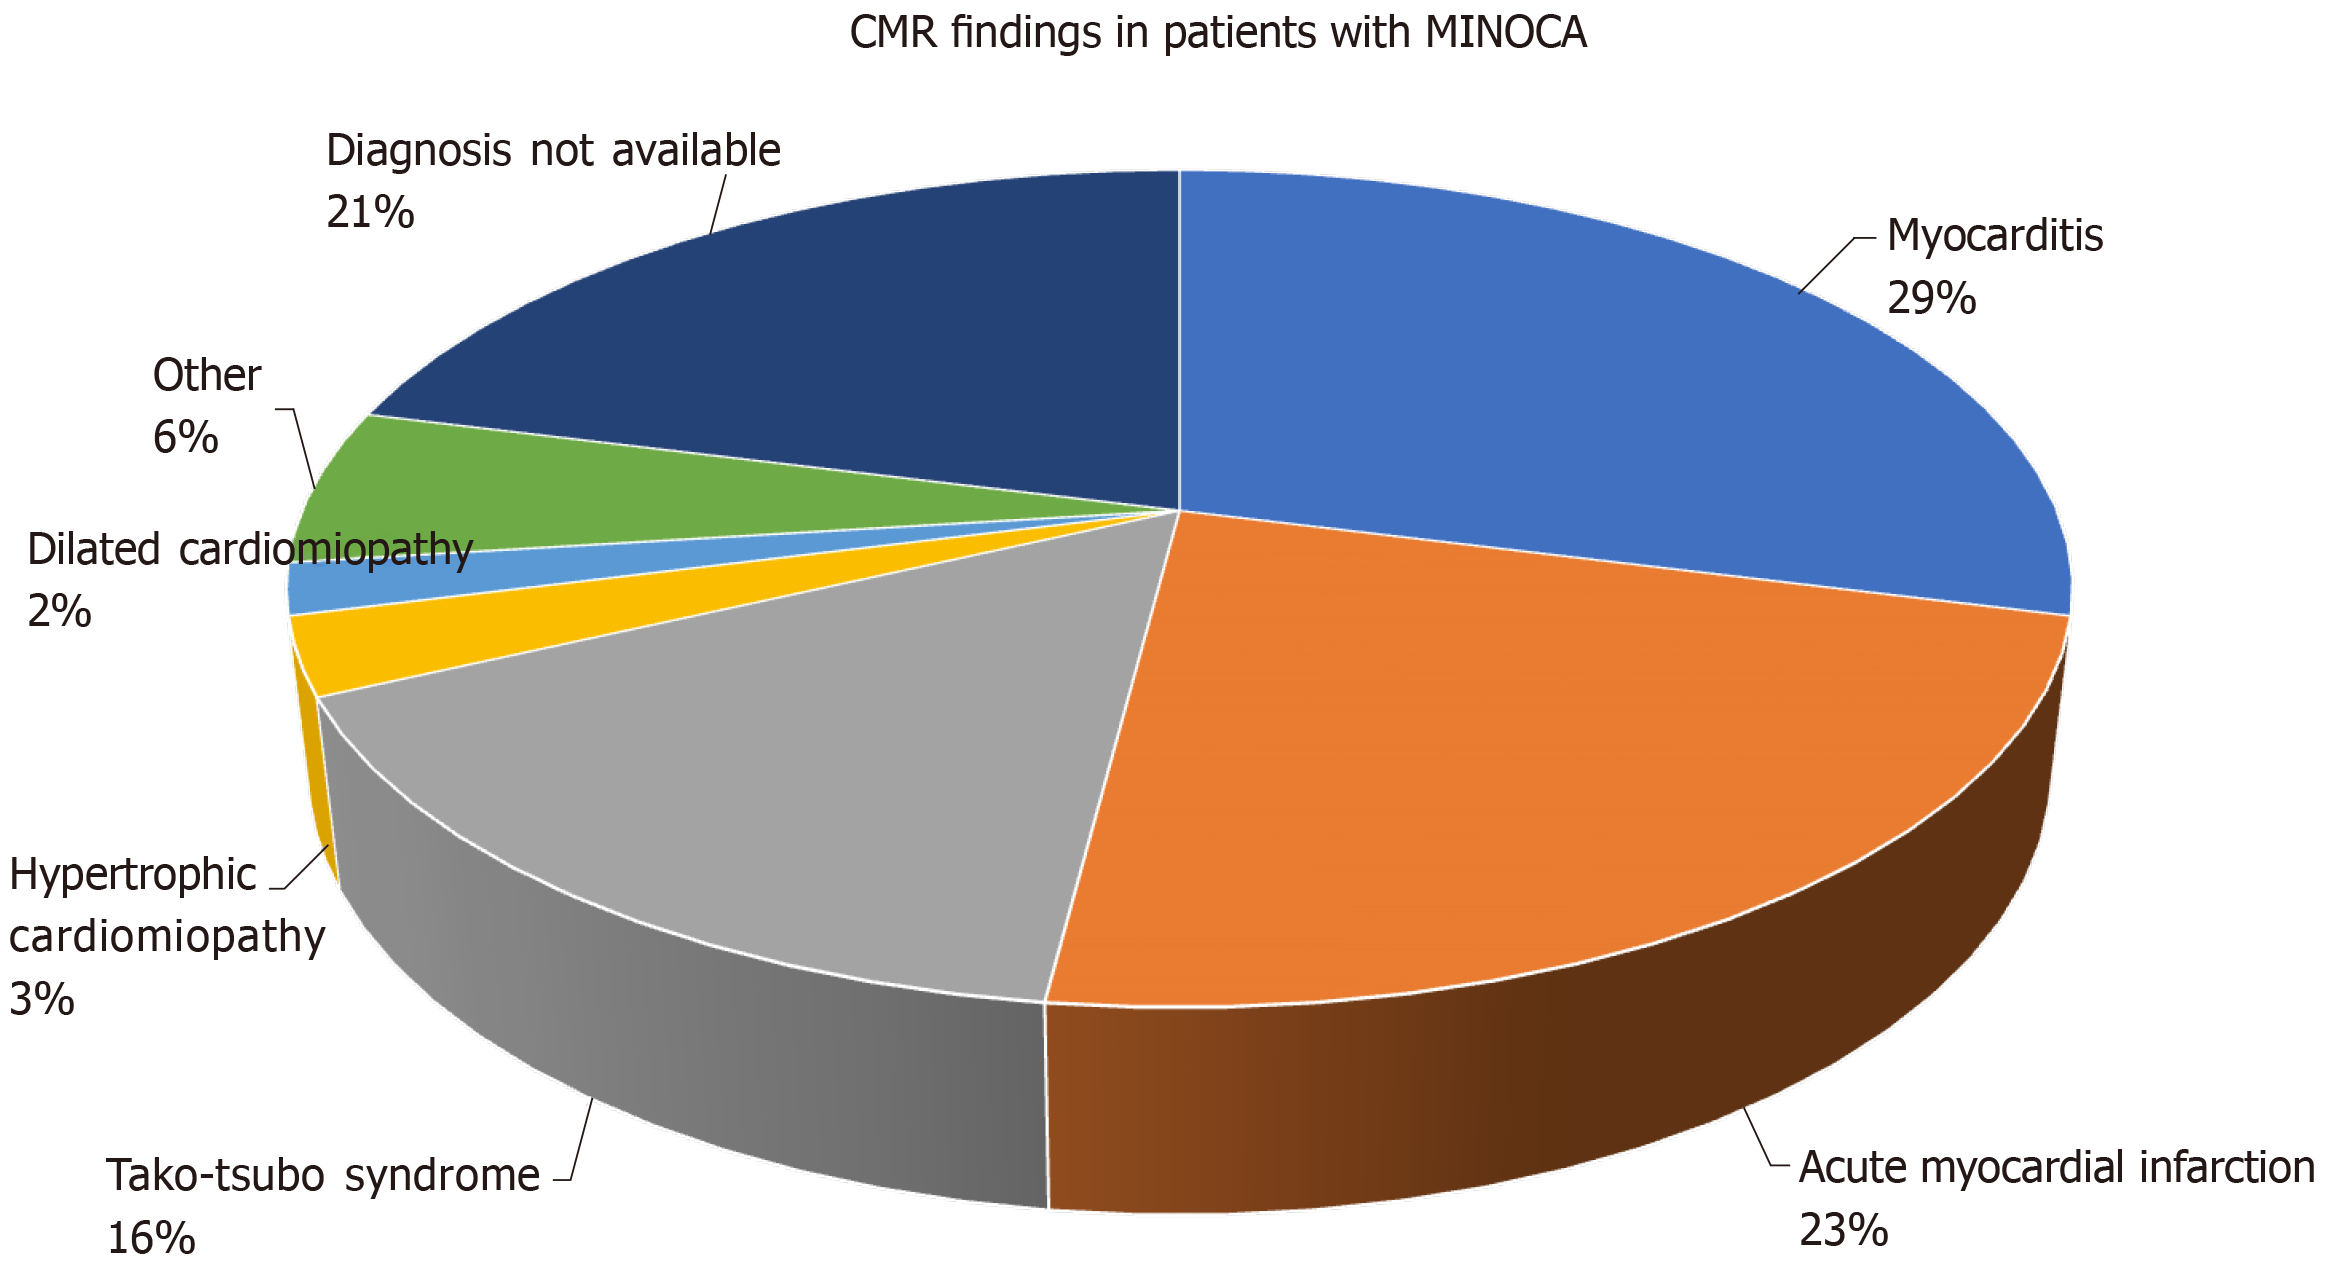
Figure 1 Cardiovascular magnetic resonance findings in patients with myocardial infarction with non-obstructive coronary arteries.
Adapted from Pasupathy S et al[13]. CMR: Cardiovascular magnetic resonance; MINOCA: Myocardial infarction with non-obstructive coronary arteries.
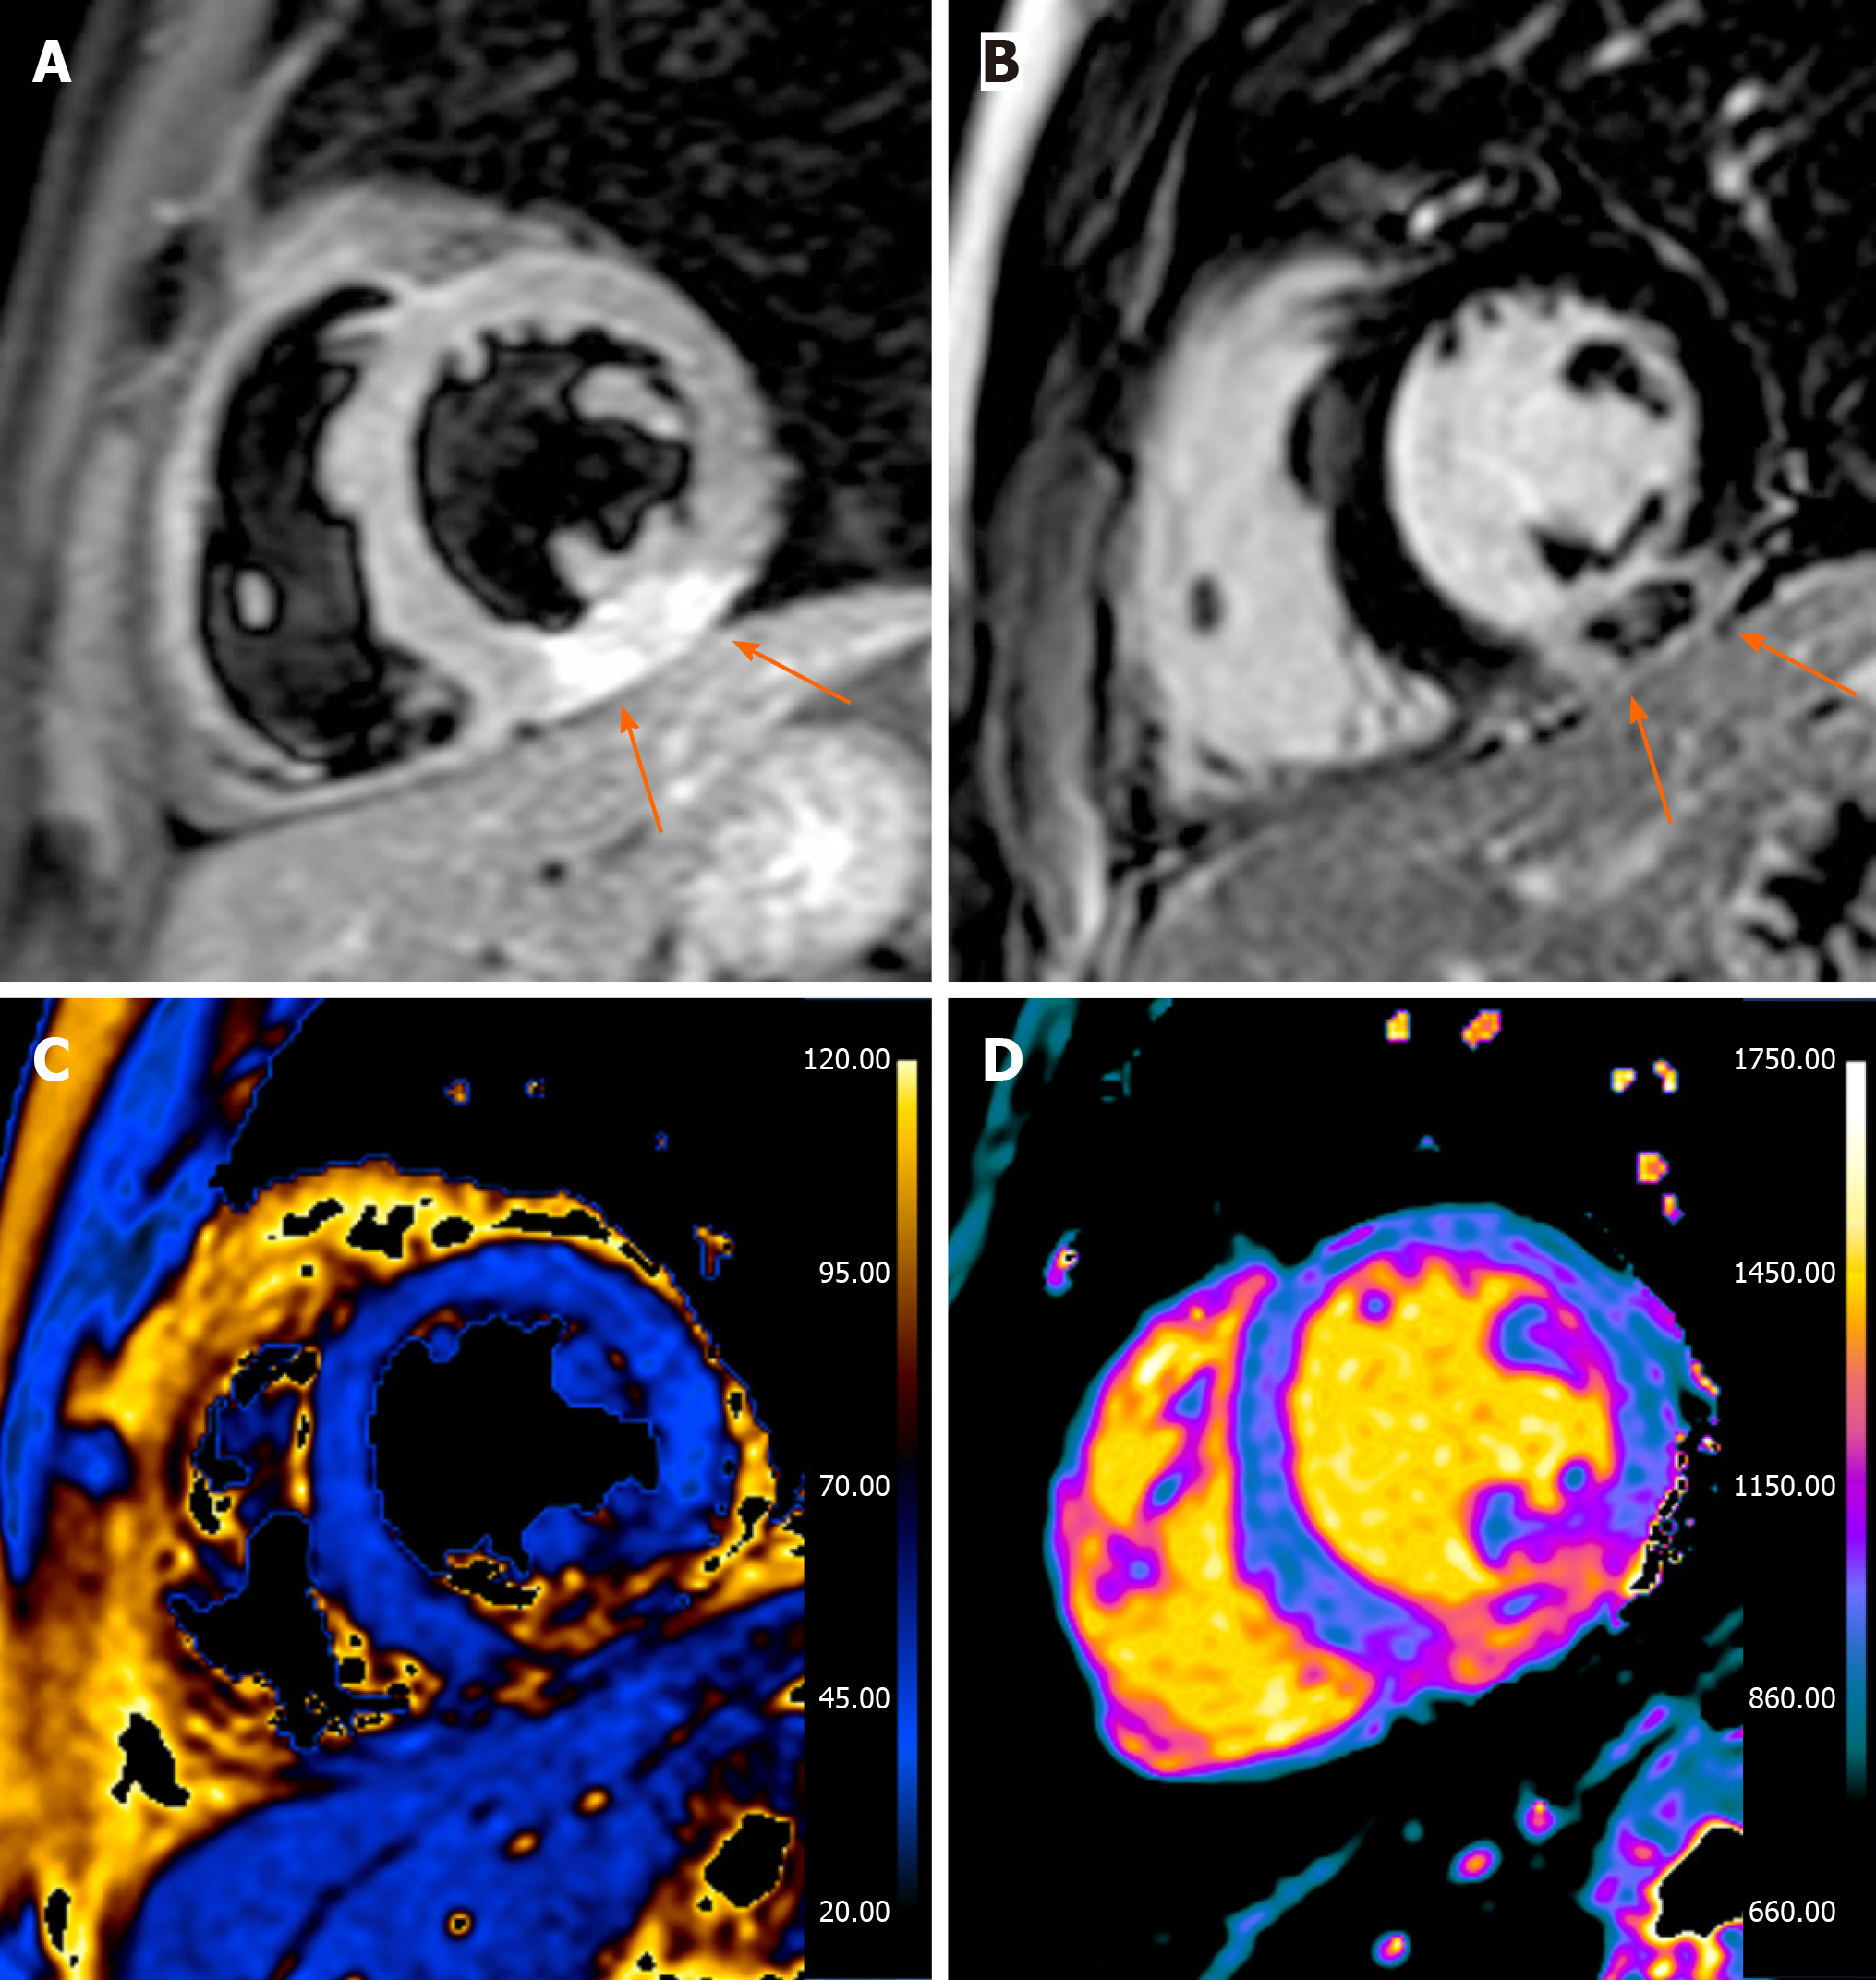
Figure 2 Thirty-three years old male presented with acute chest pain, nonspecific short-tau wave abnormalities, increased troponin values and negative invasive coronary angiography.
A: Short axis T2-weighted short-tau inversion recovery image, a transmural hyperintense areas with central hypointensity is seen in the inferior wall (arrows); B: Late gadolinium enhancement image: the hypointense areas correspond with areas of microvascular obstruction and is thought to represent myocardial hemorrhage (arrows); C: T2 map; D: T1 map. The cardiovascular magnetic resonance study is in accordance with acute myocardial infarction with sign of microvascular obstruction and hemorrhage.
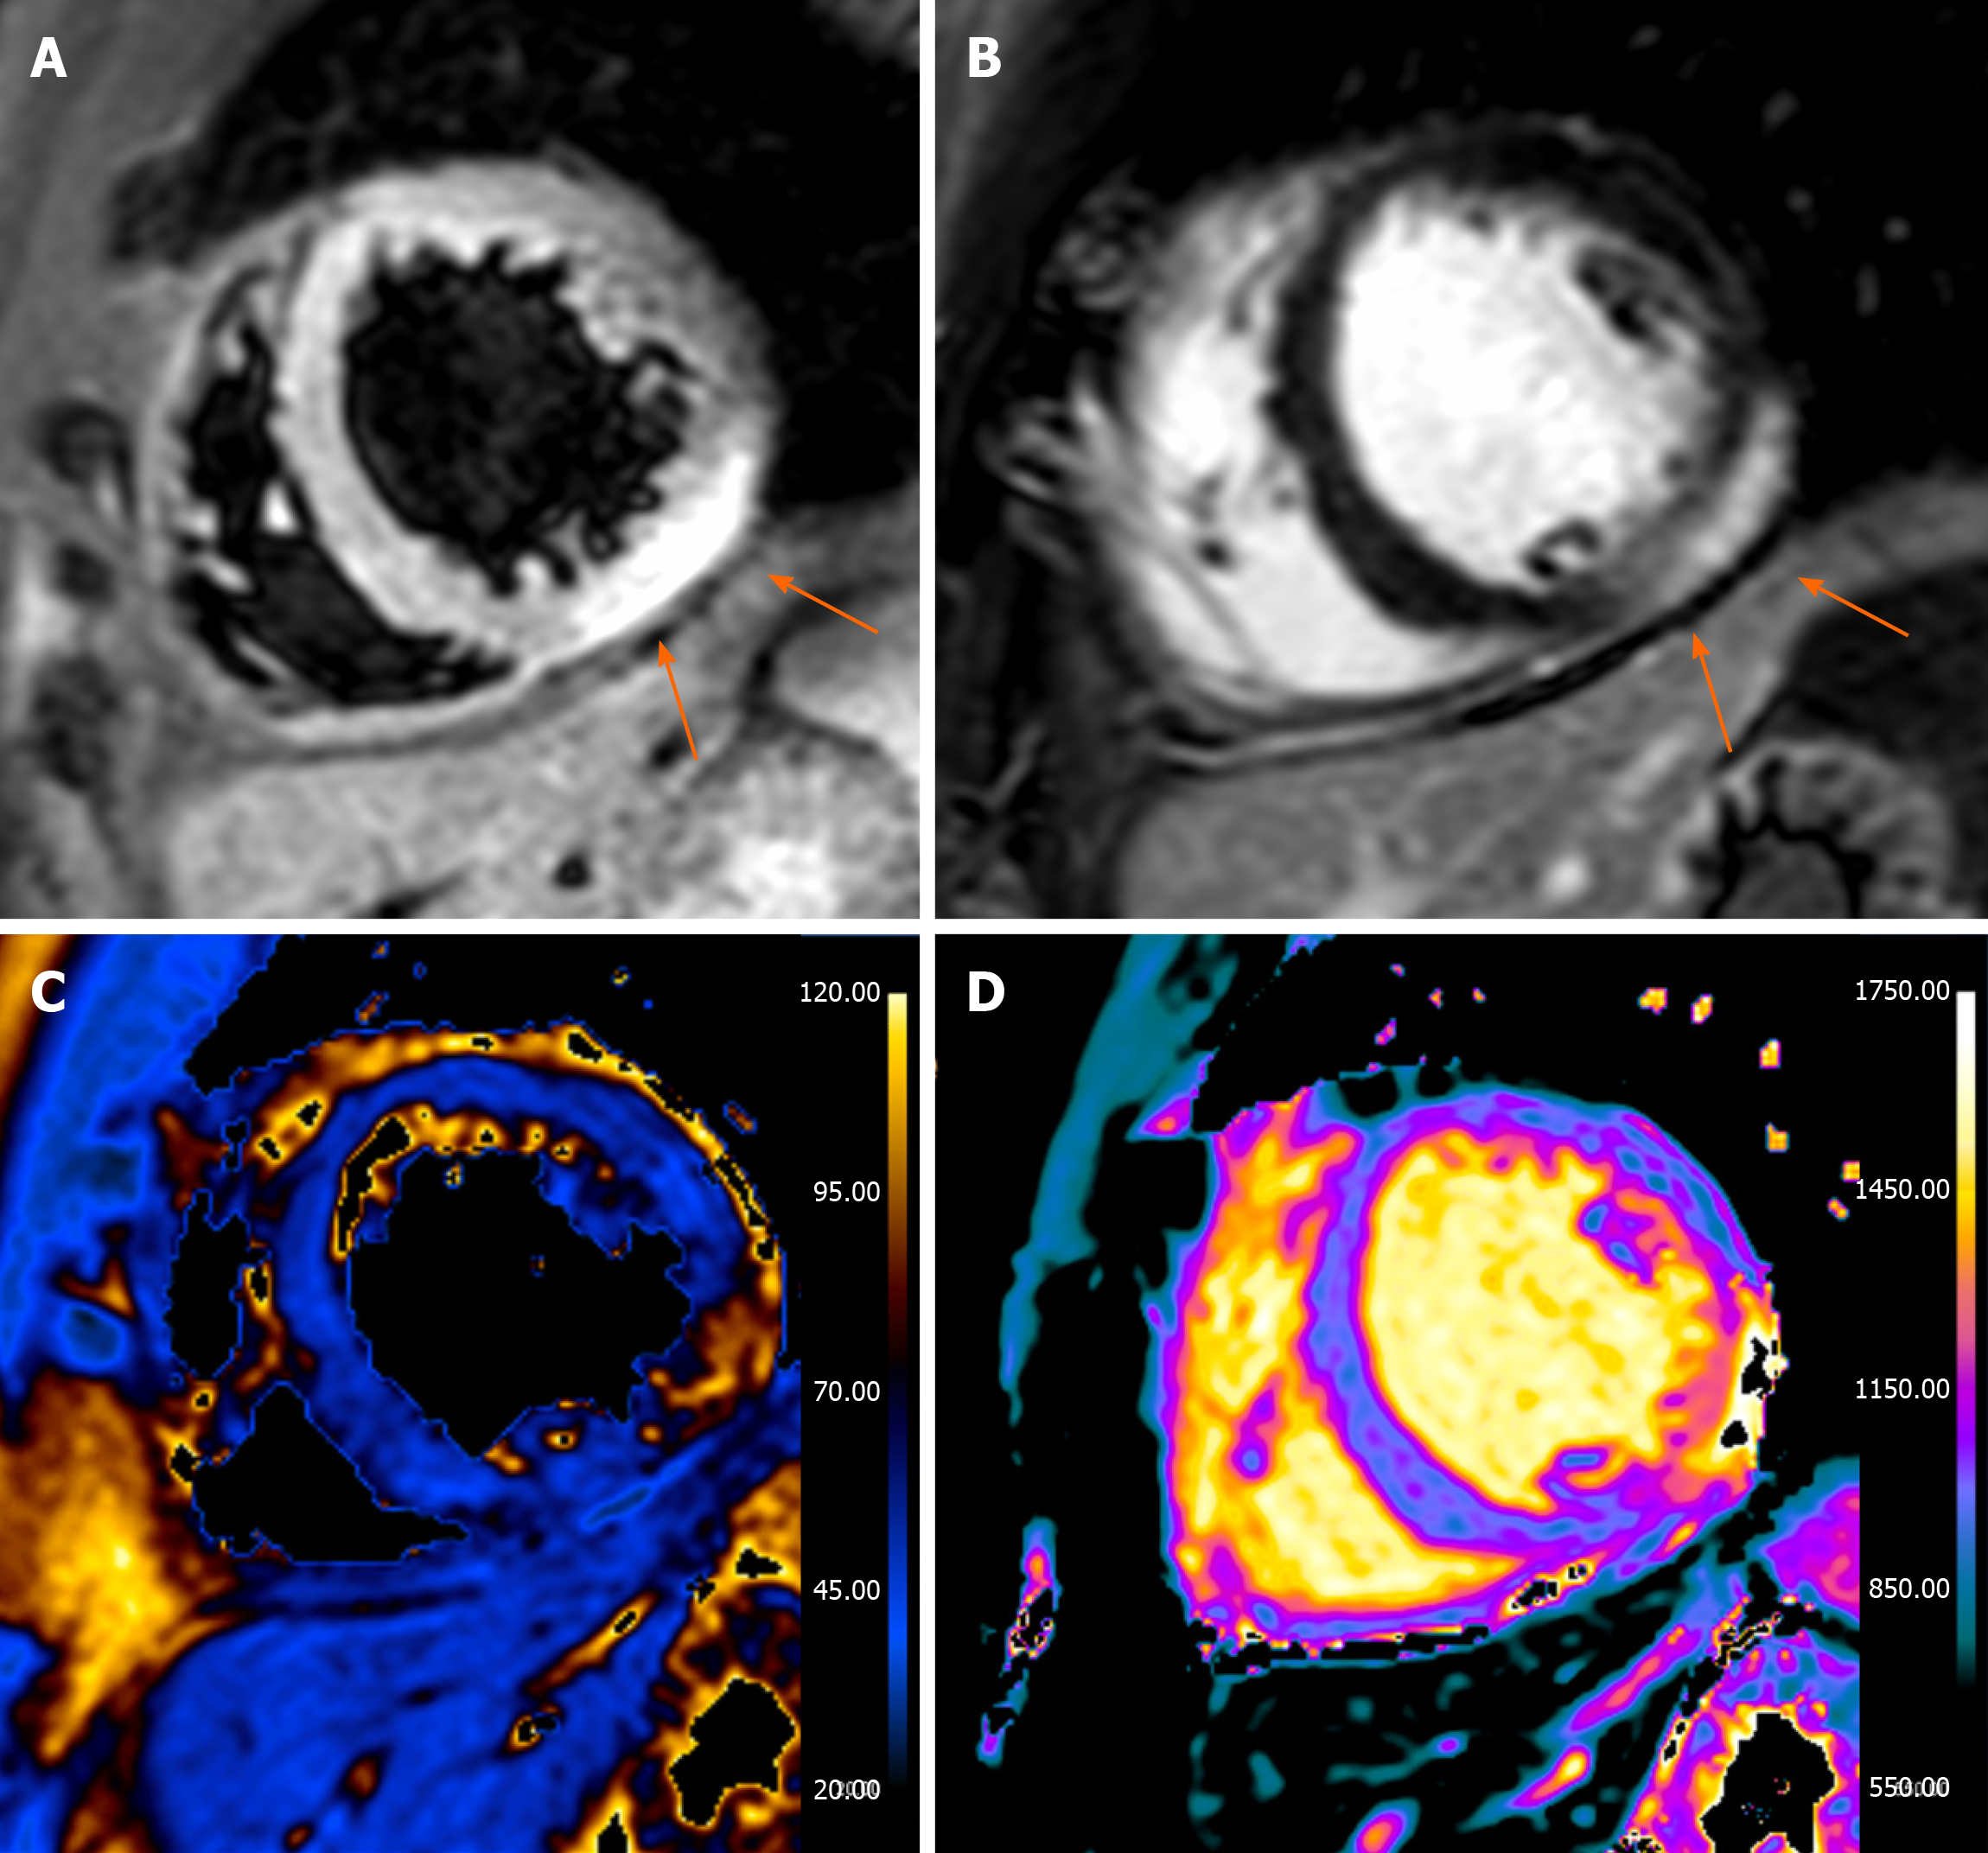
Figure 3 Thirty-seven years old male presented with acute chest pain, increased troponin values and negative invasive coronary angiography.
A: A short axis T2-weighted short-tau inversion recovery image, a subepicardial and hyperintense areas is seen in the infero-lateral wall (arrows); B: Late gadolinium enhancement image with evidence of the same alteration (arrows); C: T2 map; D: T1 map. The cardiovascular magnetic resonance study is in keeping with acute myocarditis.
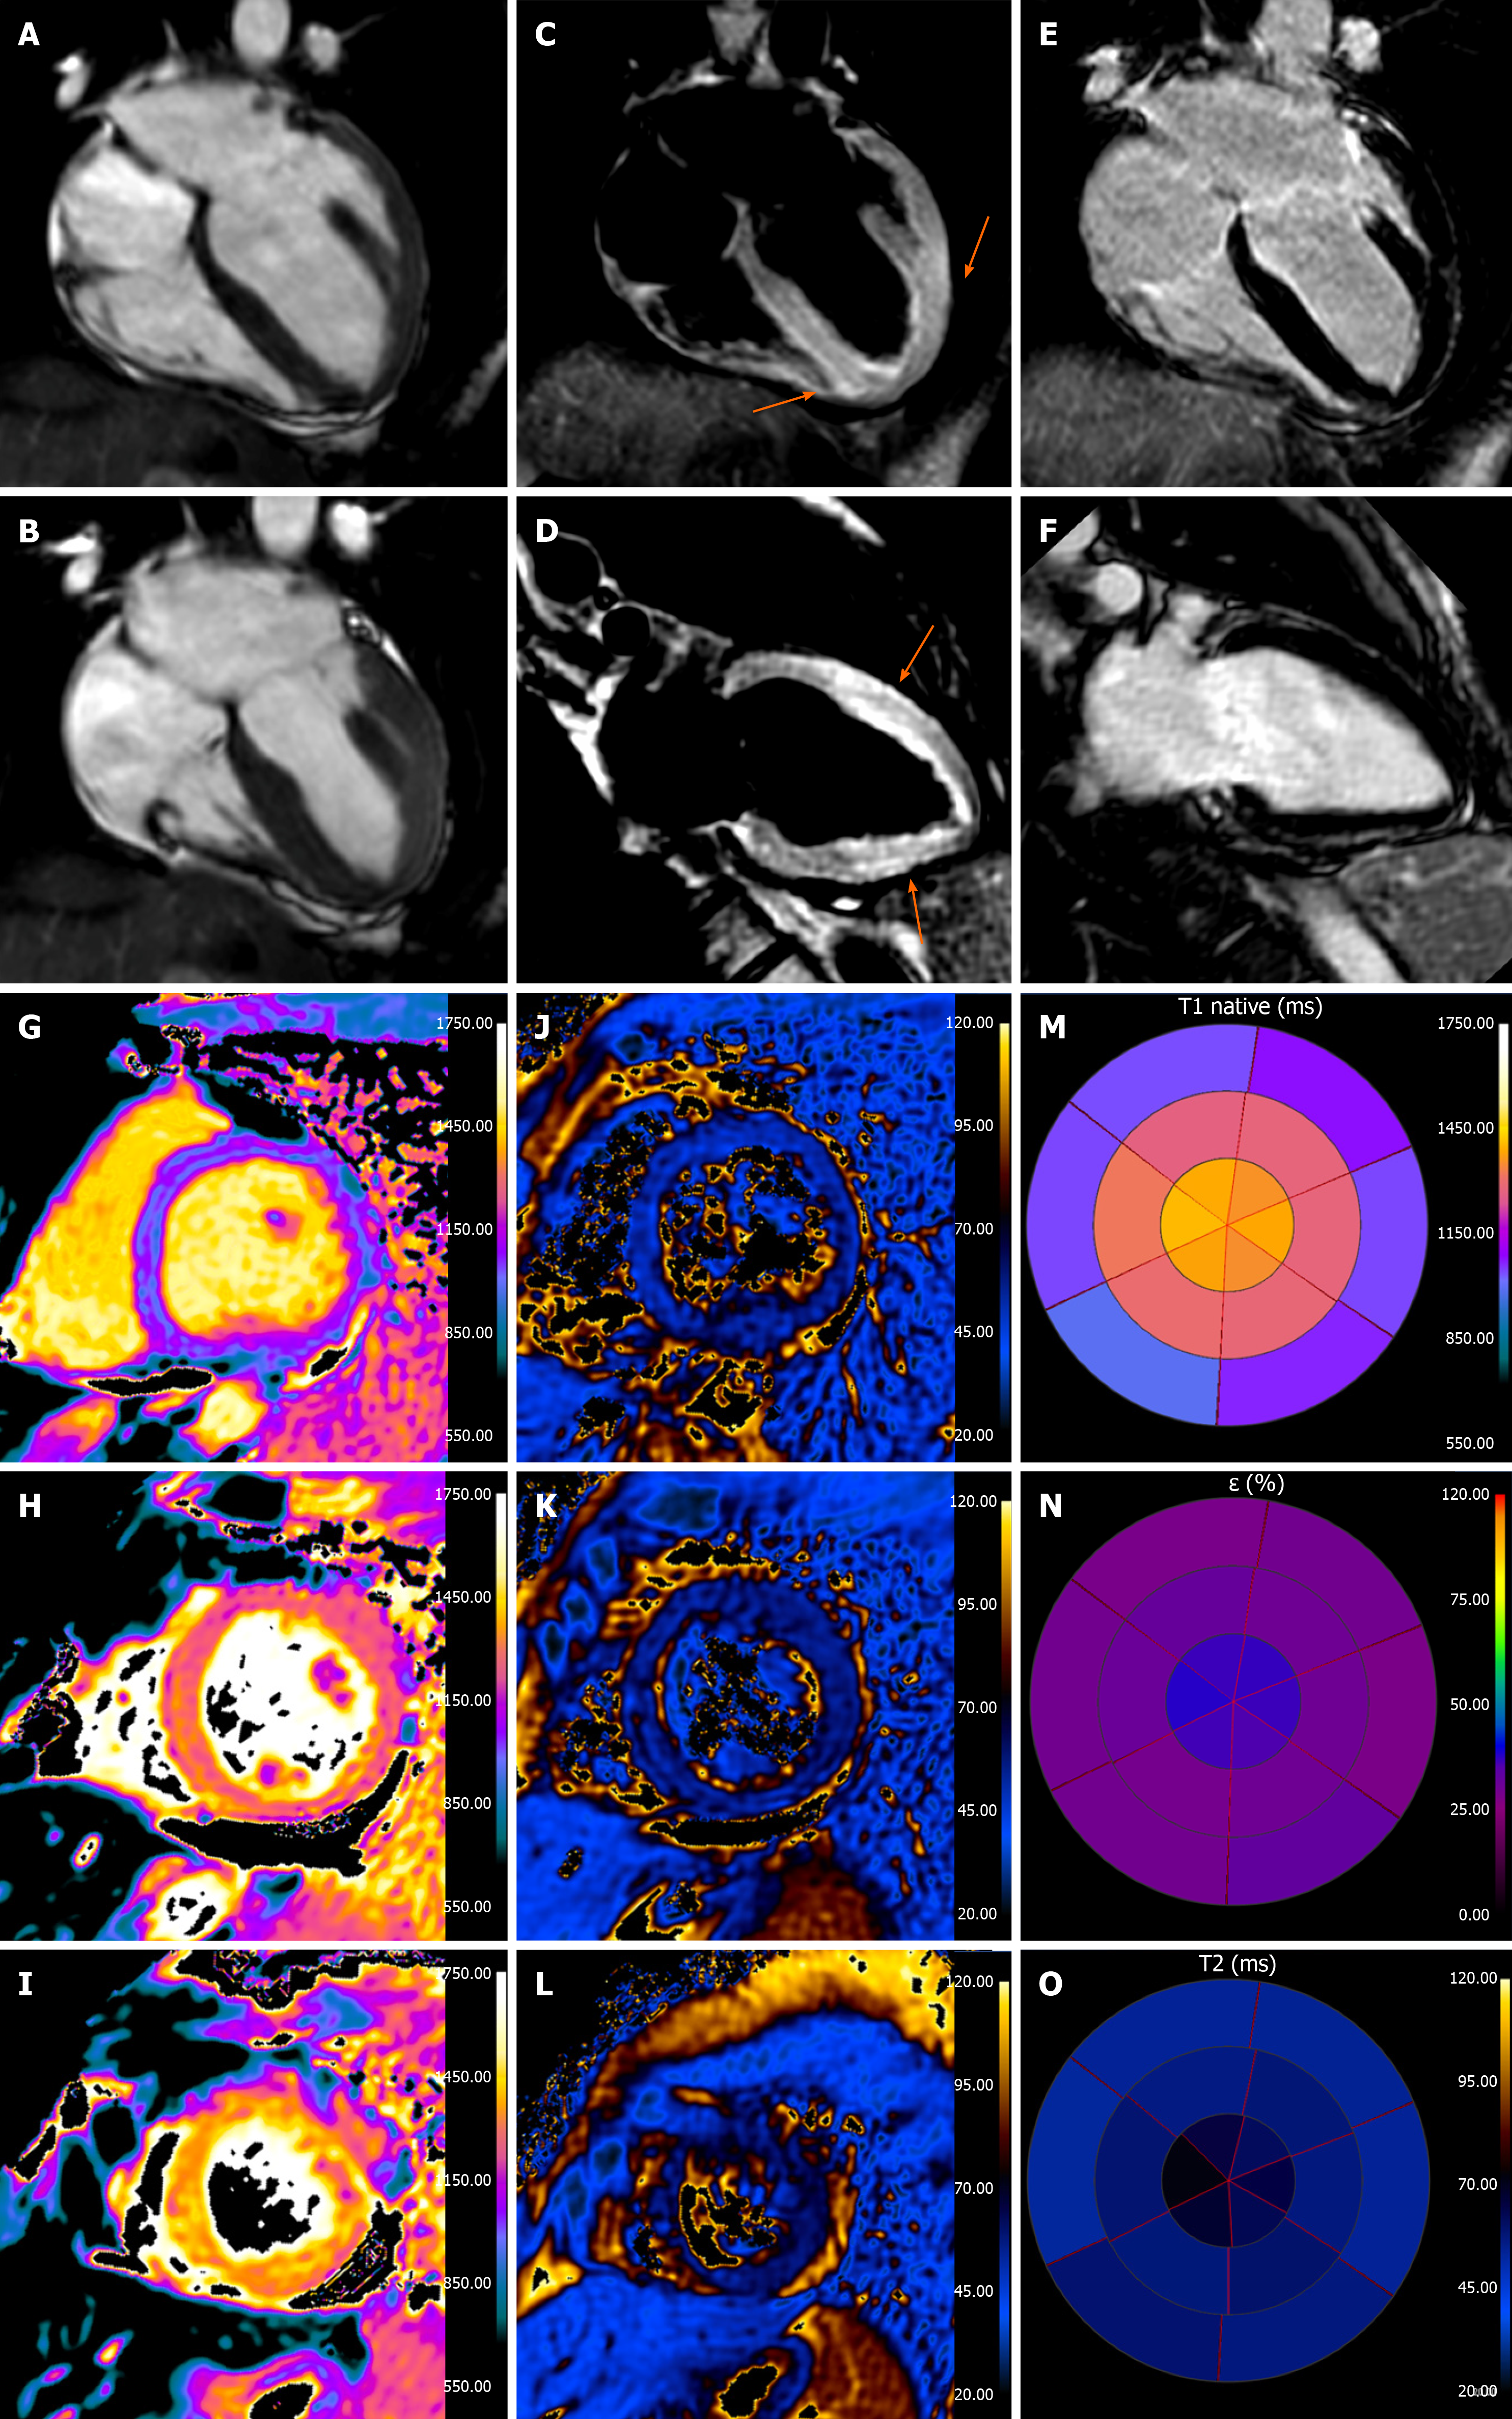
Figure 4 Thirty eight years old female presented with acute chest pain, increased troponin values and negative coronary angiogram.
A and B: Diastolic and systolic 4-chamber cine-SSFP images: there is a minimum “apical ballooning” appearance with a relative left ventricle apical akinesia with preserved function of the remaining segments, which causes the typical “apical ballooning” appearance; C and D: T2-weighted short-tau inversion recovery images with evidence of myocardial edema in apical segments (arrows); E and F: Ate gadolinium enhancement images without presence of areas of increased signal intensity; G-I: T1-map; J-L: T2-map. M-O: T1 native, extracellular volume and T2 mapping bull’s eye, there is a marked increase in values in the apical segments (T1 mapping: 1350 ms; extracellular volume: 38%, T2 mapping: 70 ms). The cardiovascular magnetic resonance images are in keeping with Takotsubo syndrome.
- Citation: Gatti M, Carisio A, D’Angelo T, Darvizeh F, Dell’Aversana S, Tore D, Centonze M, Faletti R. Cardiovascular magnetic resonance in myocardial infarction with non-obstructive coronary arteries patients: A review. World J Cardiol 2020; 12(6): 248-261
- URL: https://www.wjgnet.com/1949-8462/full/v12/i6/248.htm
- DOI: https://dx.doi.org/10.4330/wjc.v12.i6.248


