Copyright
©The Author(s) 2025.
World J Biol Chem. Sep 5, 2025; 16(3): 105875
Published online Sep 5, 2025. doi: 10.4331/wjbc.v16.i3.105875
Published online Sep 5, 2025. doi: 10.4331/wjbc.v16.i3.105875
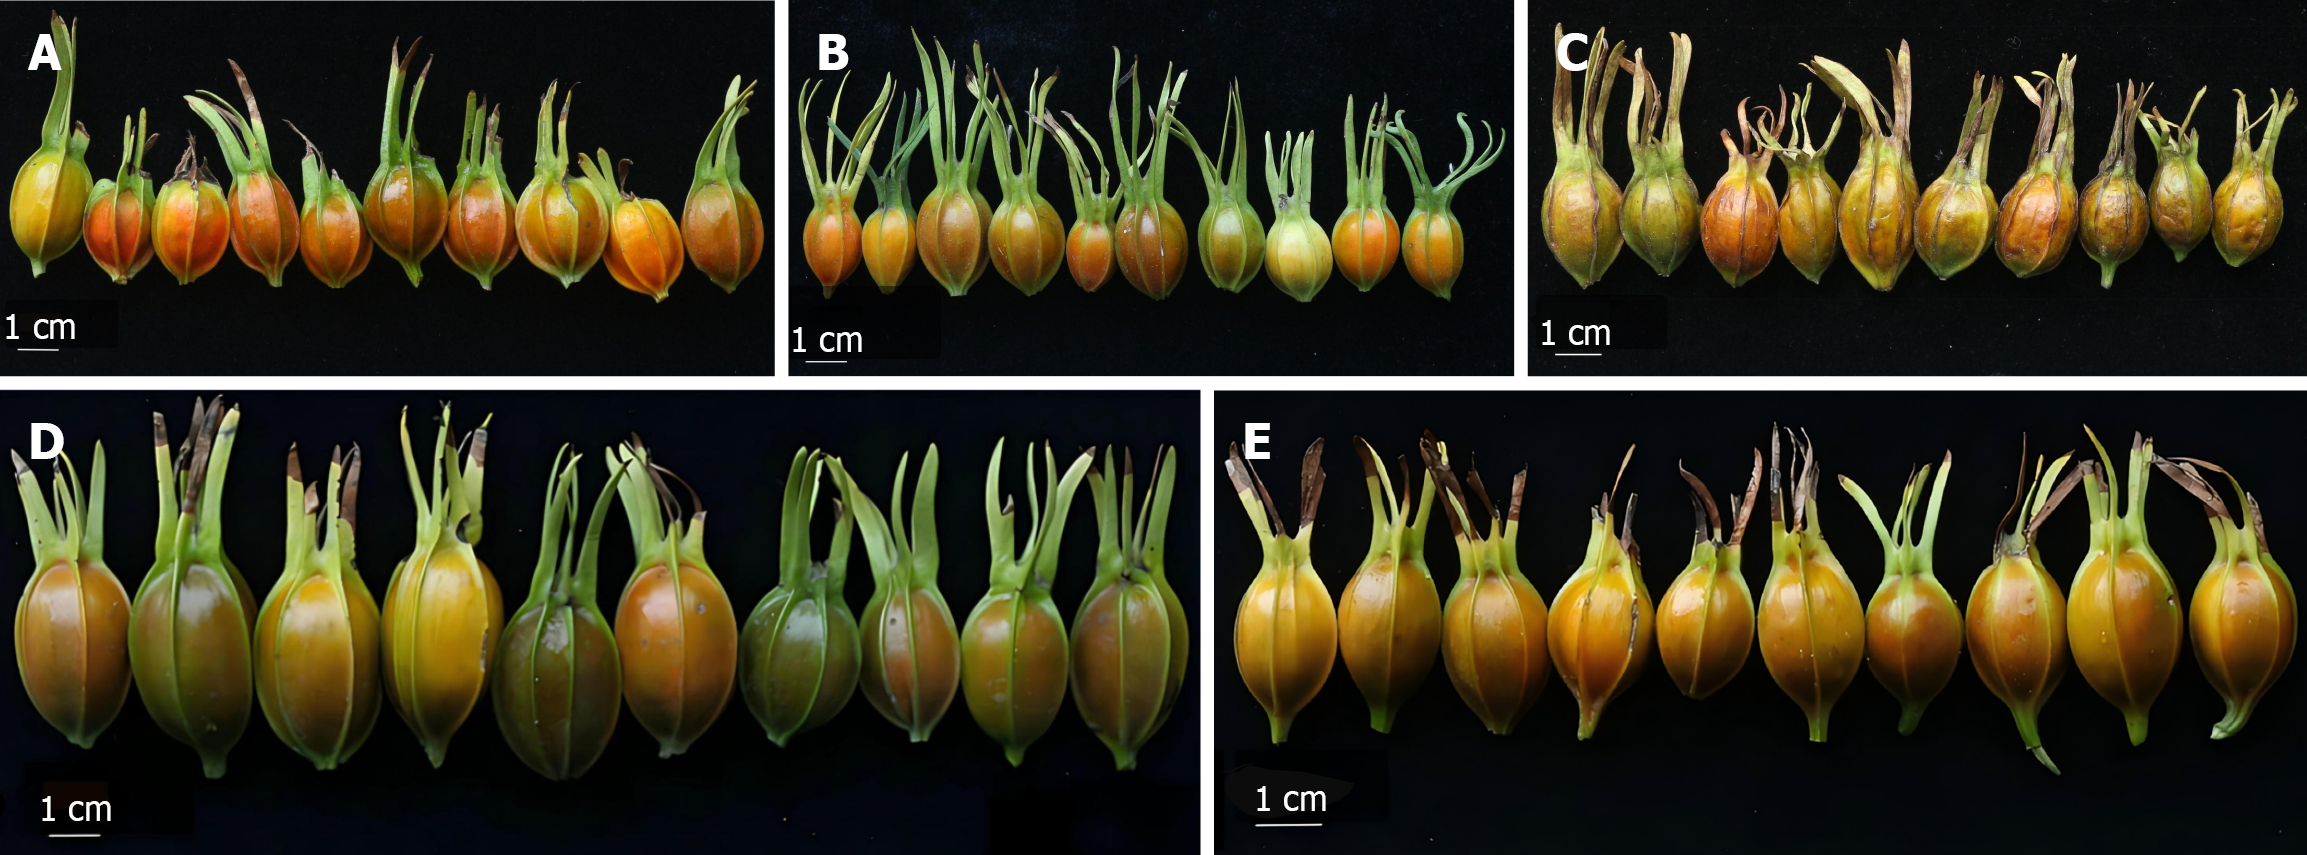
Figure 1 Morphology of gardenia fruit from five provenances.
A: Shaoyang; B: Lukou; C: Miluo; D: Xiangxi; E: Ningxiang.
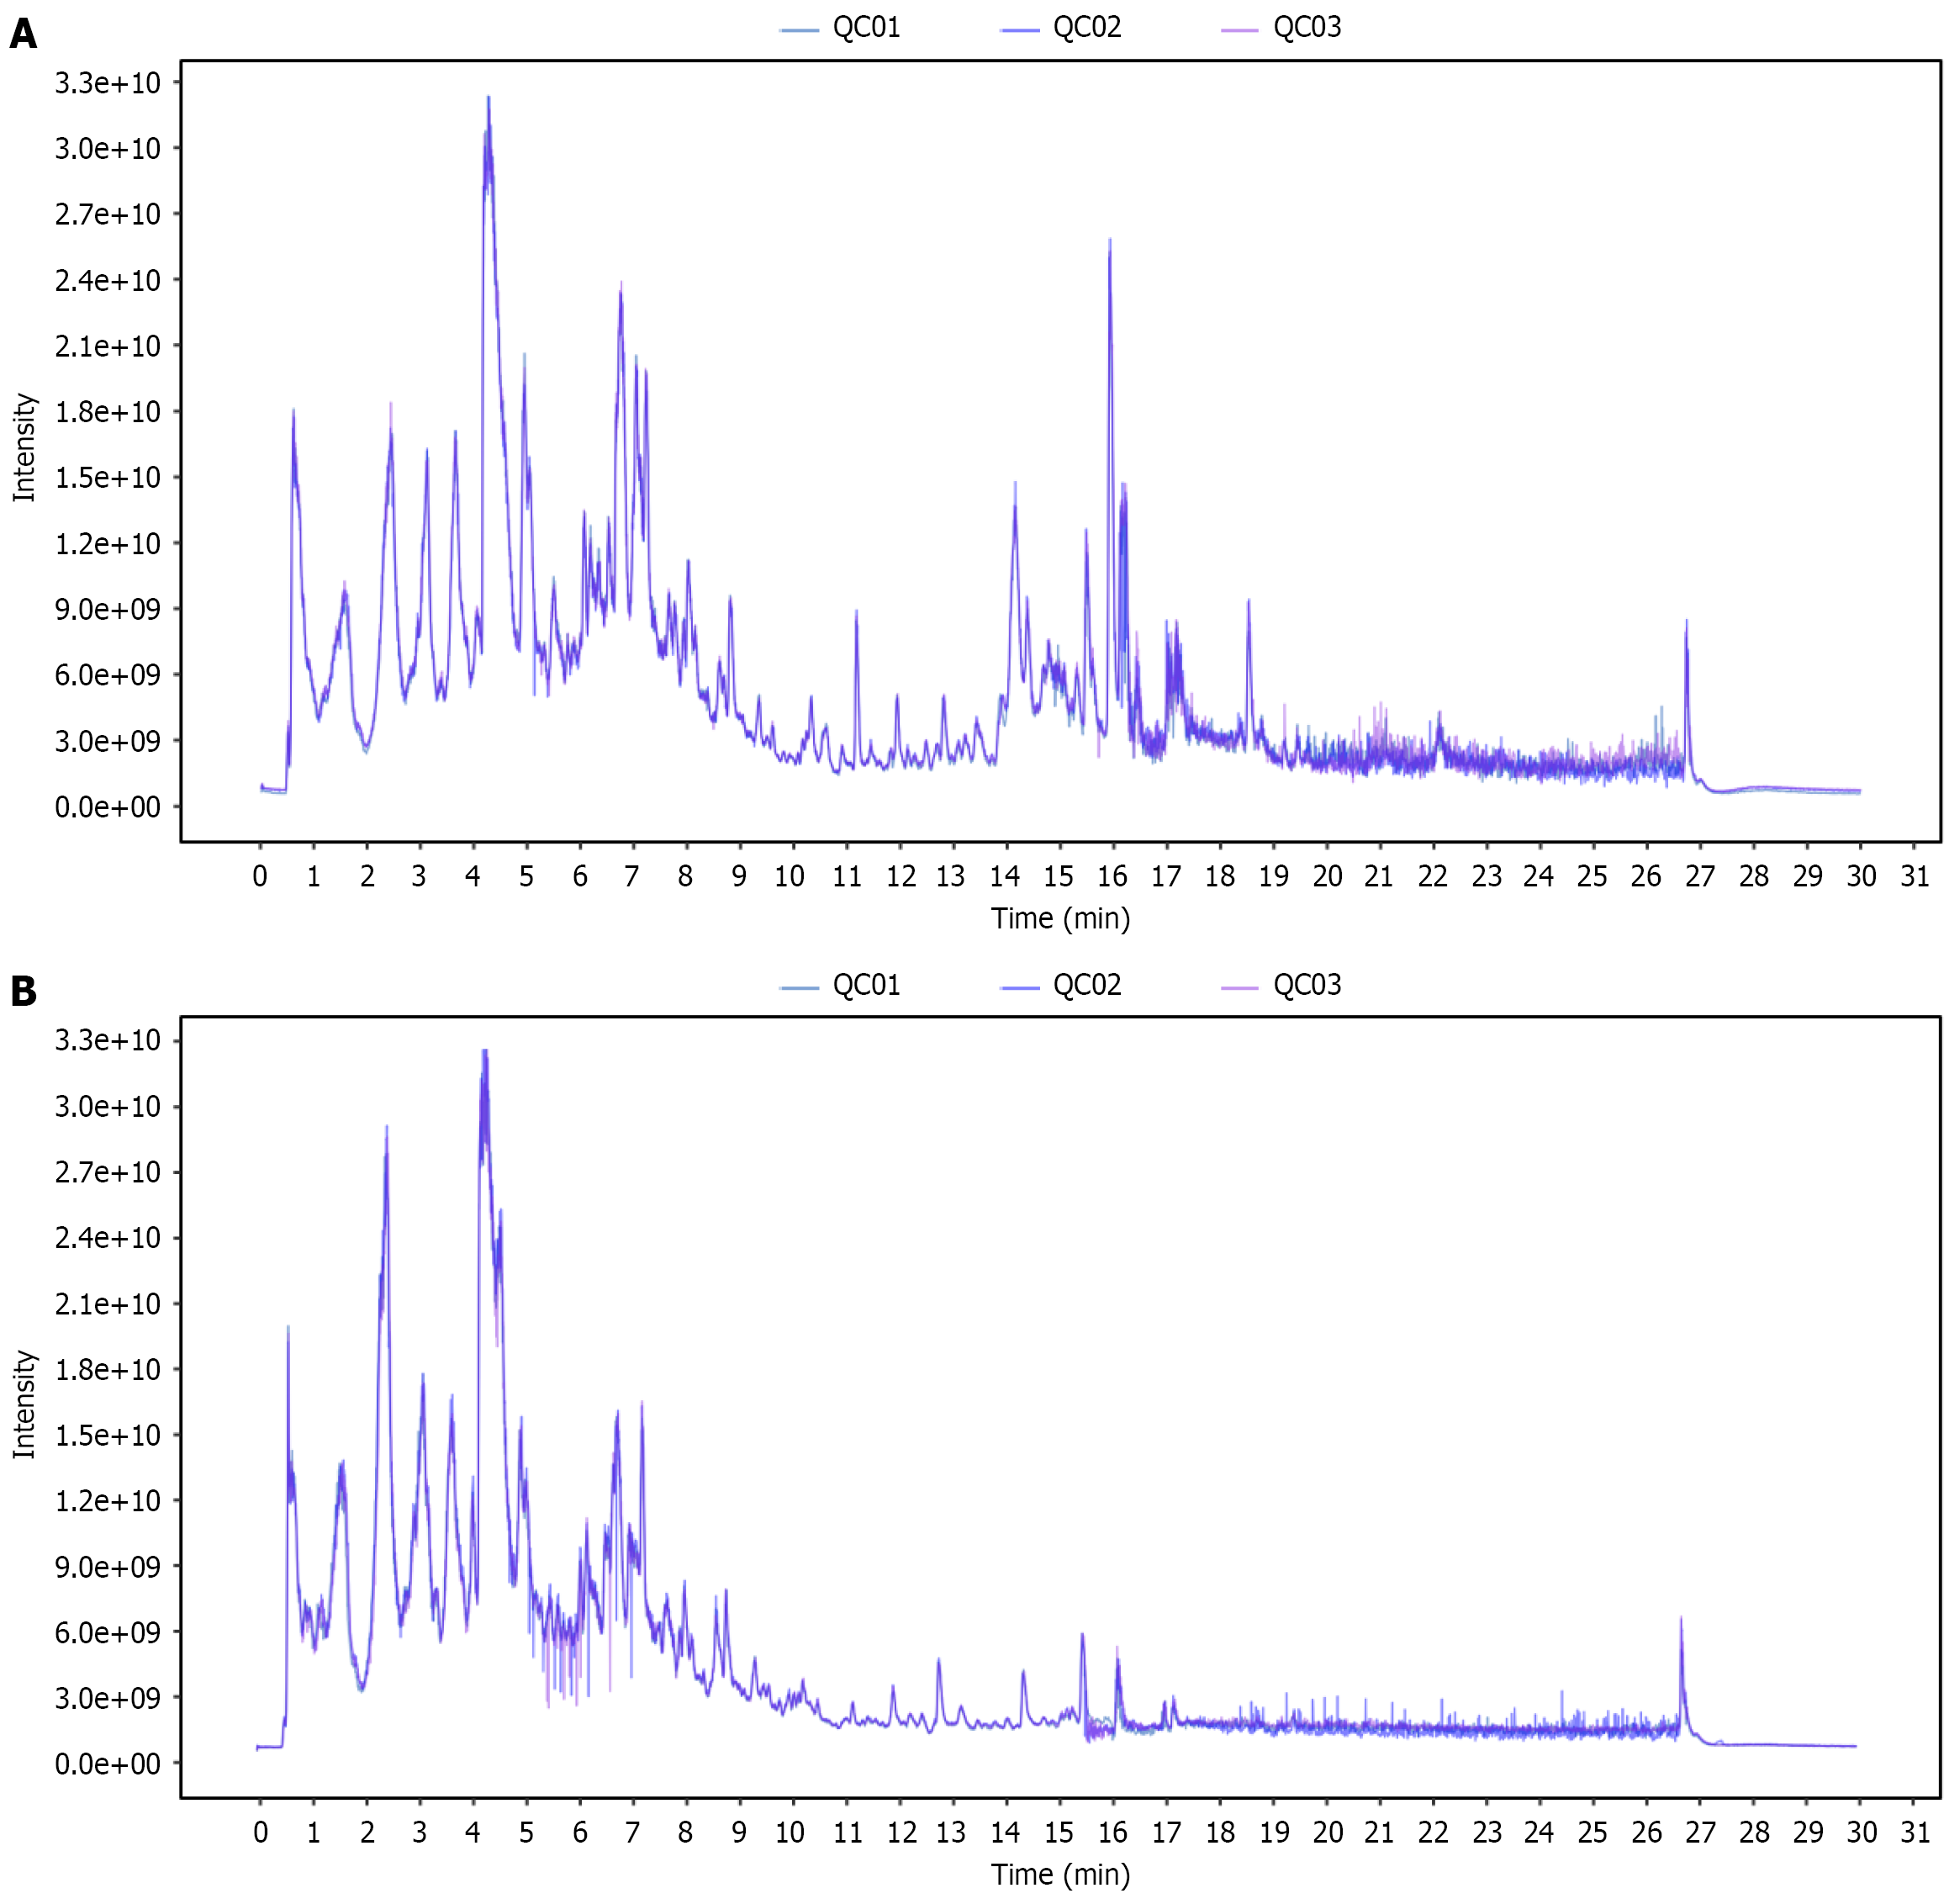
Figure 2 Total ion chromatogram of all quality control samples.
A: Positive ion mode; B: Negative ion mode. QC: Quality control.
Figure 3 Levels of typical active ingredients in wild Gardenia jasminoides fruits.
A: Geniposide; B: Chlorogenic acid; C: Crocetin. aP < 0.05 vs Lukou; bP < 0.05 vs Ningxiang; cP < 0.05 vs Xiangxi; dP < 0.05 vs Shaoyang. SY: Shaoyang; LK: Lukou; ML: Miluo; XX: Xiangxi; NX: Ningxiang.
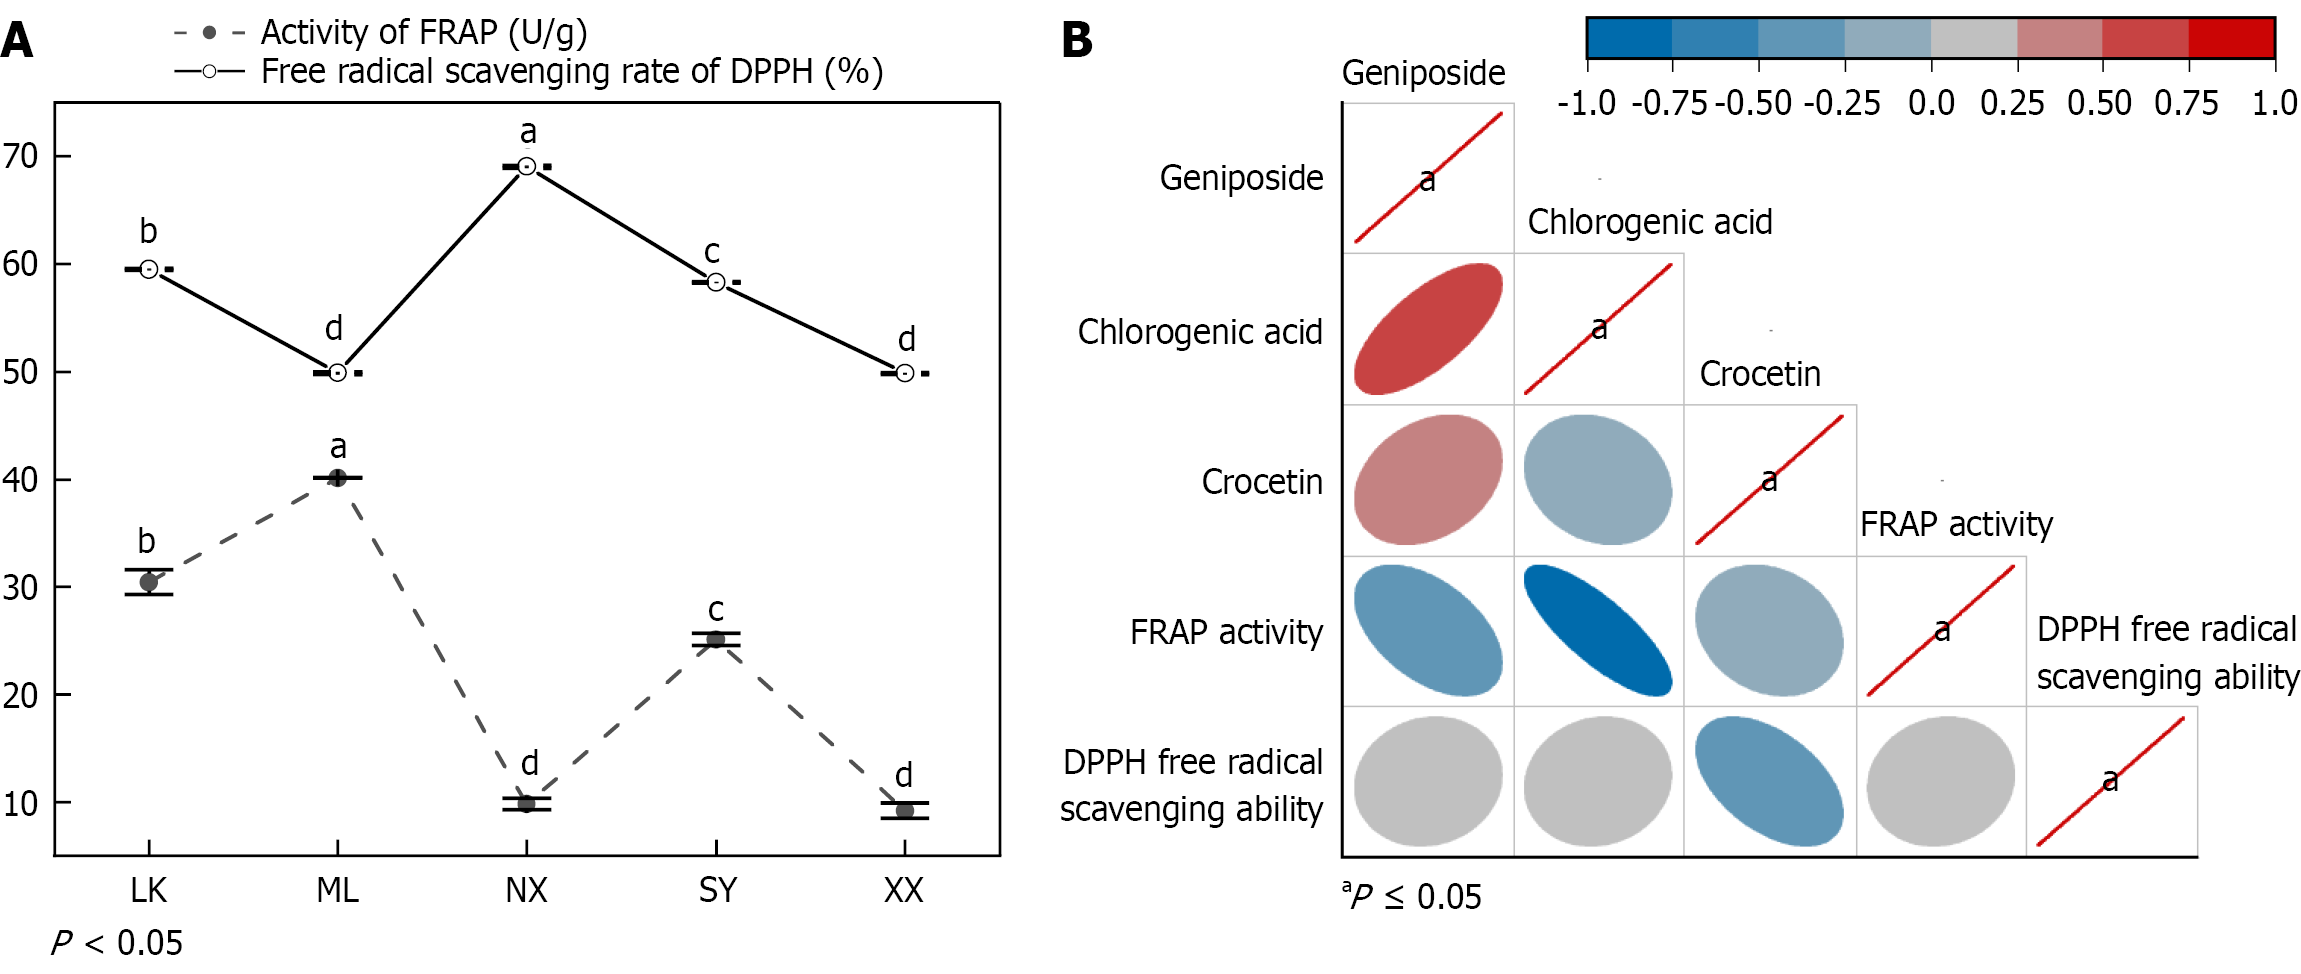
Figure 4 The antioxidant capacity of five wild Gardenia jasminoides fruit extracts.
A: Scatter plot of antioxidant capacity of wild Gardenia jasminoides fruits extracts from five provenances; B: Correlation diagram of active ingredients and antioxidant capacity. aP < 0.05 vs Lukou; bP < 0.05 vs Ningxiang; cP < 0.05 vs Xiangxi; dP < 0.05 vs Shaoyang. SY: Shaoyang; LK: Lukou; ML: Miluo; XX: Xiangxi; NX: Ningxiang; FRAP: Ferric reducing antioxidant power; DPPH: 2,2-diphenyl-1-picrylhydrazyl.
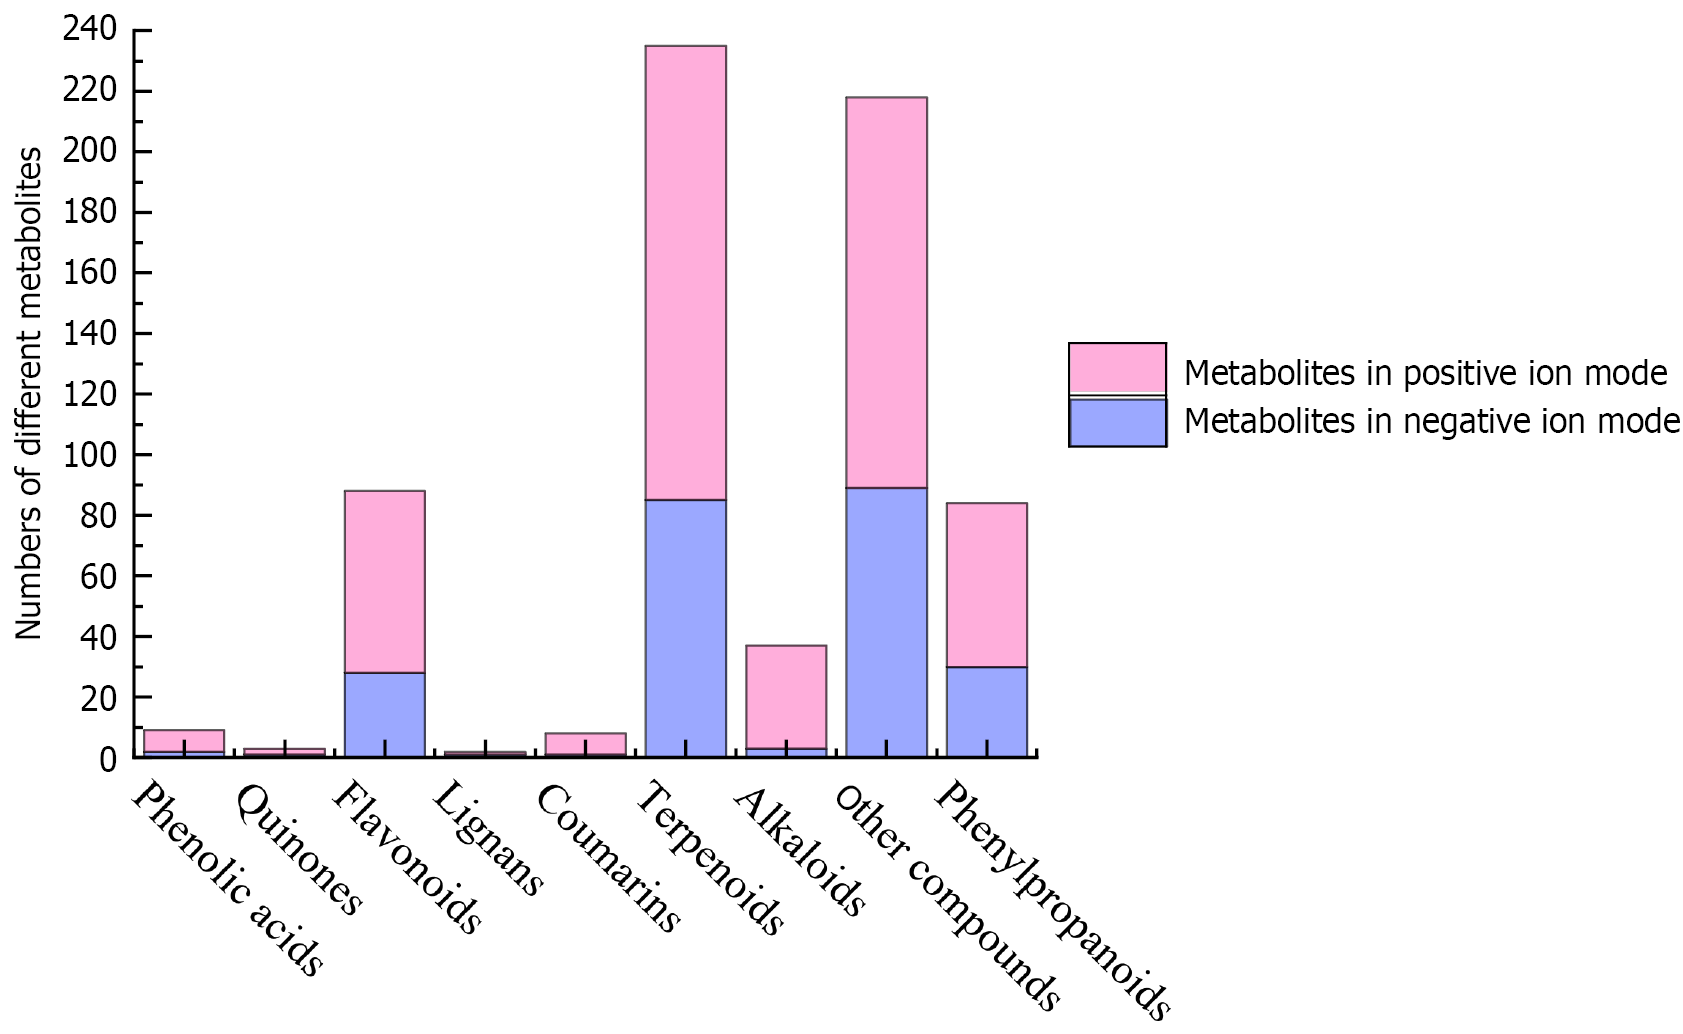
Figure 5
Metabolite classification histogram.
Figure 6 metabolite category bar graph, and principal component analysis of wild Gardenia jasminoides fruits from five provenances.
A: Positive ion mode; B: Negative ion mode. SY: Shaoyang; LK: Lukou; ML: Miluo; XX: Xiangxi; NX: Ningxiang; QC: Quality control; PC1: Scores of the first principal component; PC2: Scores of the second principal component.
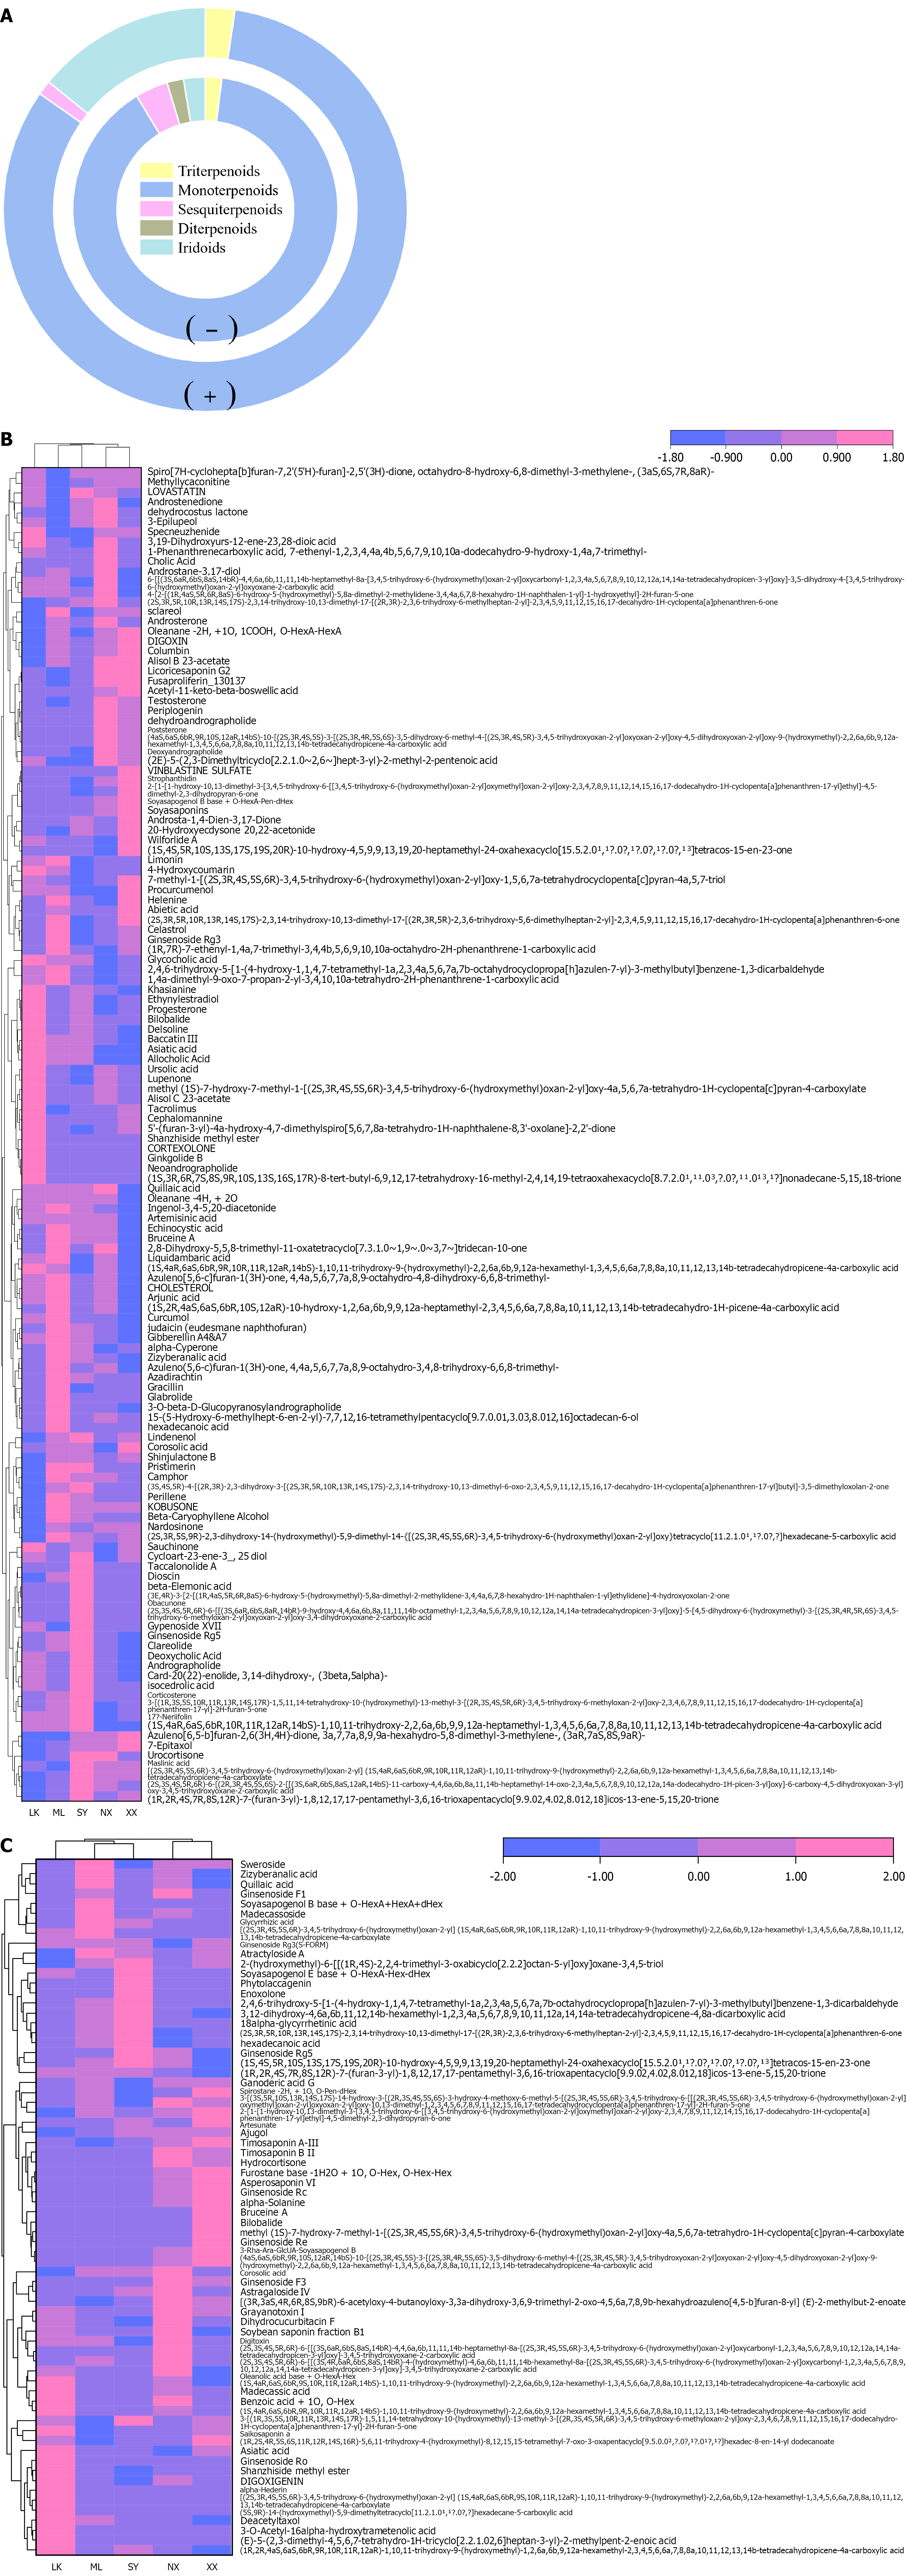
Figure 7 The heatmap is shown to represent the alteration of monoterpenoid.
A: Ring diagram of terpenoid; B: The heatmap shown to represent the alteration of monoterpenoid in positive ion mode; C: The heatmap shown to represent the alteration of monoterpenoid in negative ion mode. (+): Positive ion mode; (-): Negative ion mode. SY: Shaoyang; LK: Lukou; ML: Miluo; XX: Xiangxi; NX: Ningxiang.
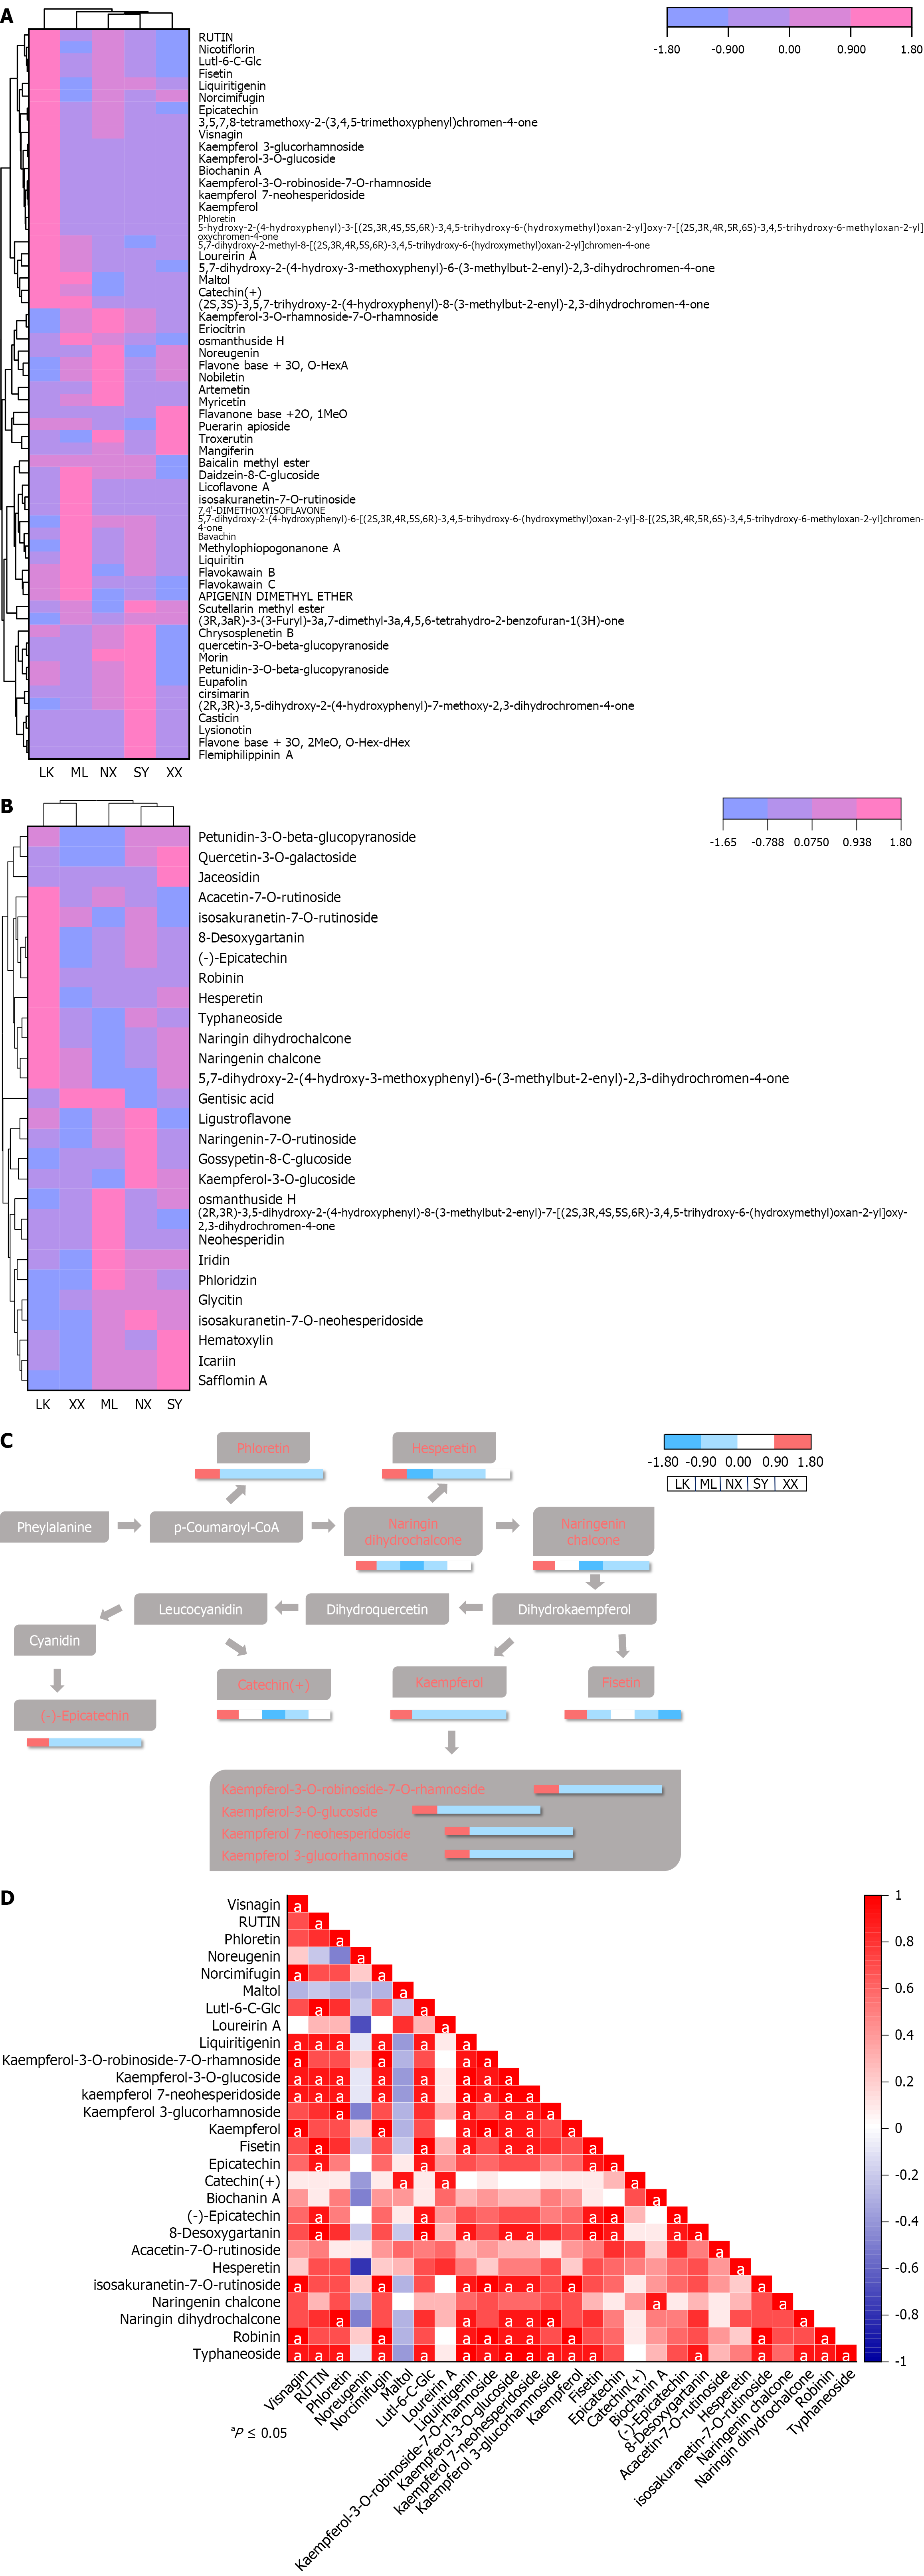
Figure 8 The differences in the content of flavonoids in Gardenia jasminoides fruits from five provenances.
A: The heatmap shown to represent the alteration of flavonoids in positive ion mode; B: The heatmap shown to represent the alteration of flavonoids in negative ion mode; C: Analysis of key substances in flavonoid pathway; the red text indicates those metabolites that are higher in Lukou (LK) extract, the white text indicates no detected metabolites; D: Dorrelation heat map of high content metabolites in LK extract. aP ≤ 0.05. SY: Shaoyang; LK: Lukou; ML: Miluo; XX: Xiangxi; NX: Ningxiang.
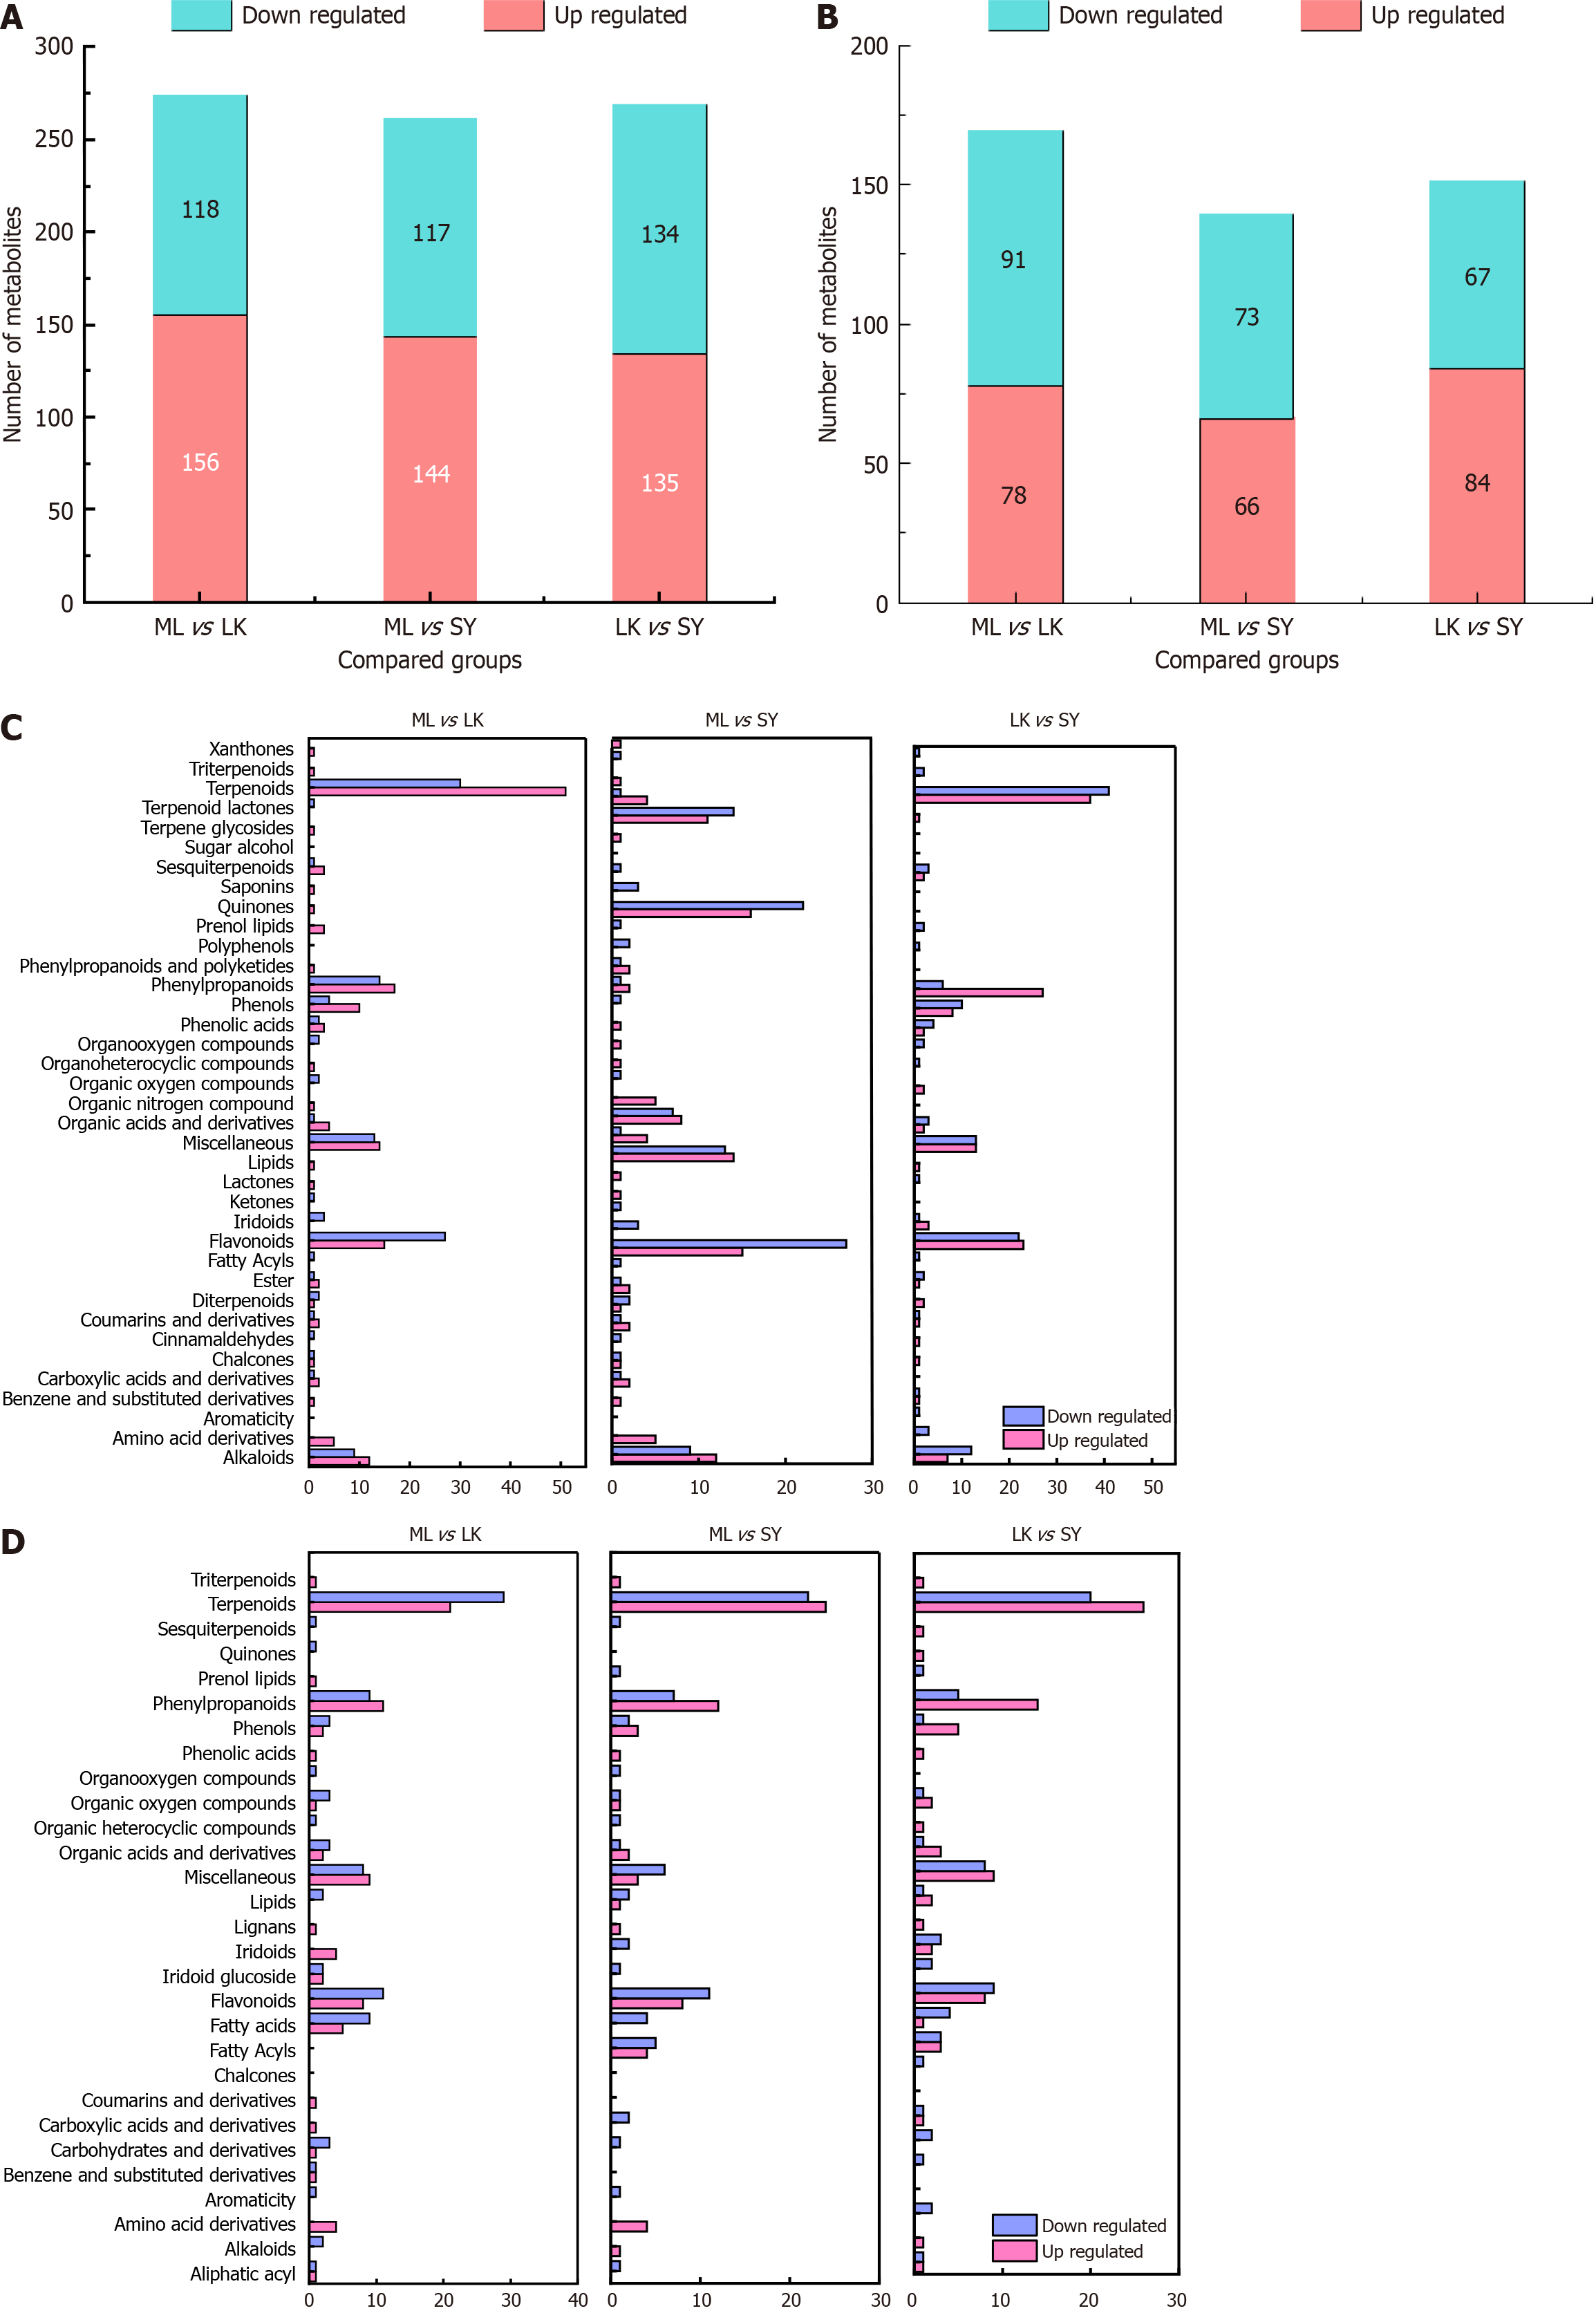
Figure 9 The differential metabolites and distribution in Gardenia jasminoides fruits from three provenances.
A: The number of differential metabolites in positive ion mode; B: Negative ion mode; C: Distribution of the different metabolites in Shaoyang, Miluo, and Lukou extracts in positive ion mode; D: Negative ion mode. SY: Shaoyang; LK: Lukou; ML: Miluo; XX: Xiangxi; NX: Ningxiang.
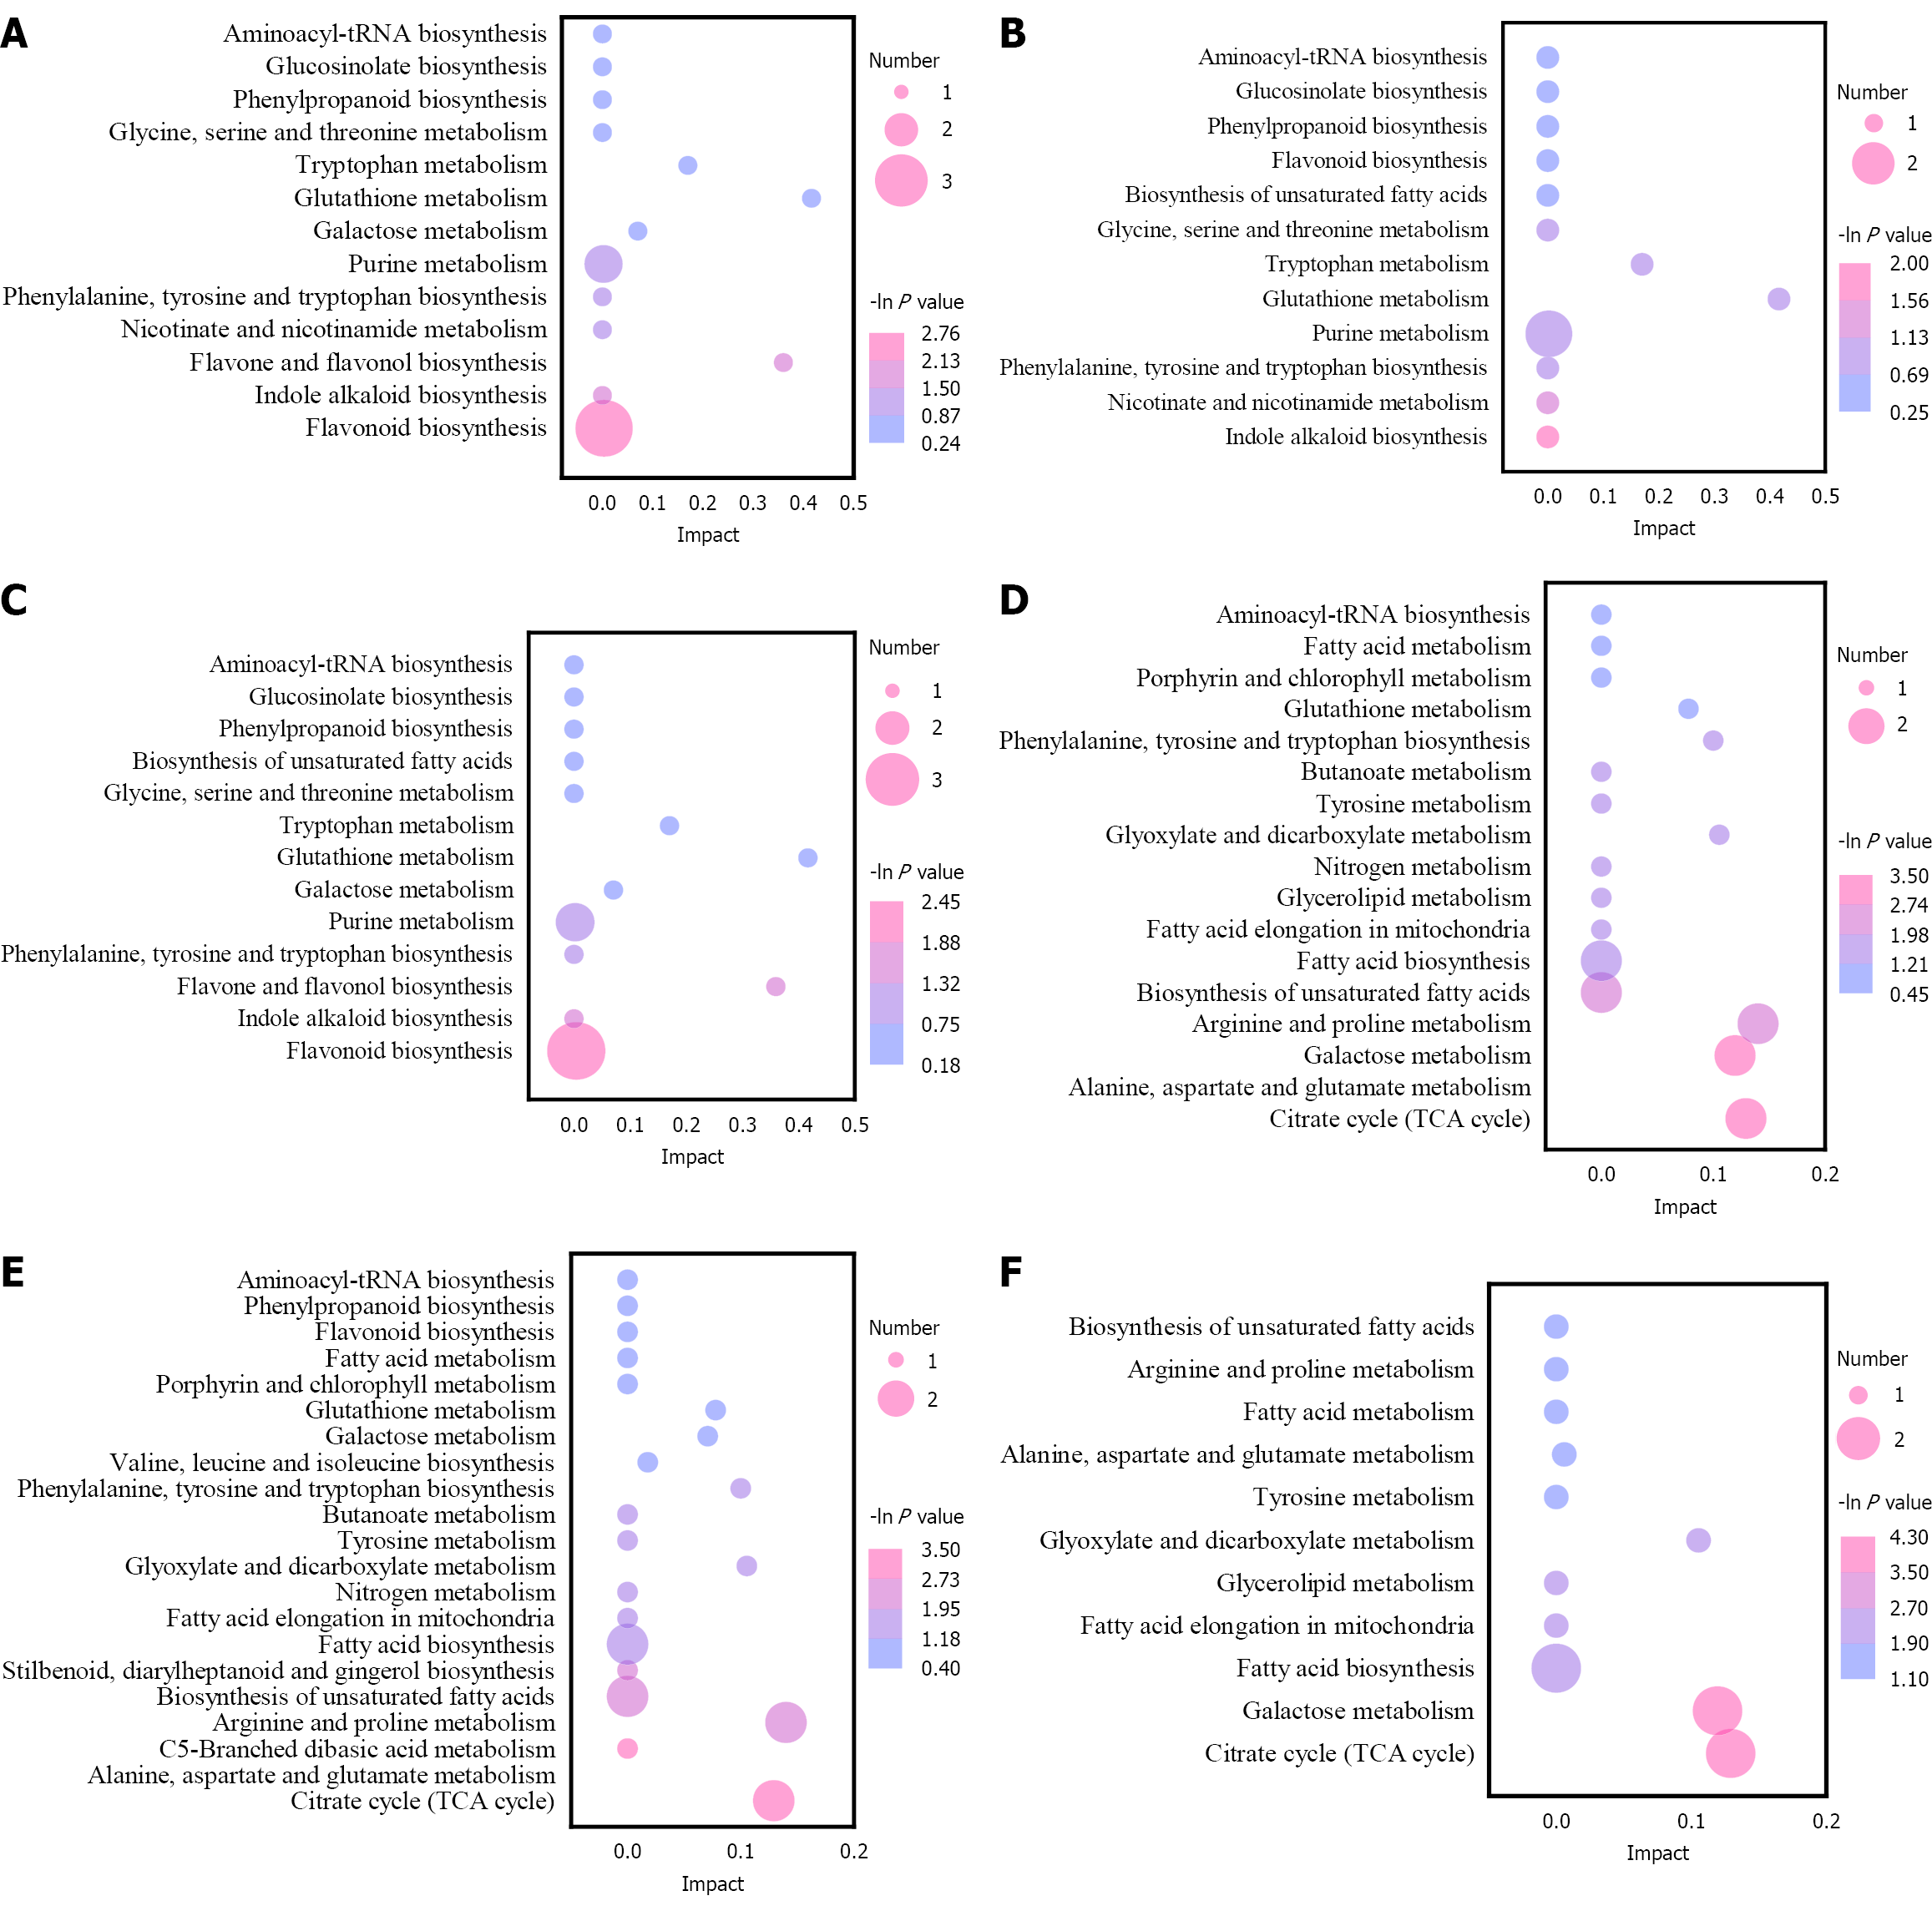
Figure 10 The enriched bubble diagrams of the differential metabolites Kyoto Encyclopaedia of Genes and Genomes pathway in Miluo vs Lukou, Miluo vs Shaoyang and Lukou vs Shaoyang comparisons.
A-C: The enriched bubble diagrams of the differential metabolites Kyoto Encyclopaedia of Genes and Genomes (KEGG) pathway in Miluo (ML) vs Lukou (LK), ML vs Shaoyang (SY) and LK vs SY comparisons in positive ion modes respectively; D-F: The enriched bubble diagrams of the differential metabolites KEGG pathway in ML vs LK, ML vs SY and LK vs SY comparisons in negative ion modes respectively. Horizontal coordinate indicated the Impact value of the metabolic pathway topological analysis. Each bubble represents a metabolic pathway, bubble size represents the number of differential metabolites in the corresponding pathway and the color of the bubble represents the P value of the enrichment analysis. The redder the bubble color, the higher the degree of enrichment of the pathway. SY: Shaoyang; LK: Lukou; ML: Miluo; XX: Xiangxi; NX: Ningxiang.
- Citation: Bi WY, He WL, Wang W, Wang XR, Zhou ZJ, Zeng YL. Chemical composition differences in wild Gardenia jasminoides fruits across provenances using metabolomics. World J Biol Chem 2025; 16(3): 105875
- URL: https://www.wjgnet.com/1949-8454/full/v16/i3/105875.htm
- DOI: https://dx.doi.org/10.4331/wjbc.v16.i3.105875


