
















Copyright: ©Author(s) 2026.
World J Gastrointest Surg. Aug 27, 2026; 18(8): 122207
Published online Aug 27, 2026. doi: 10.4240/wjgs.122207
Published online Aug 27, 2026. doi: 10.4240/wjgs.122207
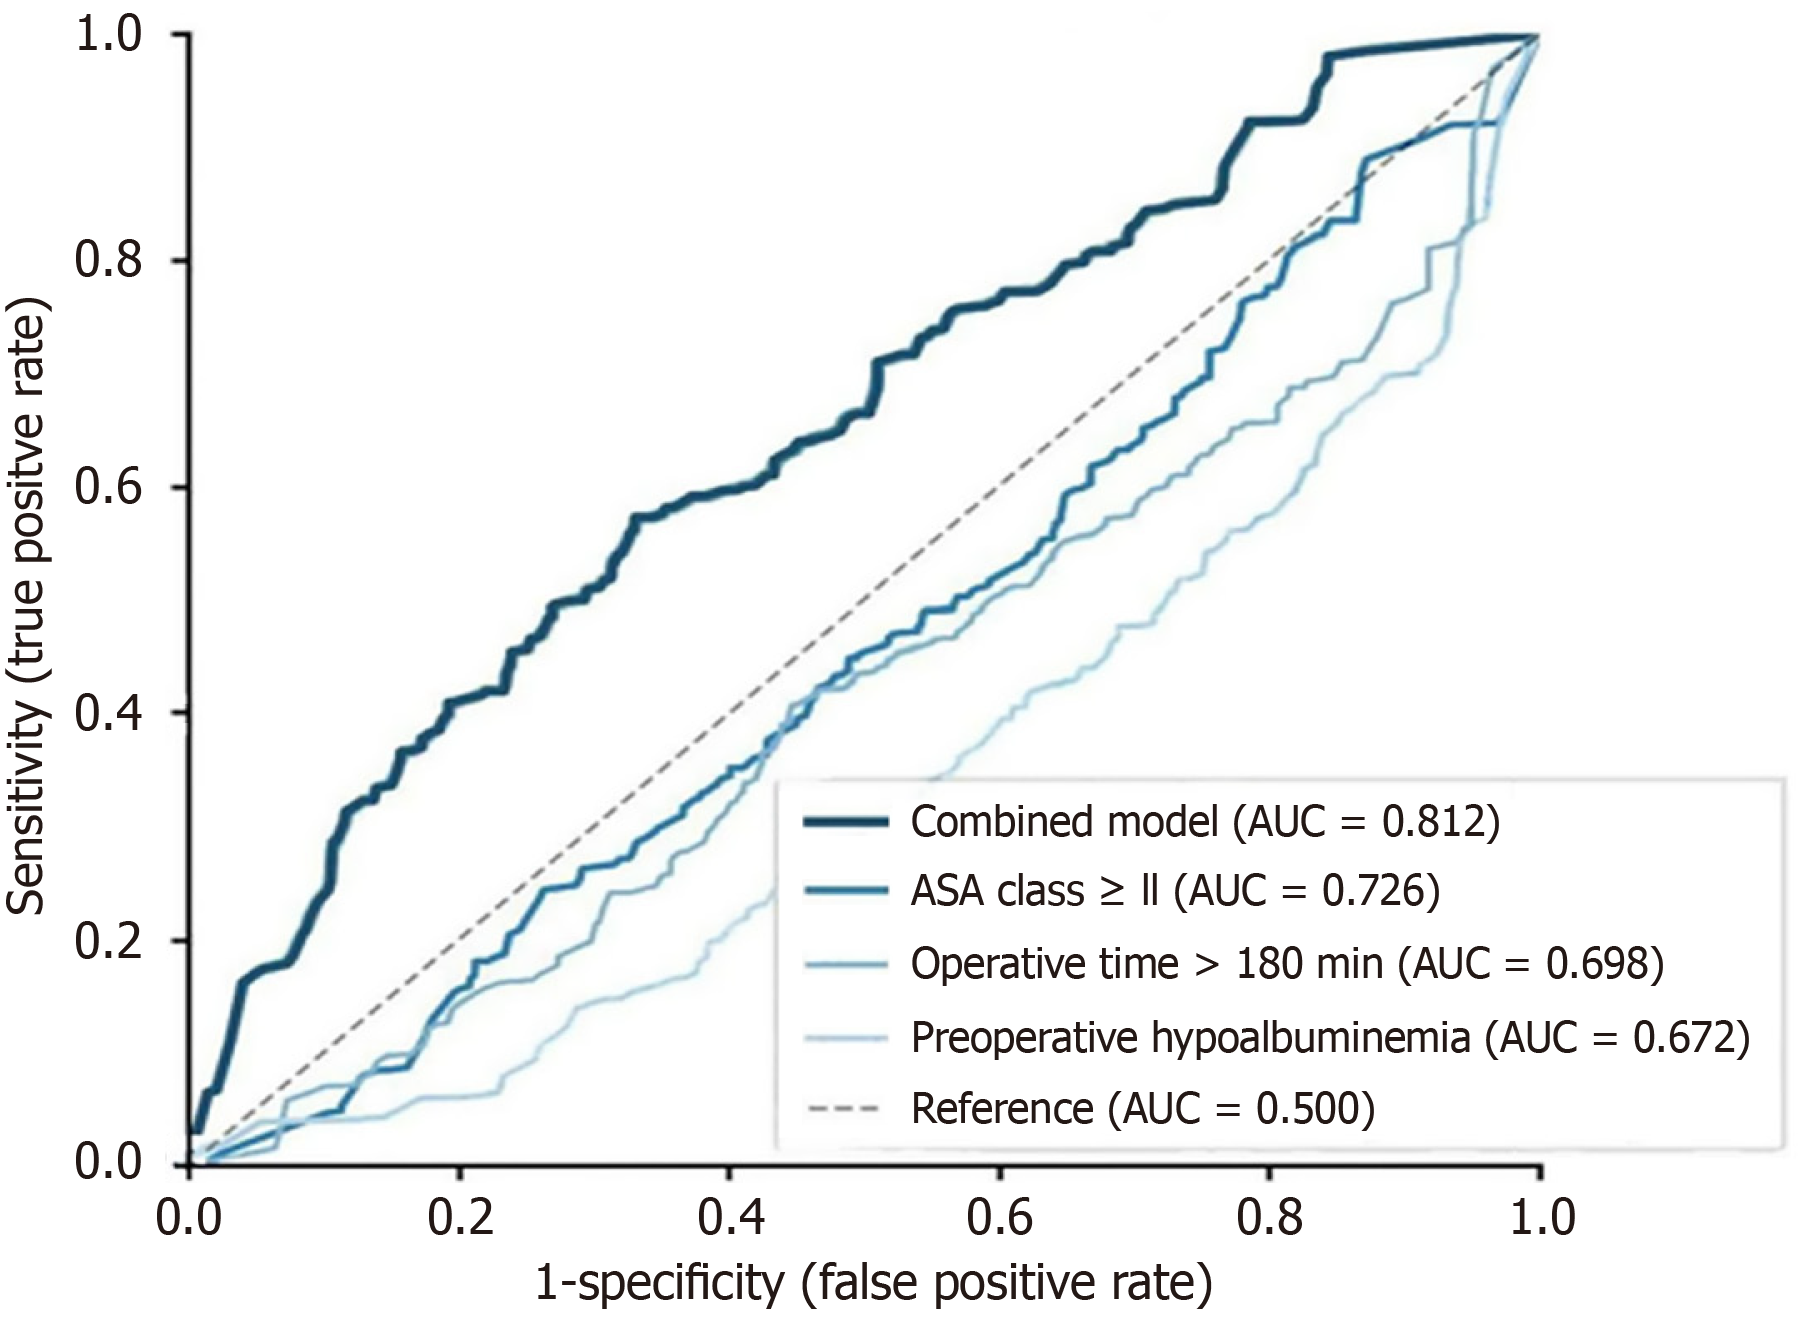
Figure 1 Receiver operating characteristic curves for independent predictors of postoperative sepsis.
Receiver operating characteristic curves for the combined multivariable model (AUC = 0.812, 95% confidence interval: 0.742–0.882) and each individual independent predictor: ASA class ≥ III (AUC = 0.726), operative time > 180 minutes (AUC = 0.698), and preoperative hypoalbuminemia (AUC = 0.672). The diagonal dashed line represents the reference classifier (AUC = 0.500). The combined model demonstrated a sensitivity of 76.2%, specificity of 74.4%, positive predictive value of 47.1%, and negative predictive value of 91.4%. ASA: American Society of Anesthesiologists; AUC: Area under the curve.
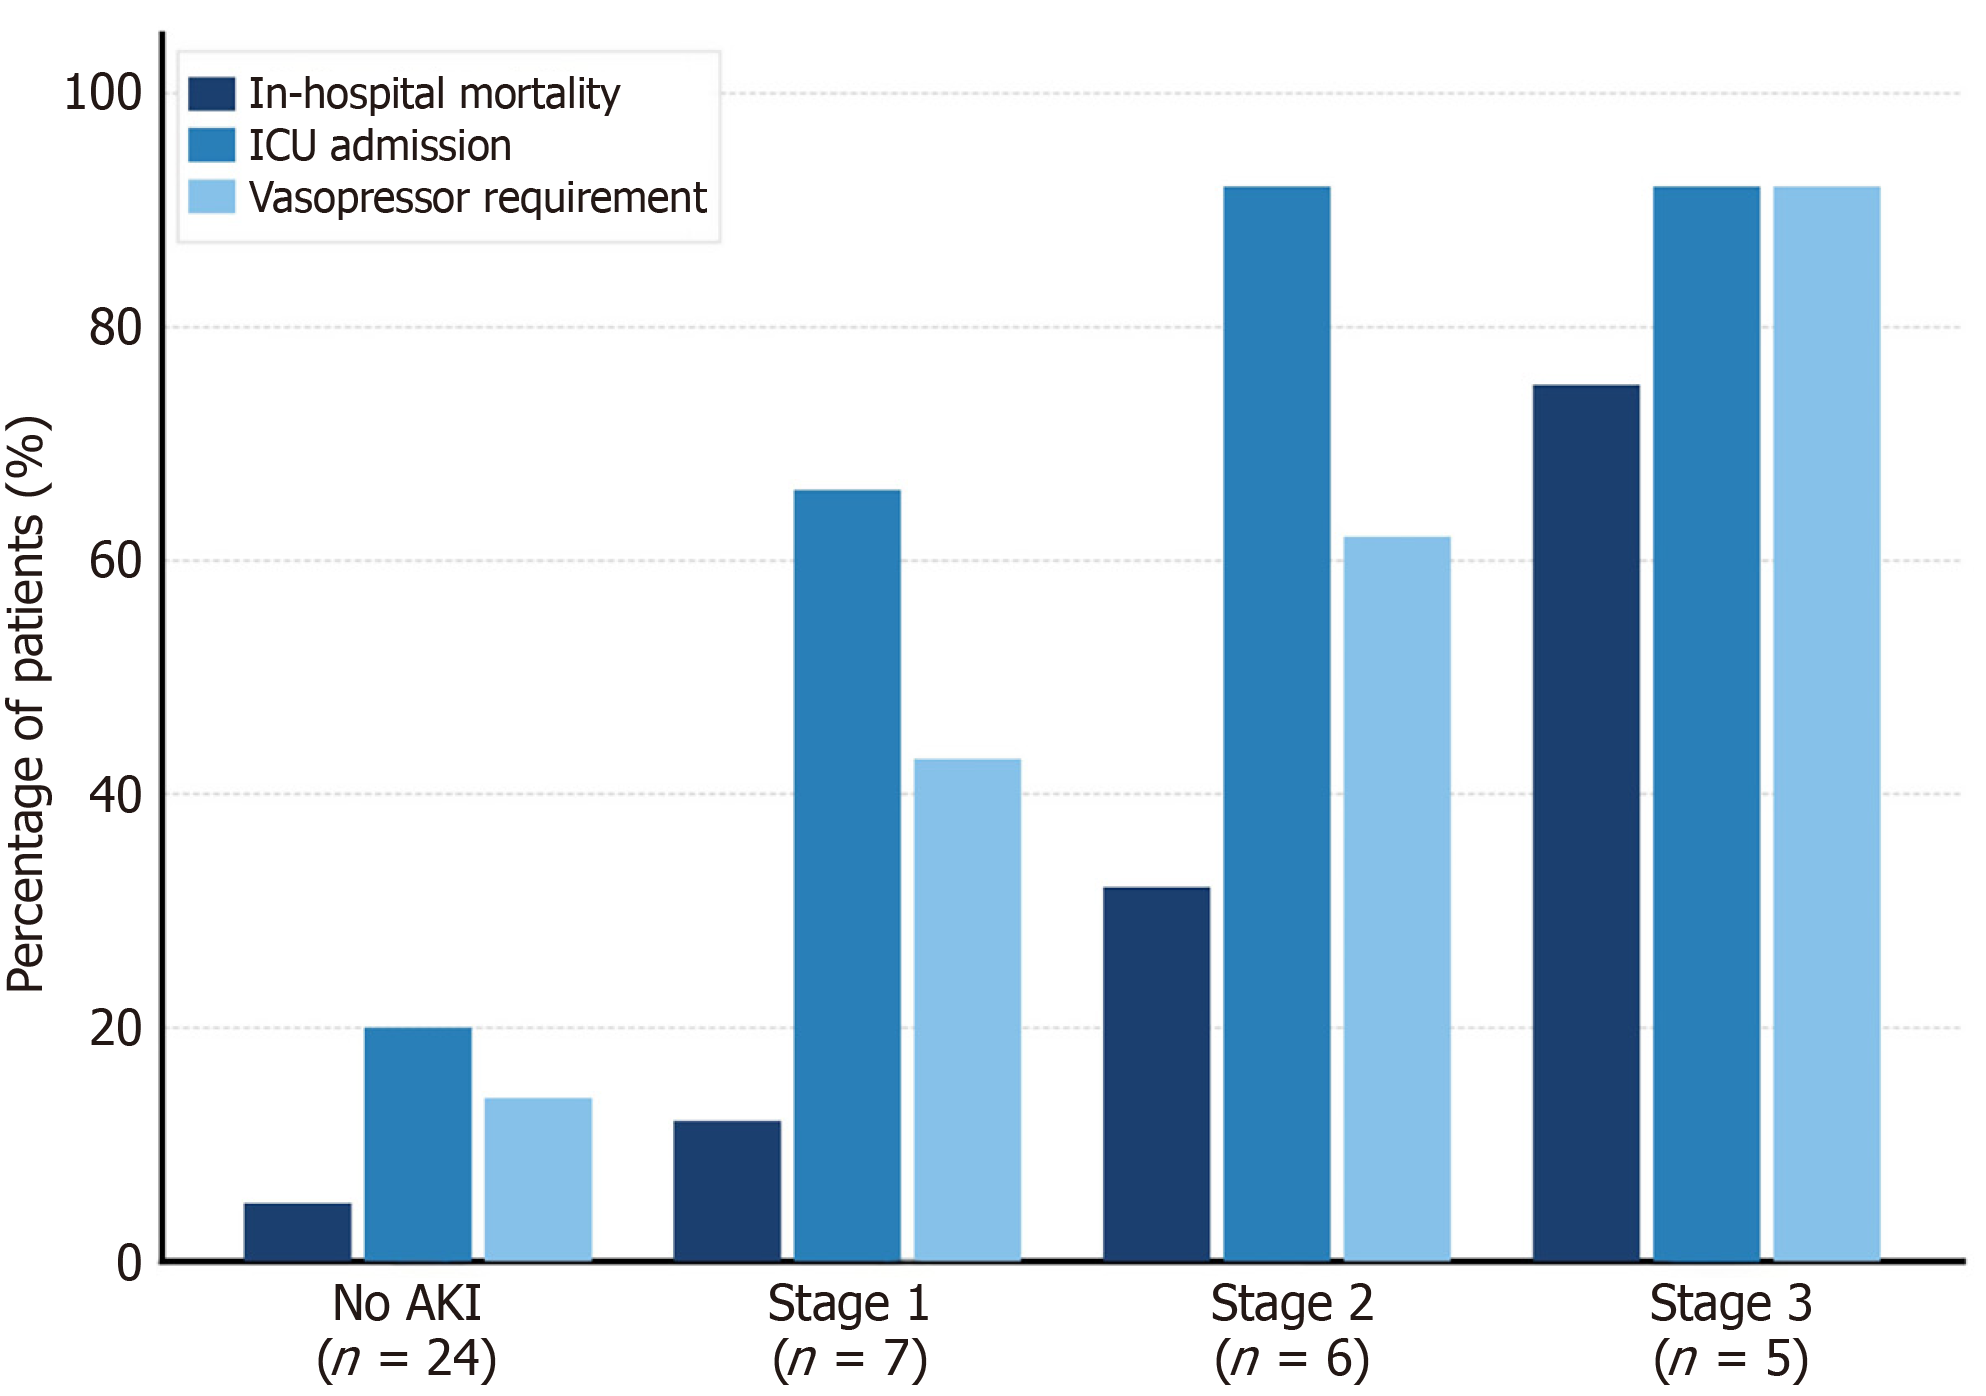
Figure 2 Clinical outcomes stratified by Kidney Disease: Improving Global Outcomes acute kidney injury stage among patients with sepsis (n = 42).
Grouped bar chart comparing in-hospital mortality, ICU admission rate, and vasopressor requirement across 4 groups: No AKI (n = 24), AKI stage 1 (n = 7), AKI stage 2 (n = 6), and AKI stage 3 (n = 5). In-hospital mortality increased incrementally with AKI stage: 0.0%, 14.3%, 33.3%, and 80.0% for stages 0–3, respectively (P < 0.001). AKI: Acute kidney injury; ICU: Intensive care unit.
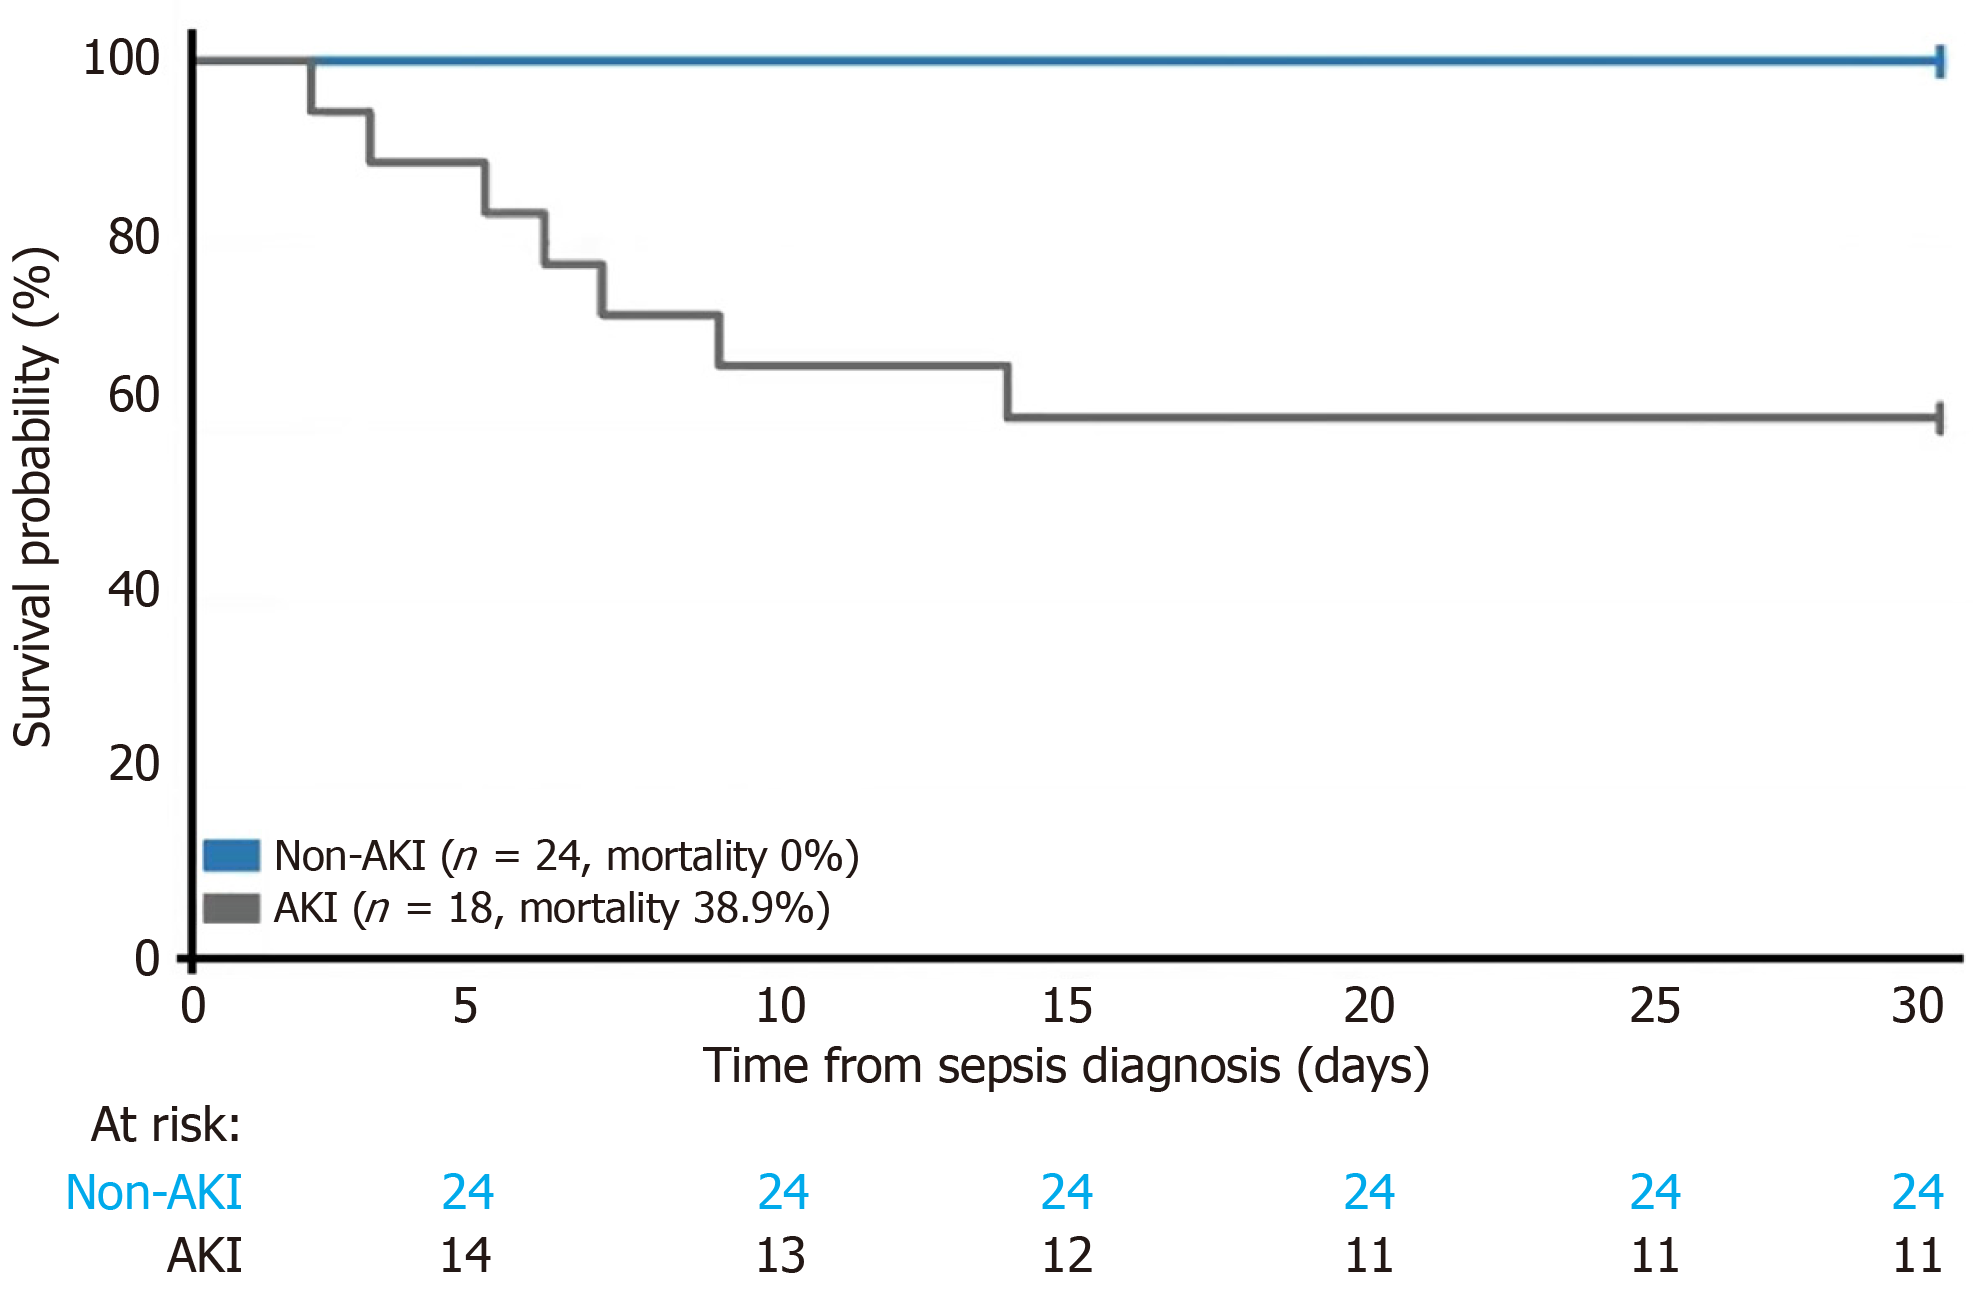
Figure 3 Kaplan–Meier in-hospital survival curves comparing patients with vs without acute kidney injury among patients with sepsis.
Kaplan–Meier curves illustrate in-hospital survival probability over 30 days following sepsis diagnosis in patients with AKI (n = 18) vs without AKI (n = 24). All 7 in-hospital deaths occurred in the AKI subgroup (mortality 38.9% vs 0.0%). Numbers at risk at selected time points are shown below the x-axis. Log-rank test: P < 0.001. AKI: Acute kidney injury.
- Citation: Yu H, Xu JY, Zhang YR, Zhou XB, Zuo HR, Li Z. Prognostic factors of sepsis following laparoscopic hiatal hernia repair. World J Gastrointest Surg 2026; 18(8): 122207
- URL: https://www.wjgnet.com/1948-9366/full/v18/i8/122207.htm
- DOI: https://dx.doi.org/10.4240/wjgs.122207