
















Copyright: ©Author(s) 2026.
World J Gastrointest Surg. Aug 27, 2026; 18(8): 120491
Published online Aug 27, 2026. doi: 10.4240/wjgs.120491
Published online Aug 27, 2026. doi: 10.4240/wjgs.120491
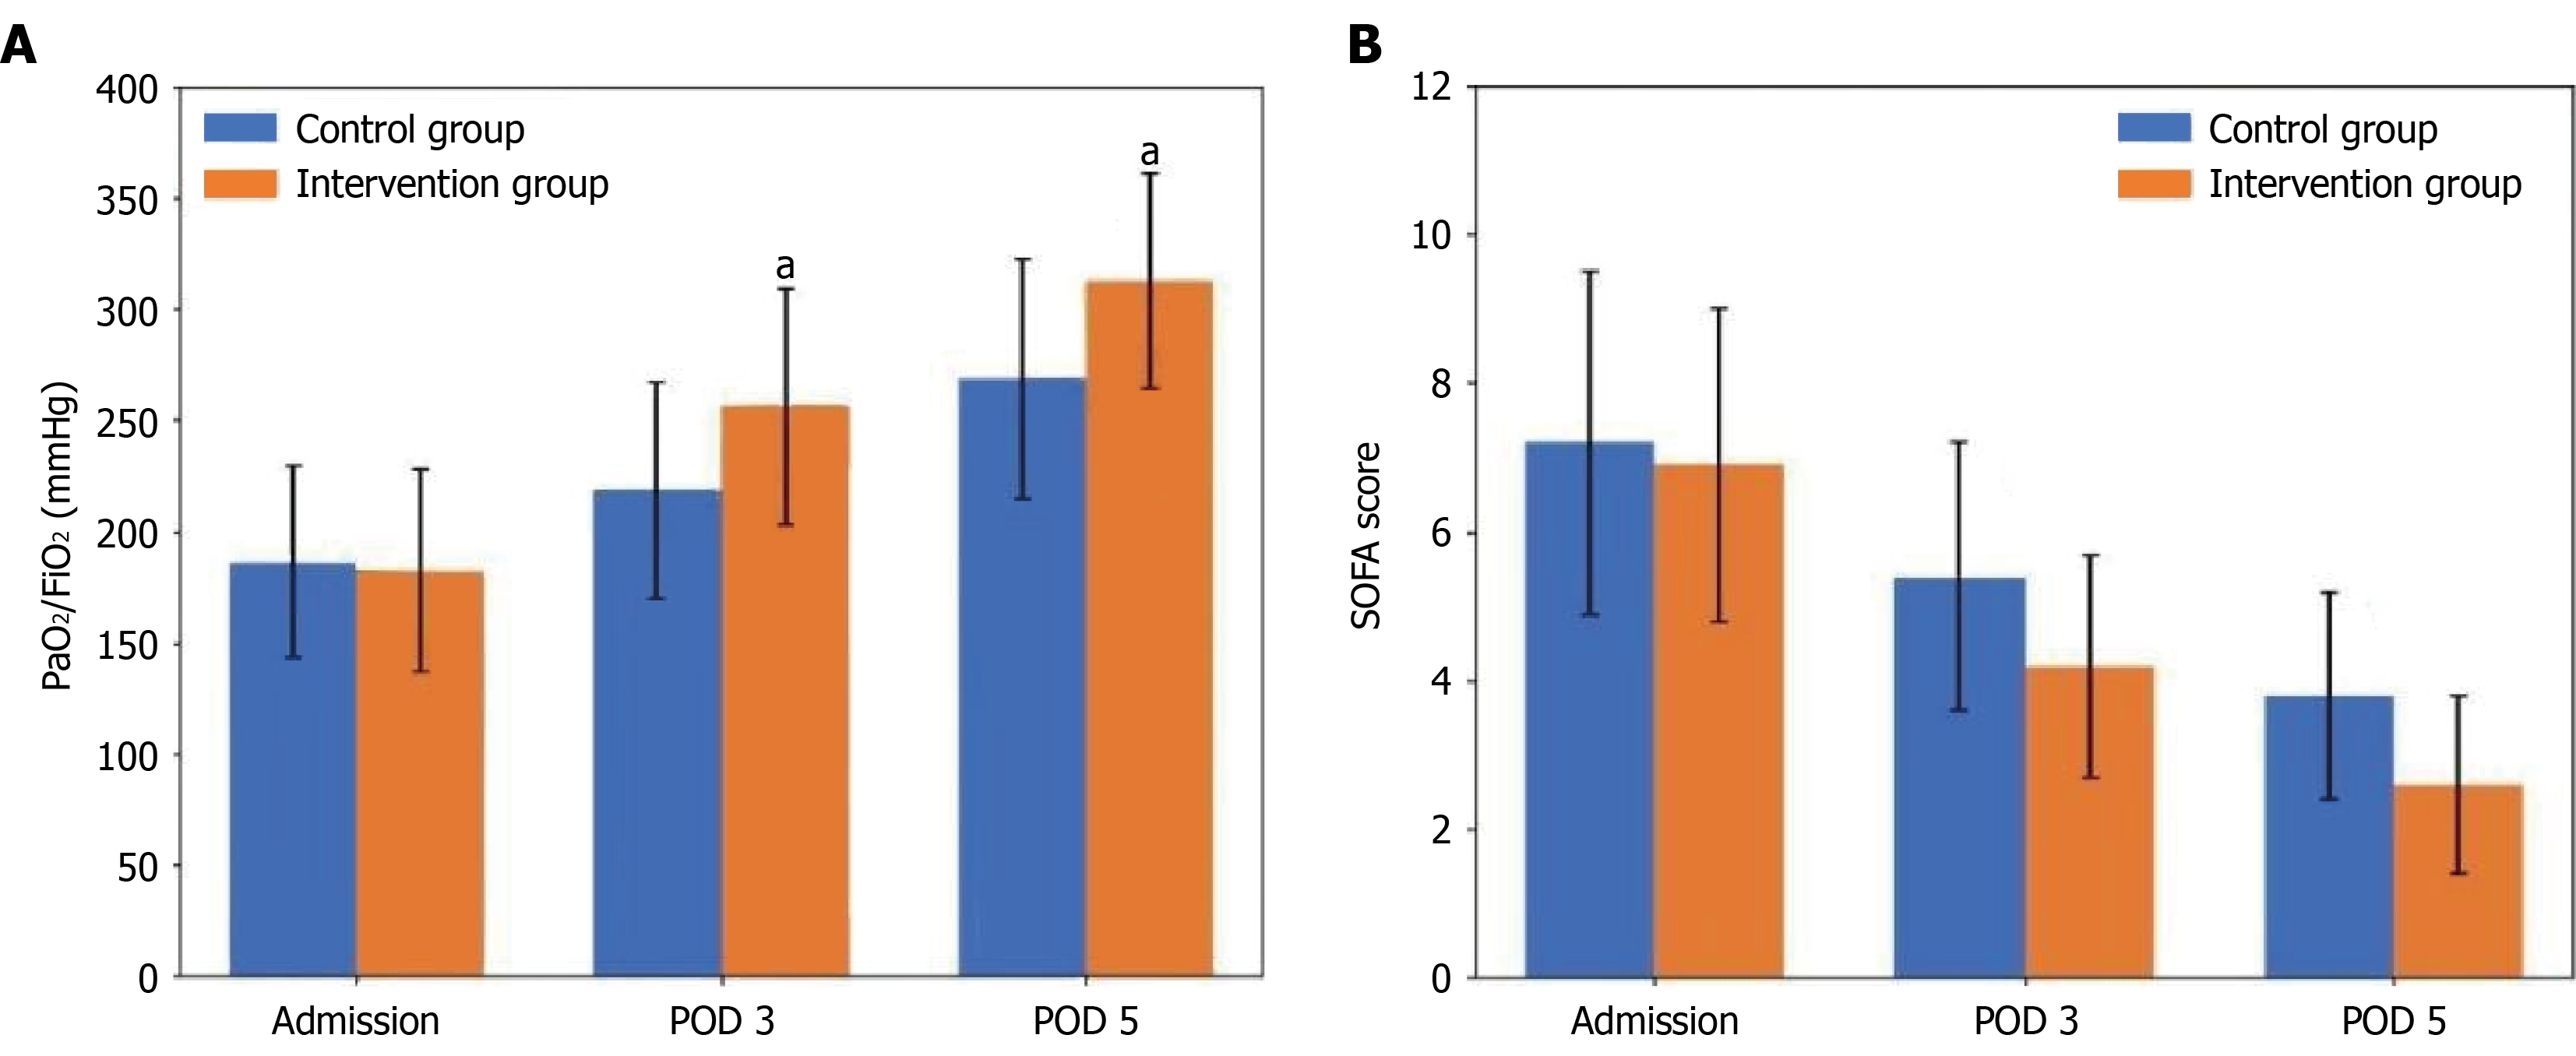
Figure 1 Dynamic changes of organ function indicators.
A: PaO2/FiO2 ratio changes over time showing significantly faster improvement in the intervention group; B: Sequential Organ Failure Assessment score changes demonstrating more rapid decline in the intervention group. aP < 0.01 vs control group. POD: Postoperative day; SOFA: Sequential Organ Failure Assessment.
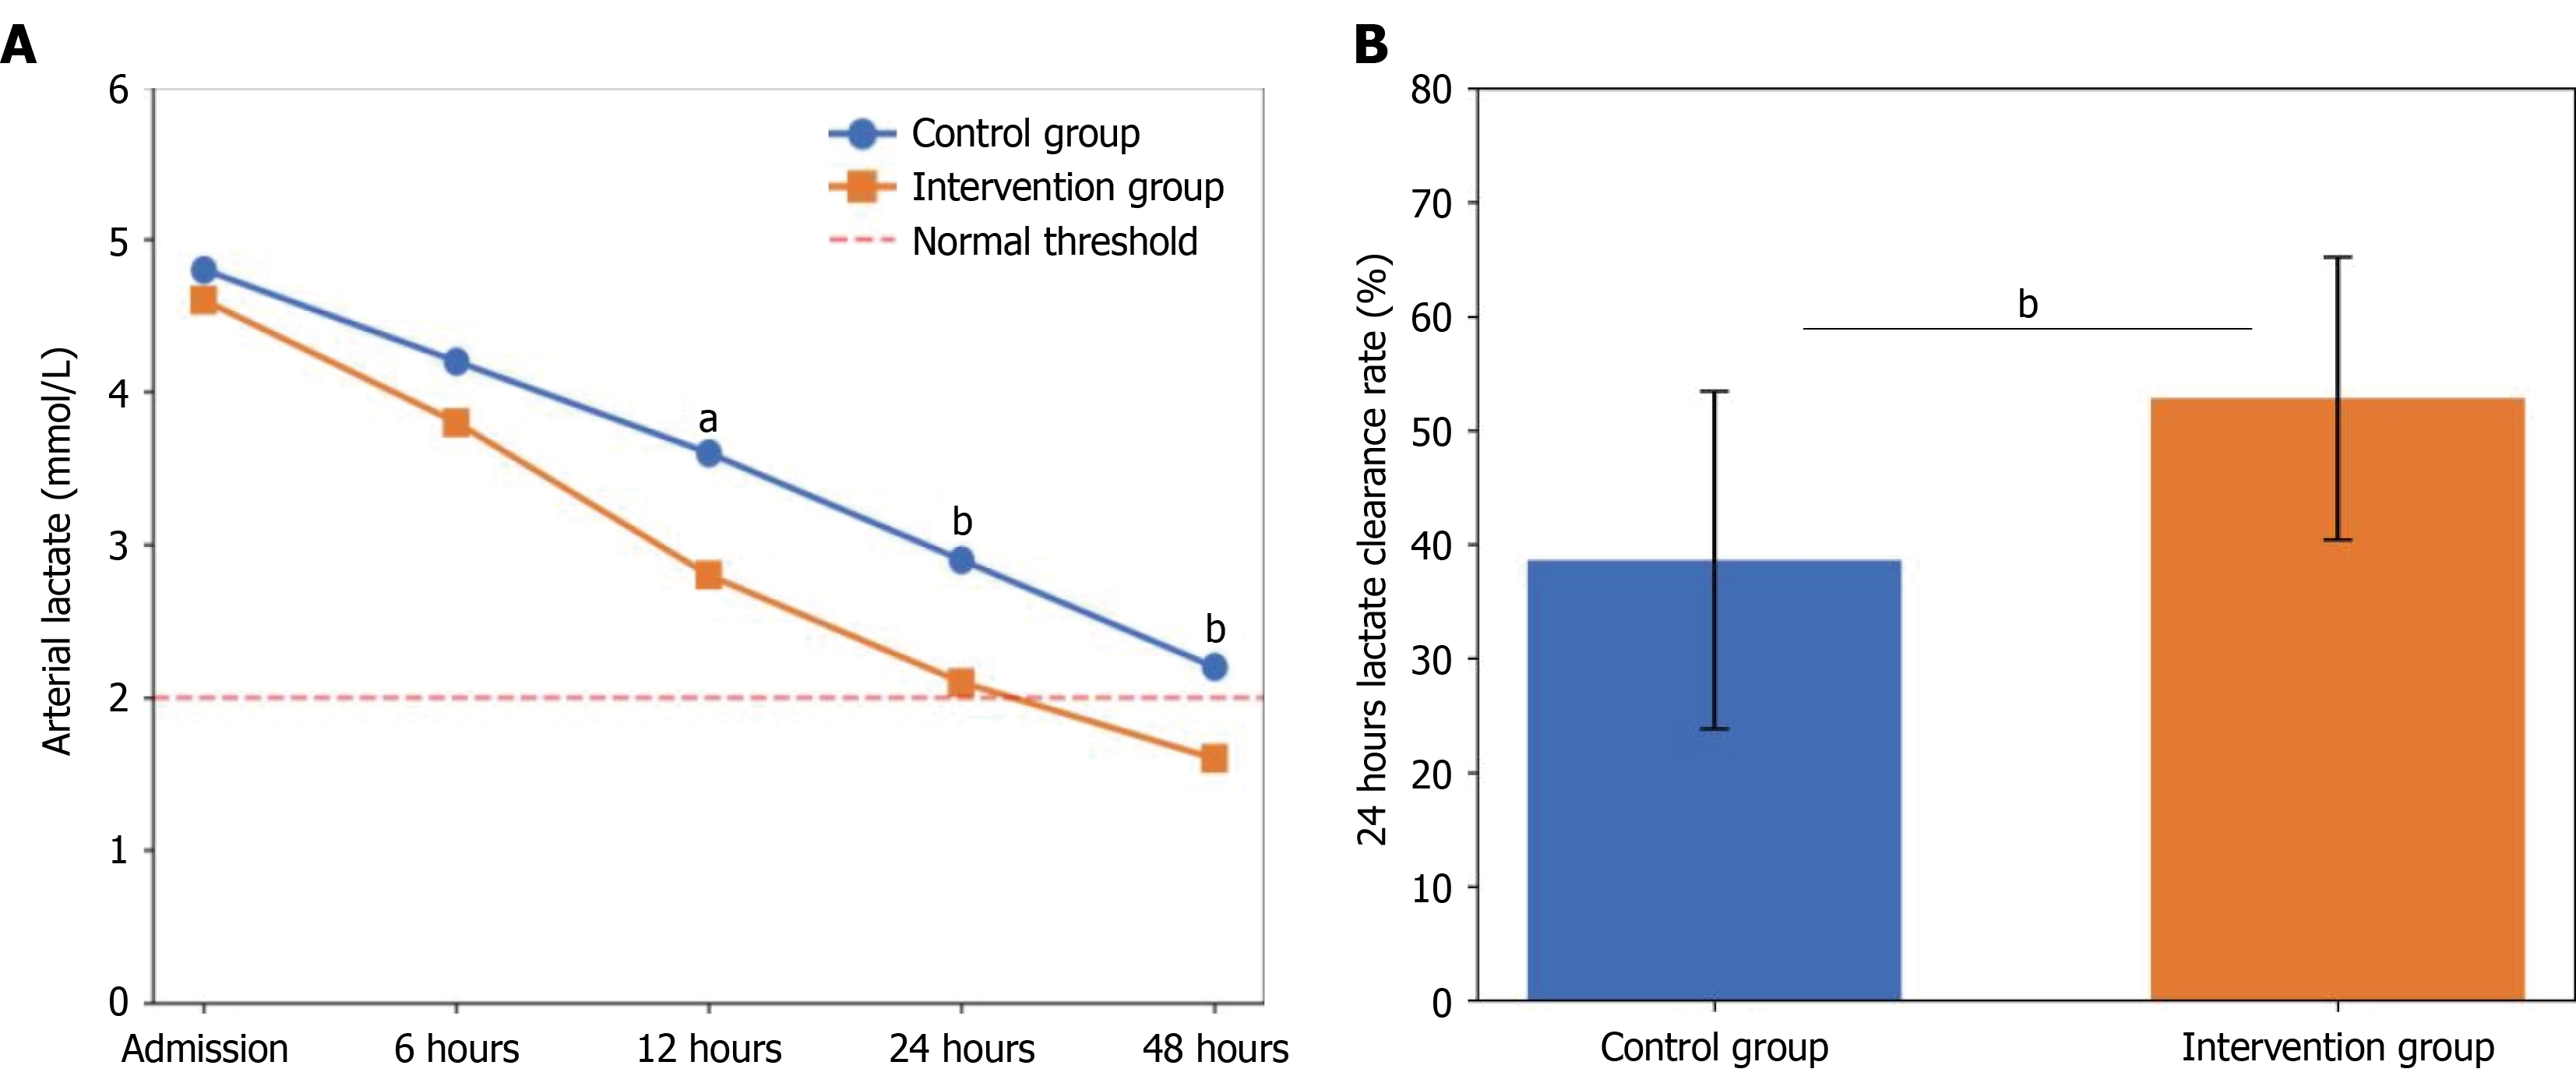
Figure 2 Dynamic changes of lactate metabolism.
A: Arterial lactate level changes over time showing significantly faster clearance in the intervention group; B: Comparison of 24-hour lactate clearance rates between the two groups. aP < 0.01, bP < 0.001 vs control group.
- Citation: Men LC, Wang LZ, Ma CY, Zhang Y, Han Y. Oxycodone-dexmedetomidine vs fentanyl analgesia in septic patients after gastric perforation surgery. World J Gastrointest Surg 2026; 18(8): 120491
- URL: https://www.wjgnet.com/1948-9366/full/v18/i8/120491.htm
- DOI: https://dx.doi.org/10.4240/wjgs.120491