
















Copyright: ©Author(s) 2026.
World J Gastrointest Surg. Oct 27, 2026; 18(10): 120648
Published online Oct 27, 2026. doi: 10.4240/wjgs.120648
Published online Oct 27, 2026. doi: 10.4240/wjgs.120648
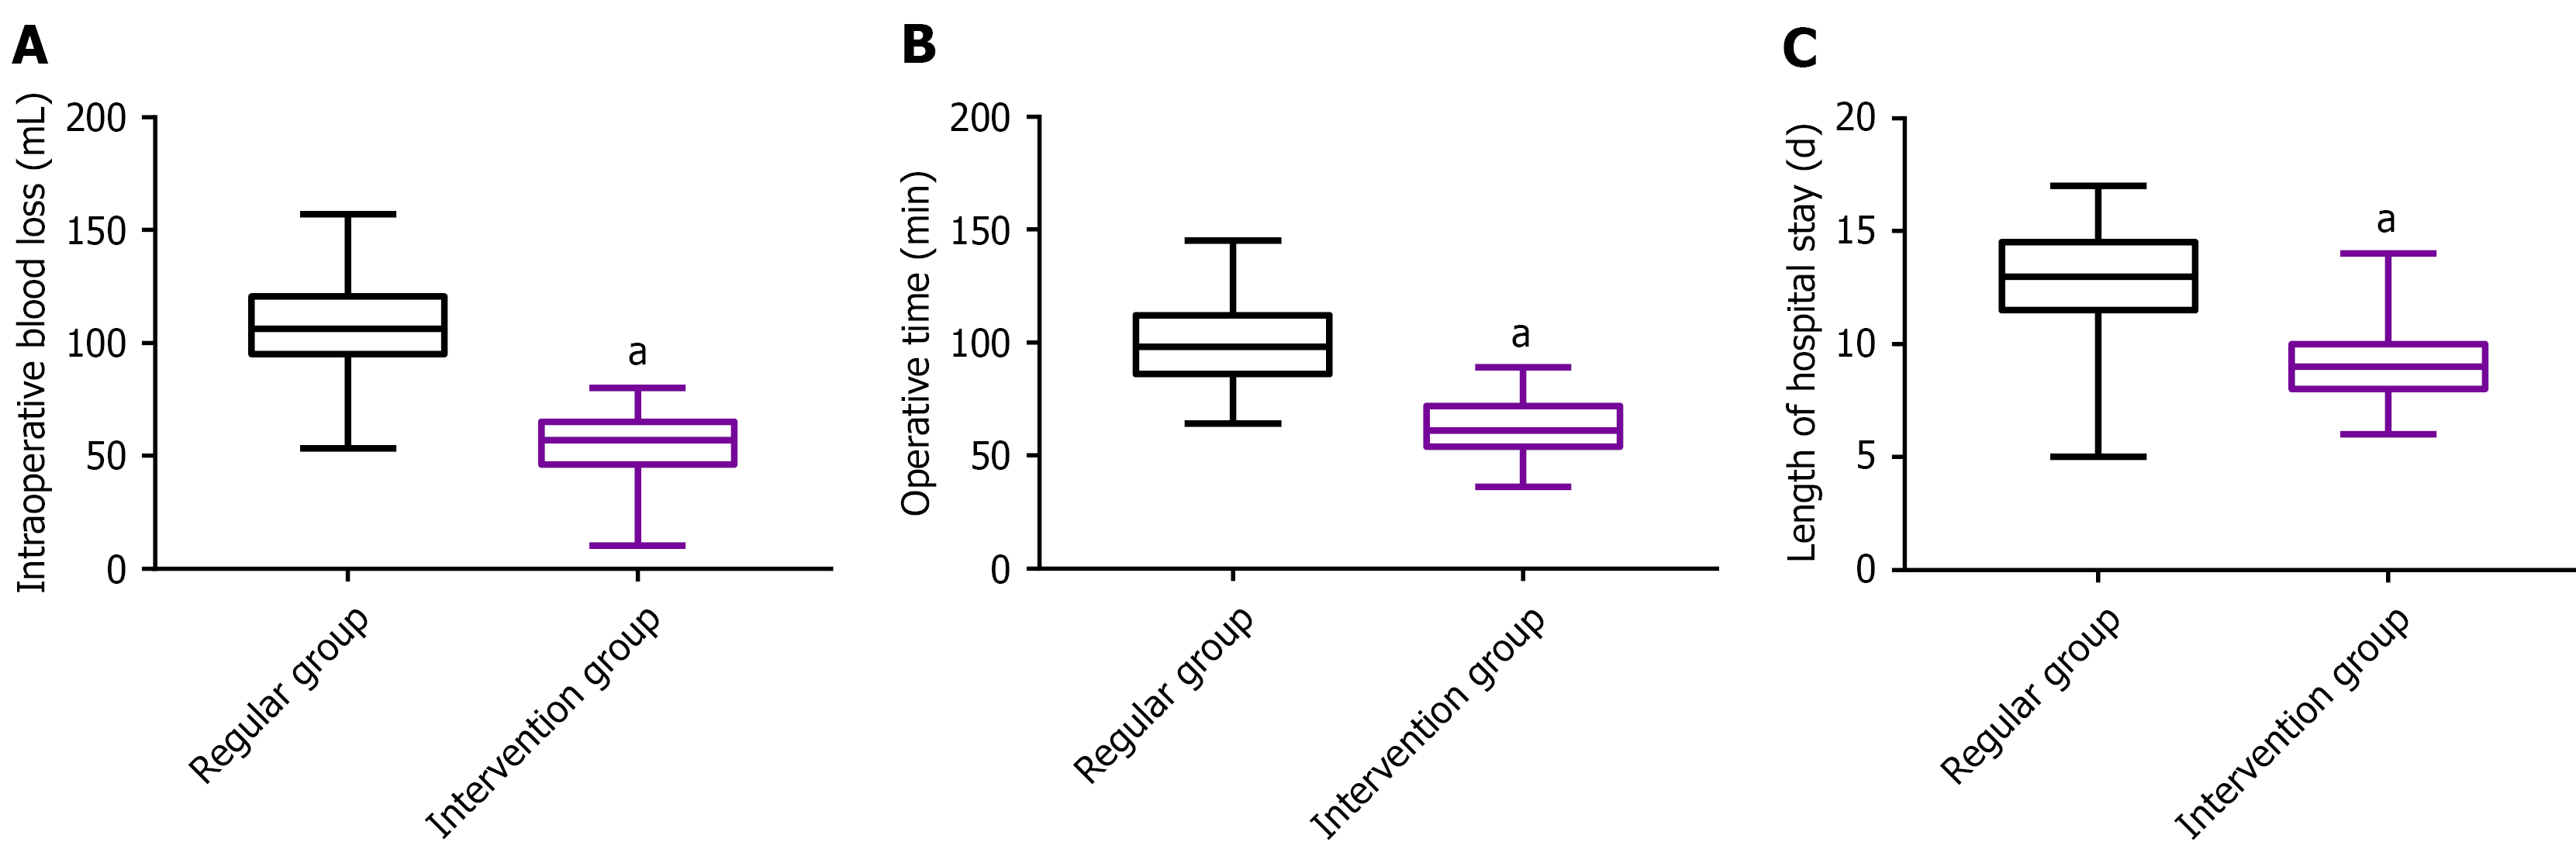
Figure 1 Perioperative indicators.
A: Effects of the two management models on intraoperative bleeding volume; B: Effects of the two management models on operation time; C: Effects of the two management models on hospitalization time. aP < 0.05.
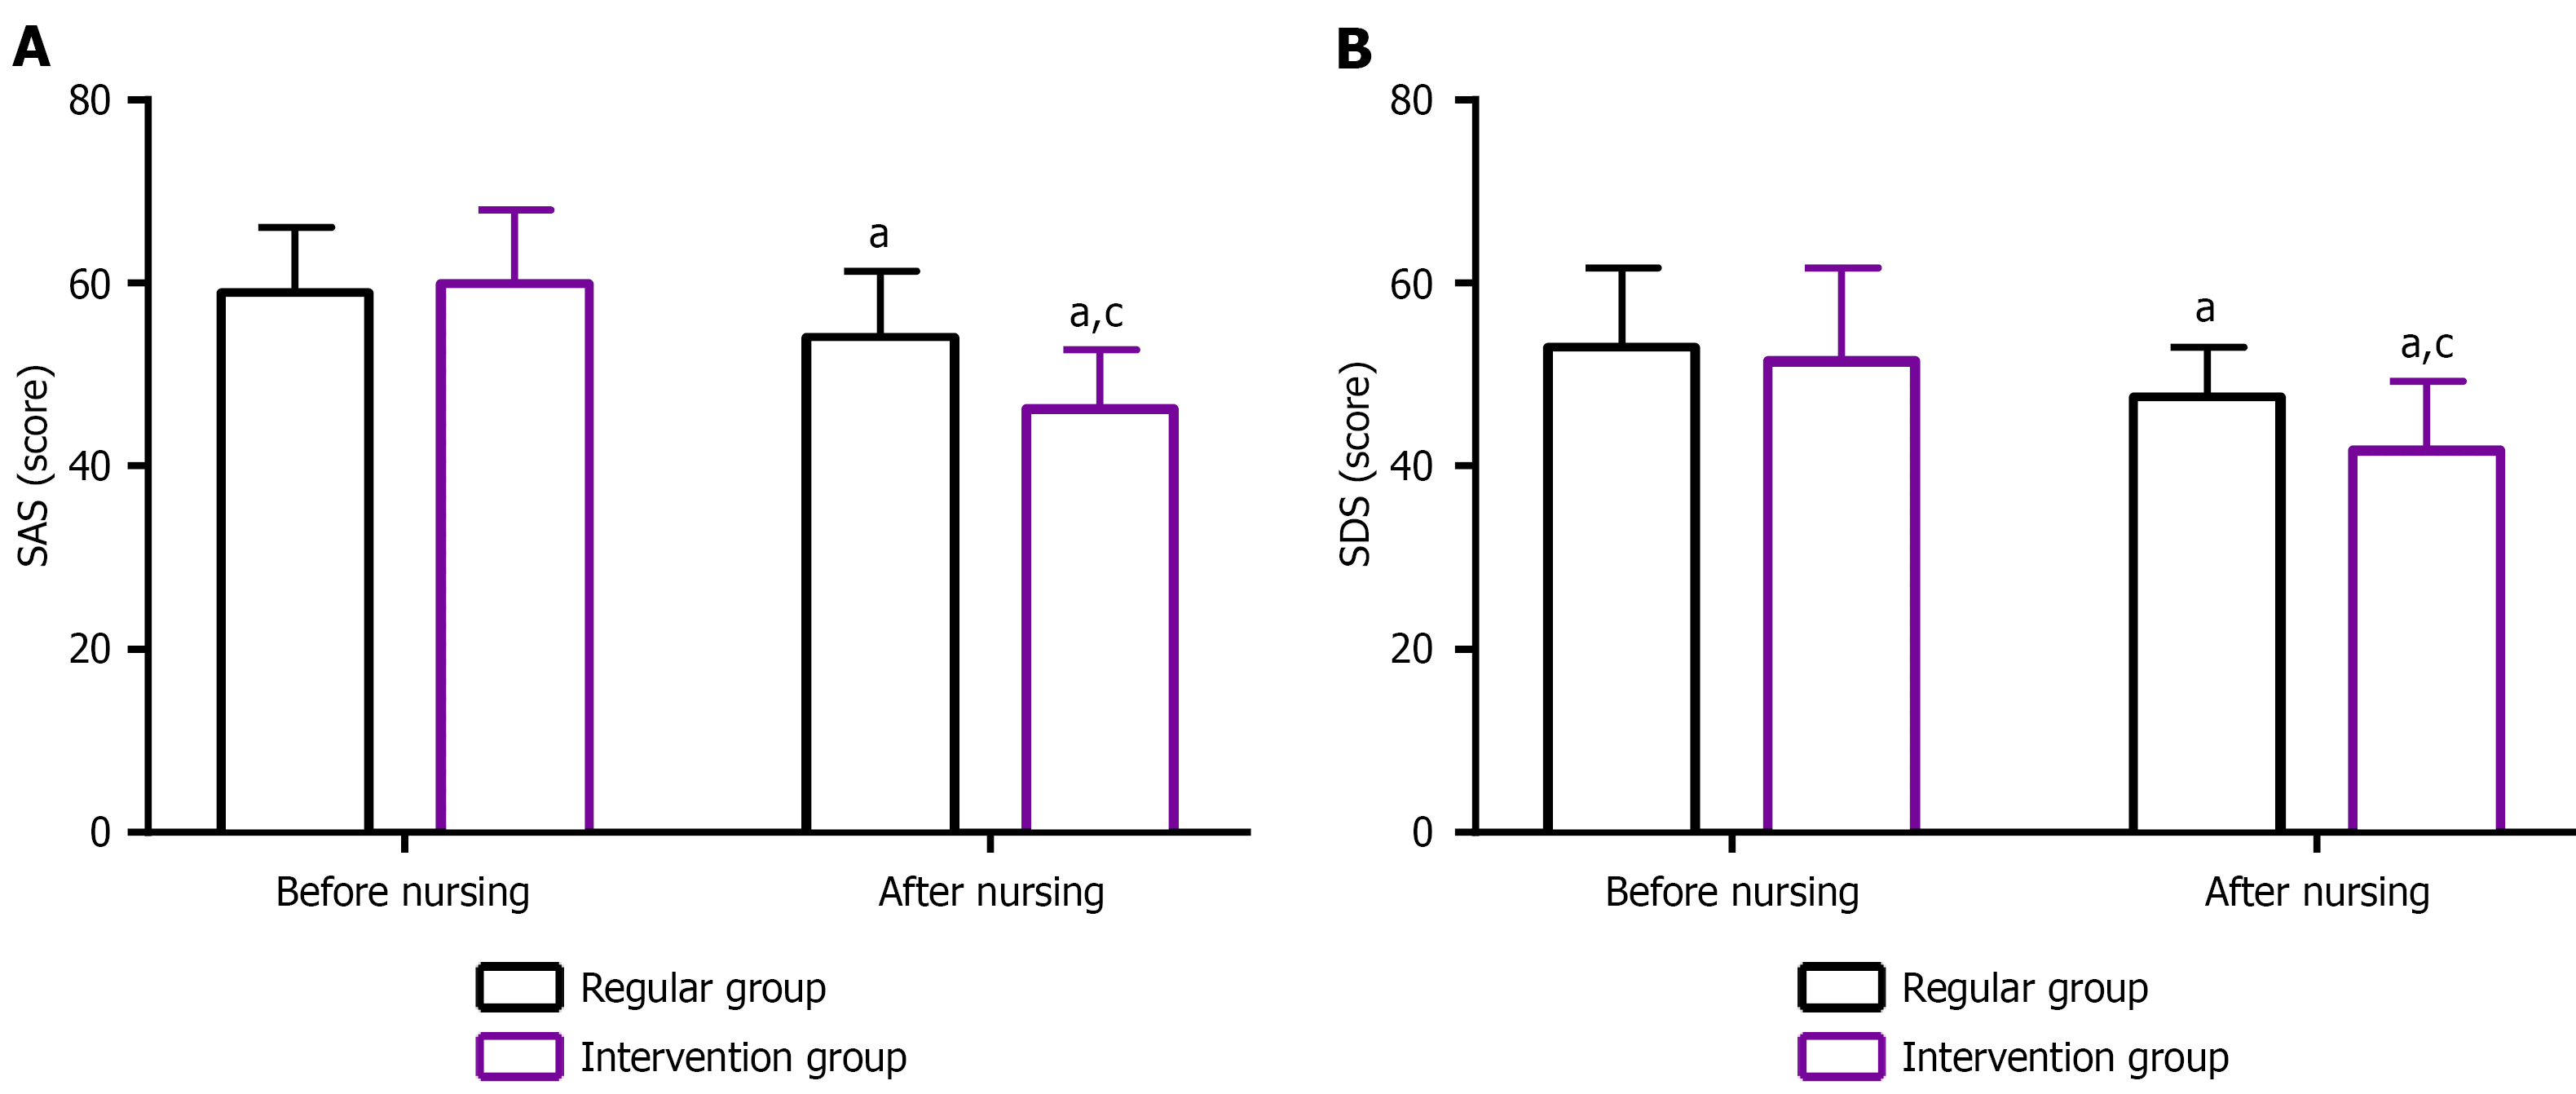
Figure 2 Self-Rating Anxiety Scale and Self-Rating Depression Scale scores.
A: Effects of the two management models on Self-Rating Anxiety Scale scores; B: Effects of the two management models on Self-Rating Depression Scale scores. aP < 0.05 vs before nursing, cP < 0.05 vs the regular group. SAS: Self-Rating Anxiety Scale; SDS: Self-Rating Depression Scale.
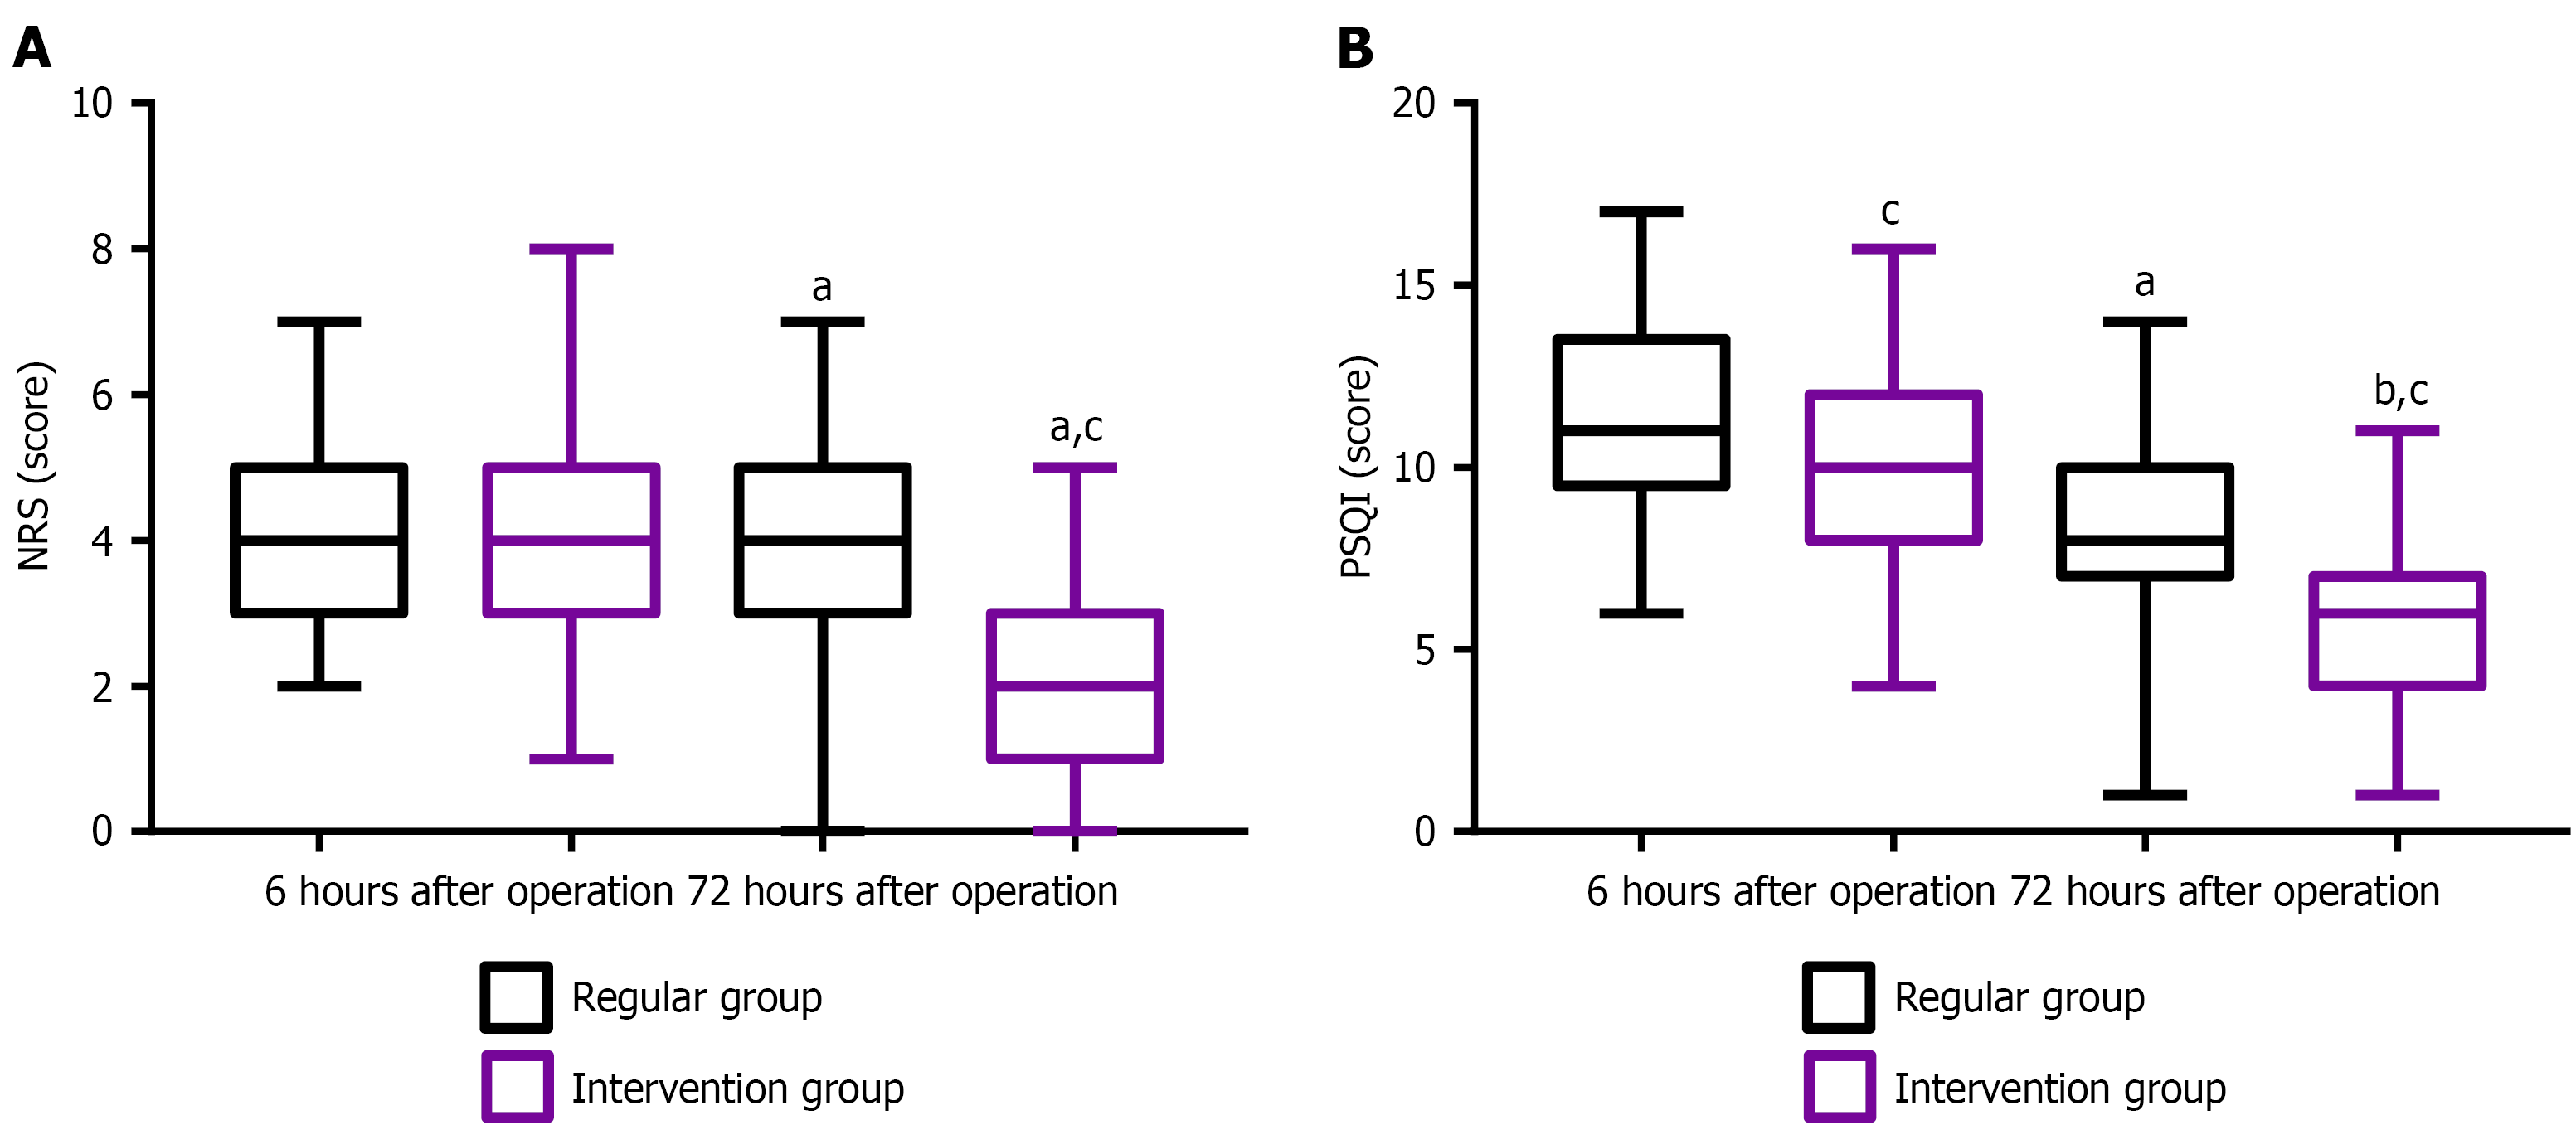
Figure 3 Numeric Rating Scale and Pittsburgh Sleep Quality Index scores.
A: Effects of the two management models on Numeric Rating Scale scores; B: Effects of the two management models on Pittsburgh Sleep Quality Index scores. aP < 0.05, bP < 0.05 vs 6 hours post-operation, and cP < 0.05 vs the regular group.
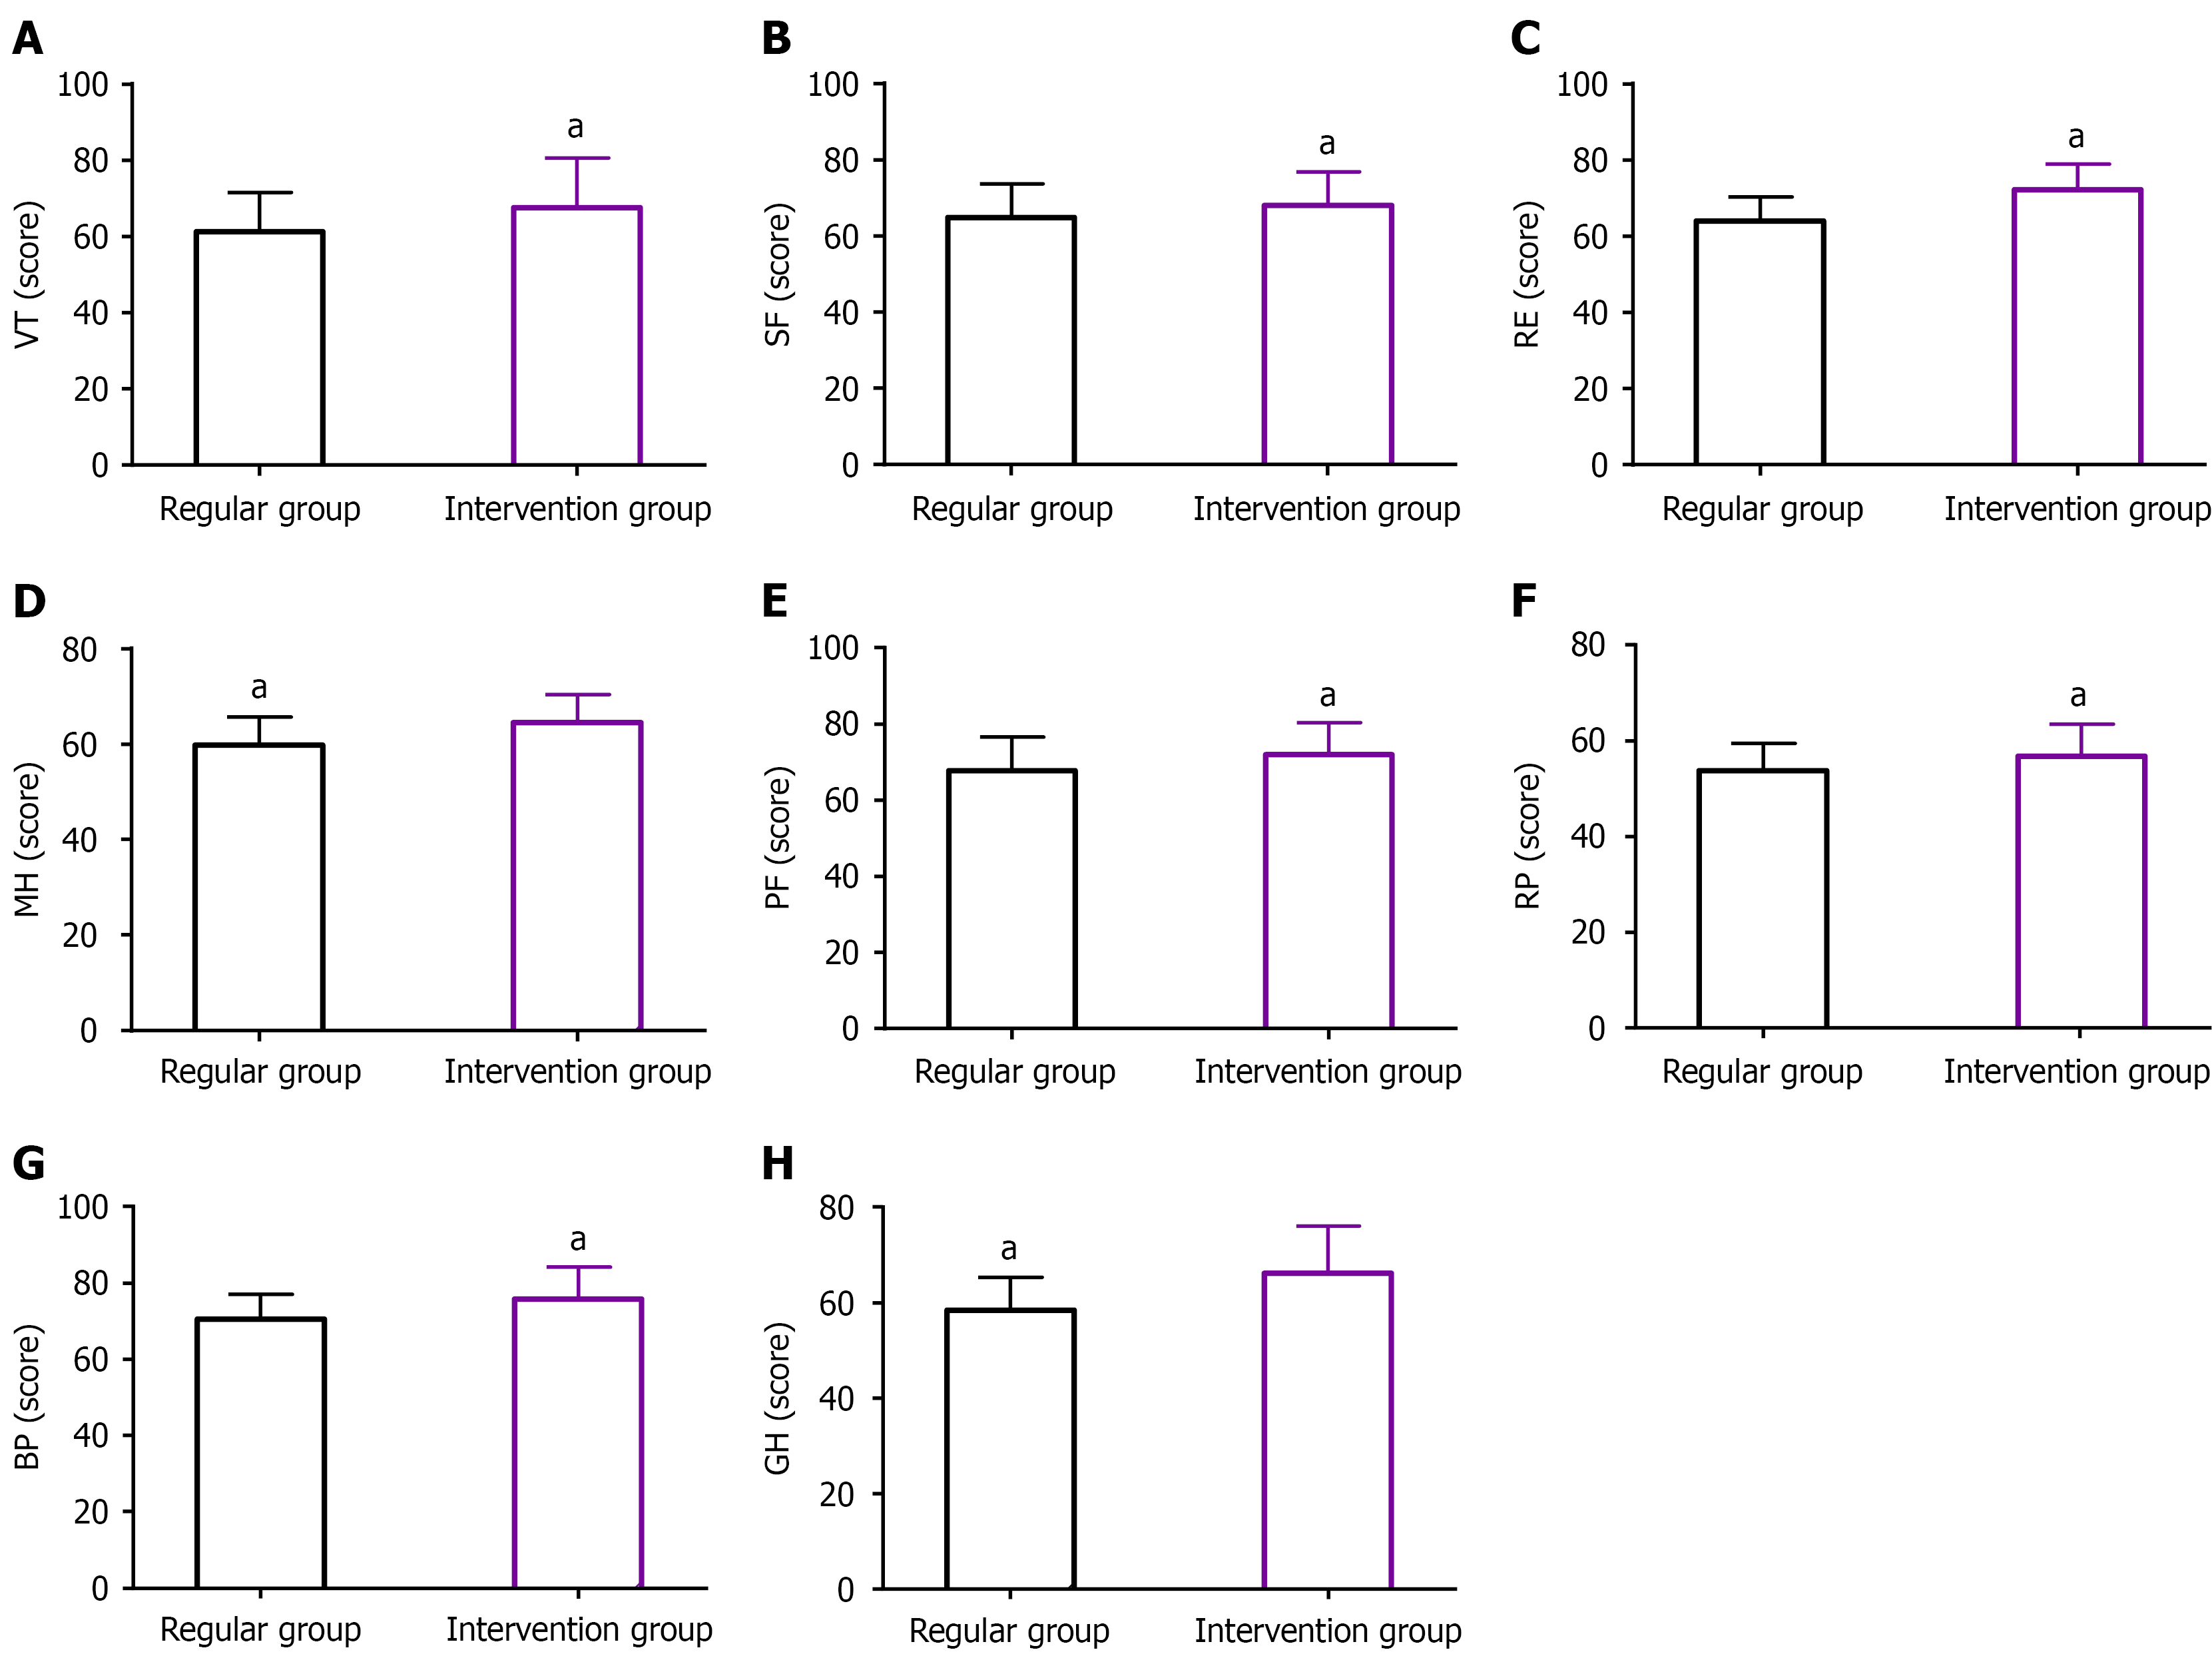
Figure 4 Short-Form 36 Item Health Survey scores.
A: Effects of the two management models on vitality; B: Effects of the two management models on social functioning; C: Effects of the two management models on role emotional; D: Effects of the two management models on mental health; E: Effects of the two management models on physical functioning; F: Effects of the two management models on role physical; G: Effects of the two management models on bodily pain; H: Effects of the two management models on general health. aP < 0.05. VT: Vitality; SF: Social functioning; RE: Role emotional; MH: Mental health; PF: Physical functioning; RP: Role physical; BP: Bodily pain; GH: General health.
- Citation: Lin JY, Fang XL, Chen H, Chen Q, Jiang X, Chen JE, Wu LJ. Whole-course flexible management model for endoscopic submucosal dissection-treated patients for early digestive tract cancer or pre-cancerous lesions: Efficacy and quality-of-life-impact. World J Gastrointest Surg 2026; 18(10): 120648
- URL: https://www.wjgnet.com/1948-9366/full/v18/i10/120648.htm
- DOI: https://dx.doi.org/10.4240/wjgs.120648