Copyright
©The Author(s) 2025.
World J Gastrointest Surg. Sep 27, 2025; 17(9): 107356
Published online Sep 27, 2025. doi: 10.4240/wjgs.v17.i9.107356
Published online Sep 27, 2025. doi: 10.4240/wjgs.v17.i9.107356
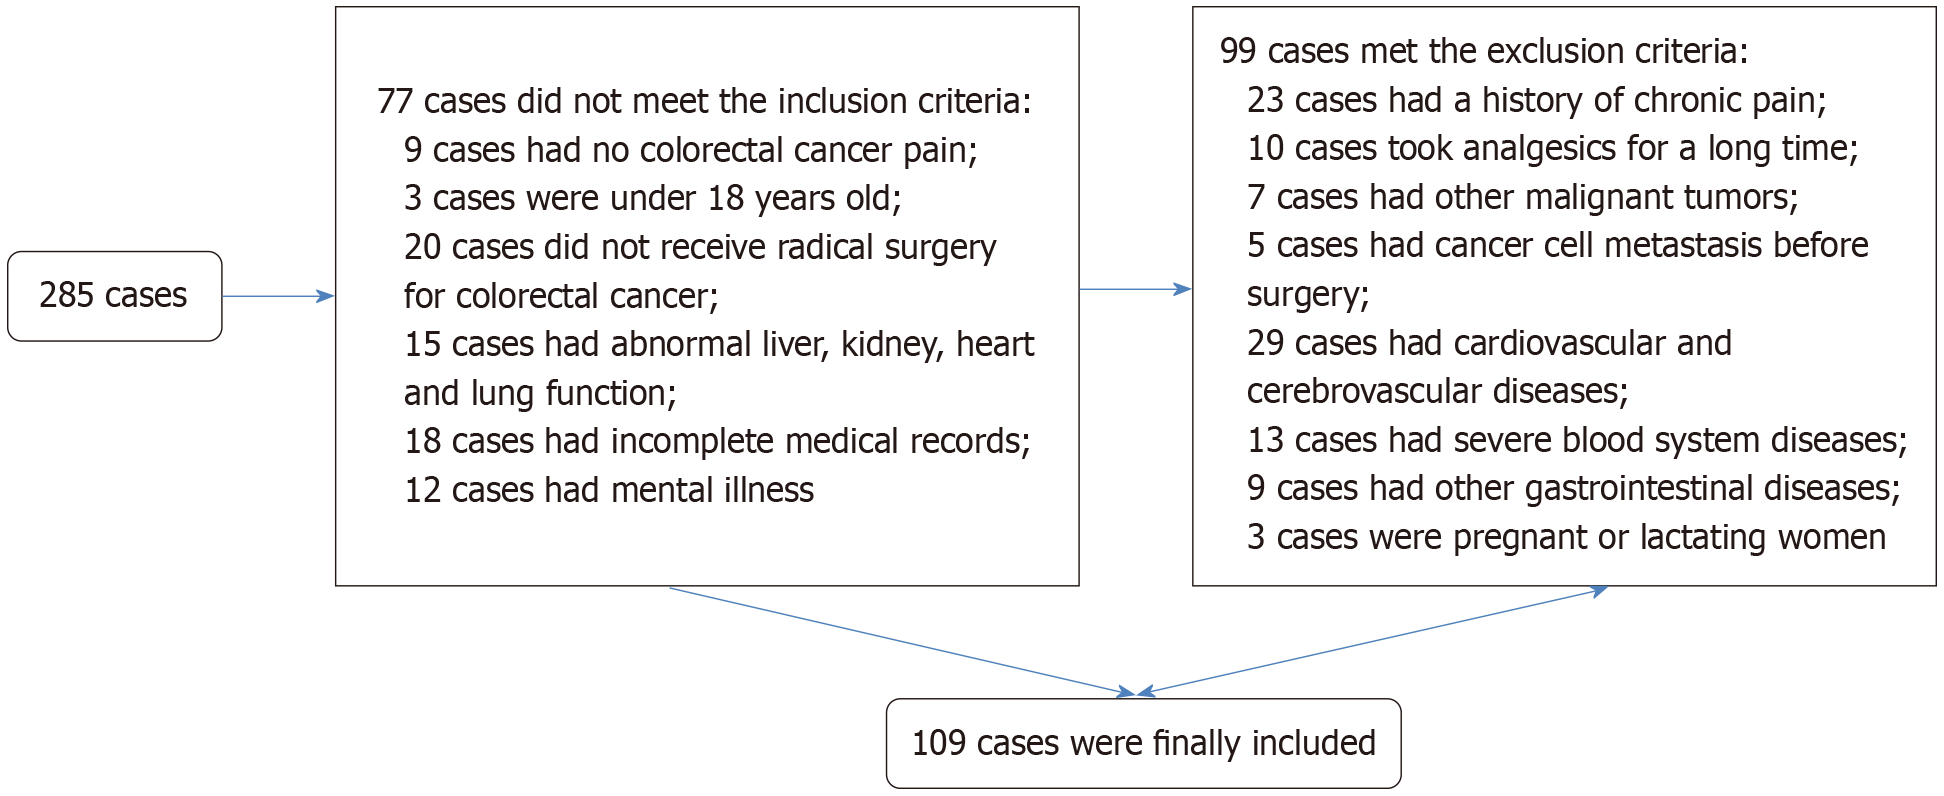
Figure 1
Flowchart of patient selection.
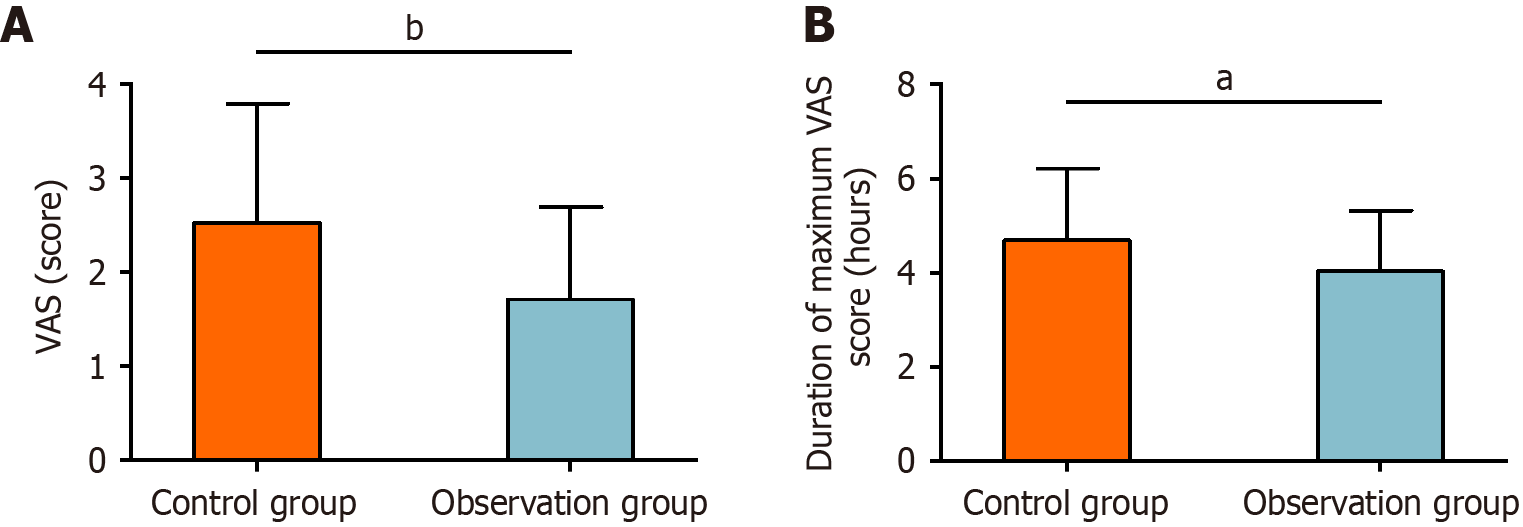
Figure 2 Postoperative pain of the two groups.
A: Visual Analogue Scale scores of the control and observation groups; B: Durations of maximum Visual Analogue Scale scores in the control and observation groups. aP < 0.05, bP < 0.01. VAS: Visual Analogue Scale.
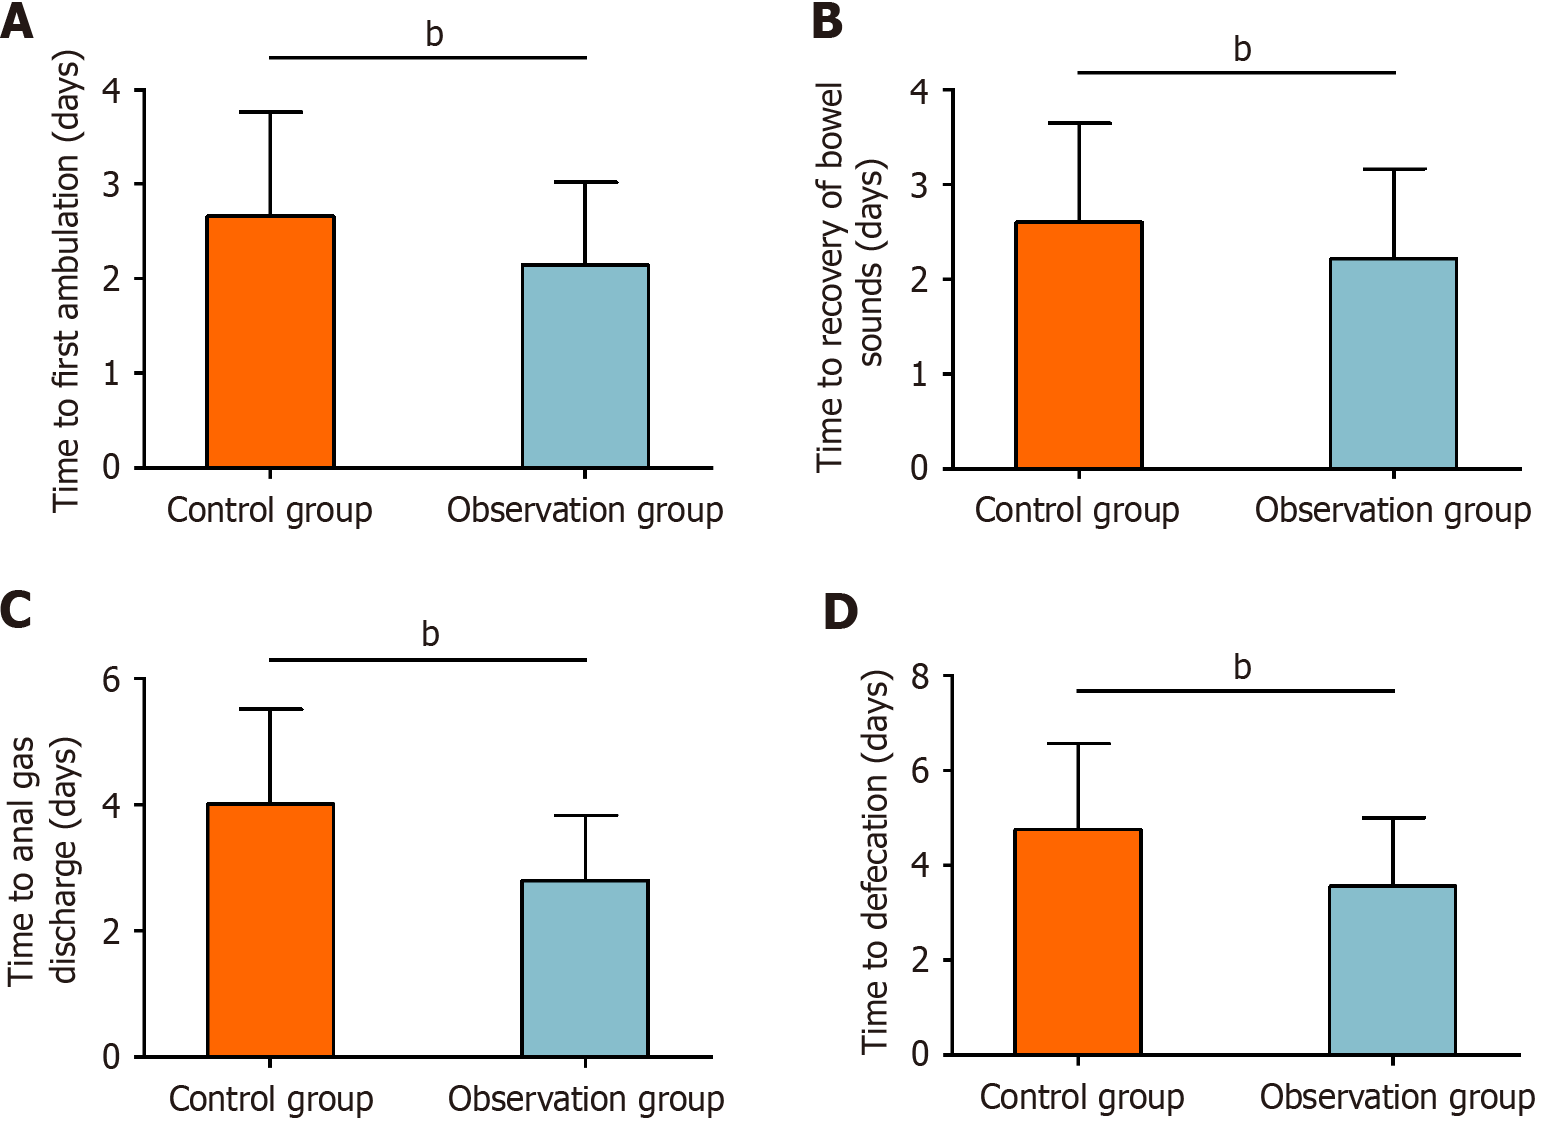
Figure 3 Functional recovery of the two groups.
A: Time to the first ambulation of the control and observation groups; B: Time to bowel sound recovery of the control and observation groups; C: Time to anal gas discharge of the control and observation groups; D: Time to defecation of the control and observation groups. bP < 0.01.
Figure 4 Sleep duration, sleep quality and hospital stay of the two groups.
A: Average sleep duration on postoperative day 3 of the control and observation groups; B: Pittsburgh Sleep Quality Index scores of the control and observation groups before and after the intervention; C: Lengths of hospital stay of the control and observation groups. aP < 0.05, bP < 0.01. PSQI: Pittsburgh Sleep Quality Index.
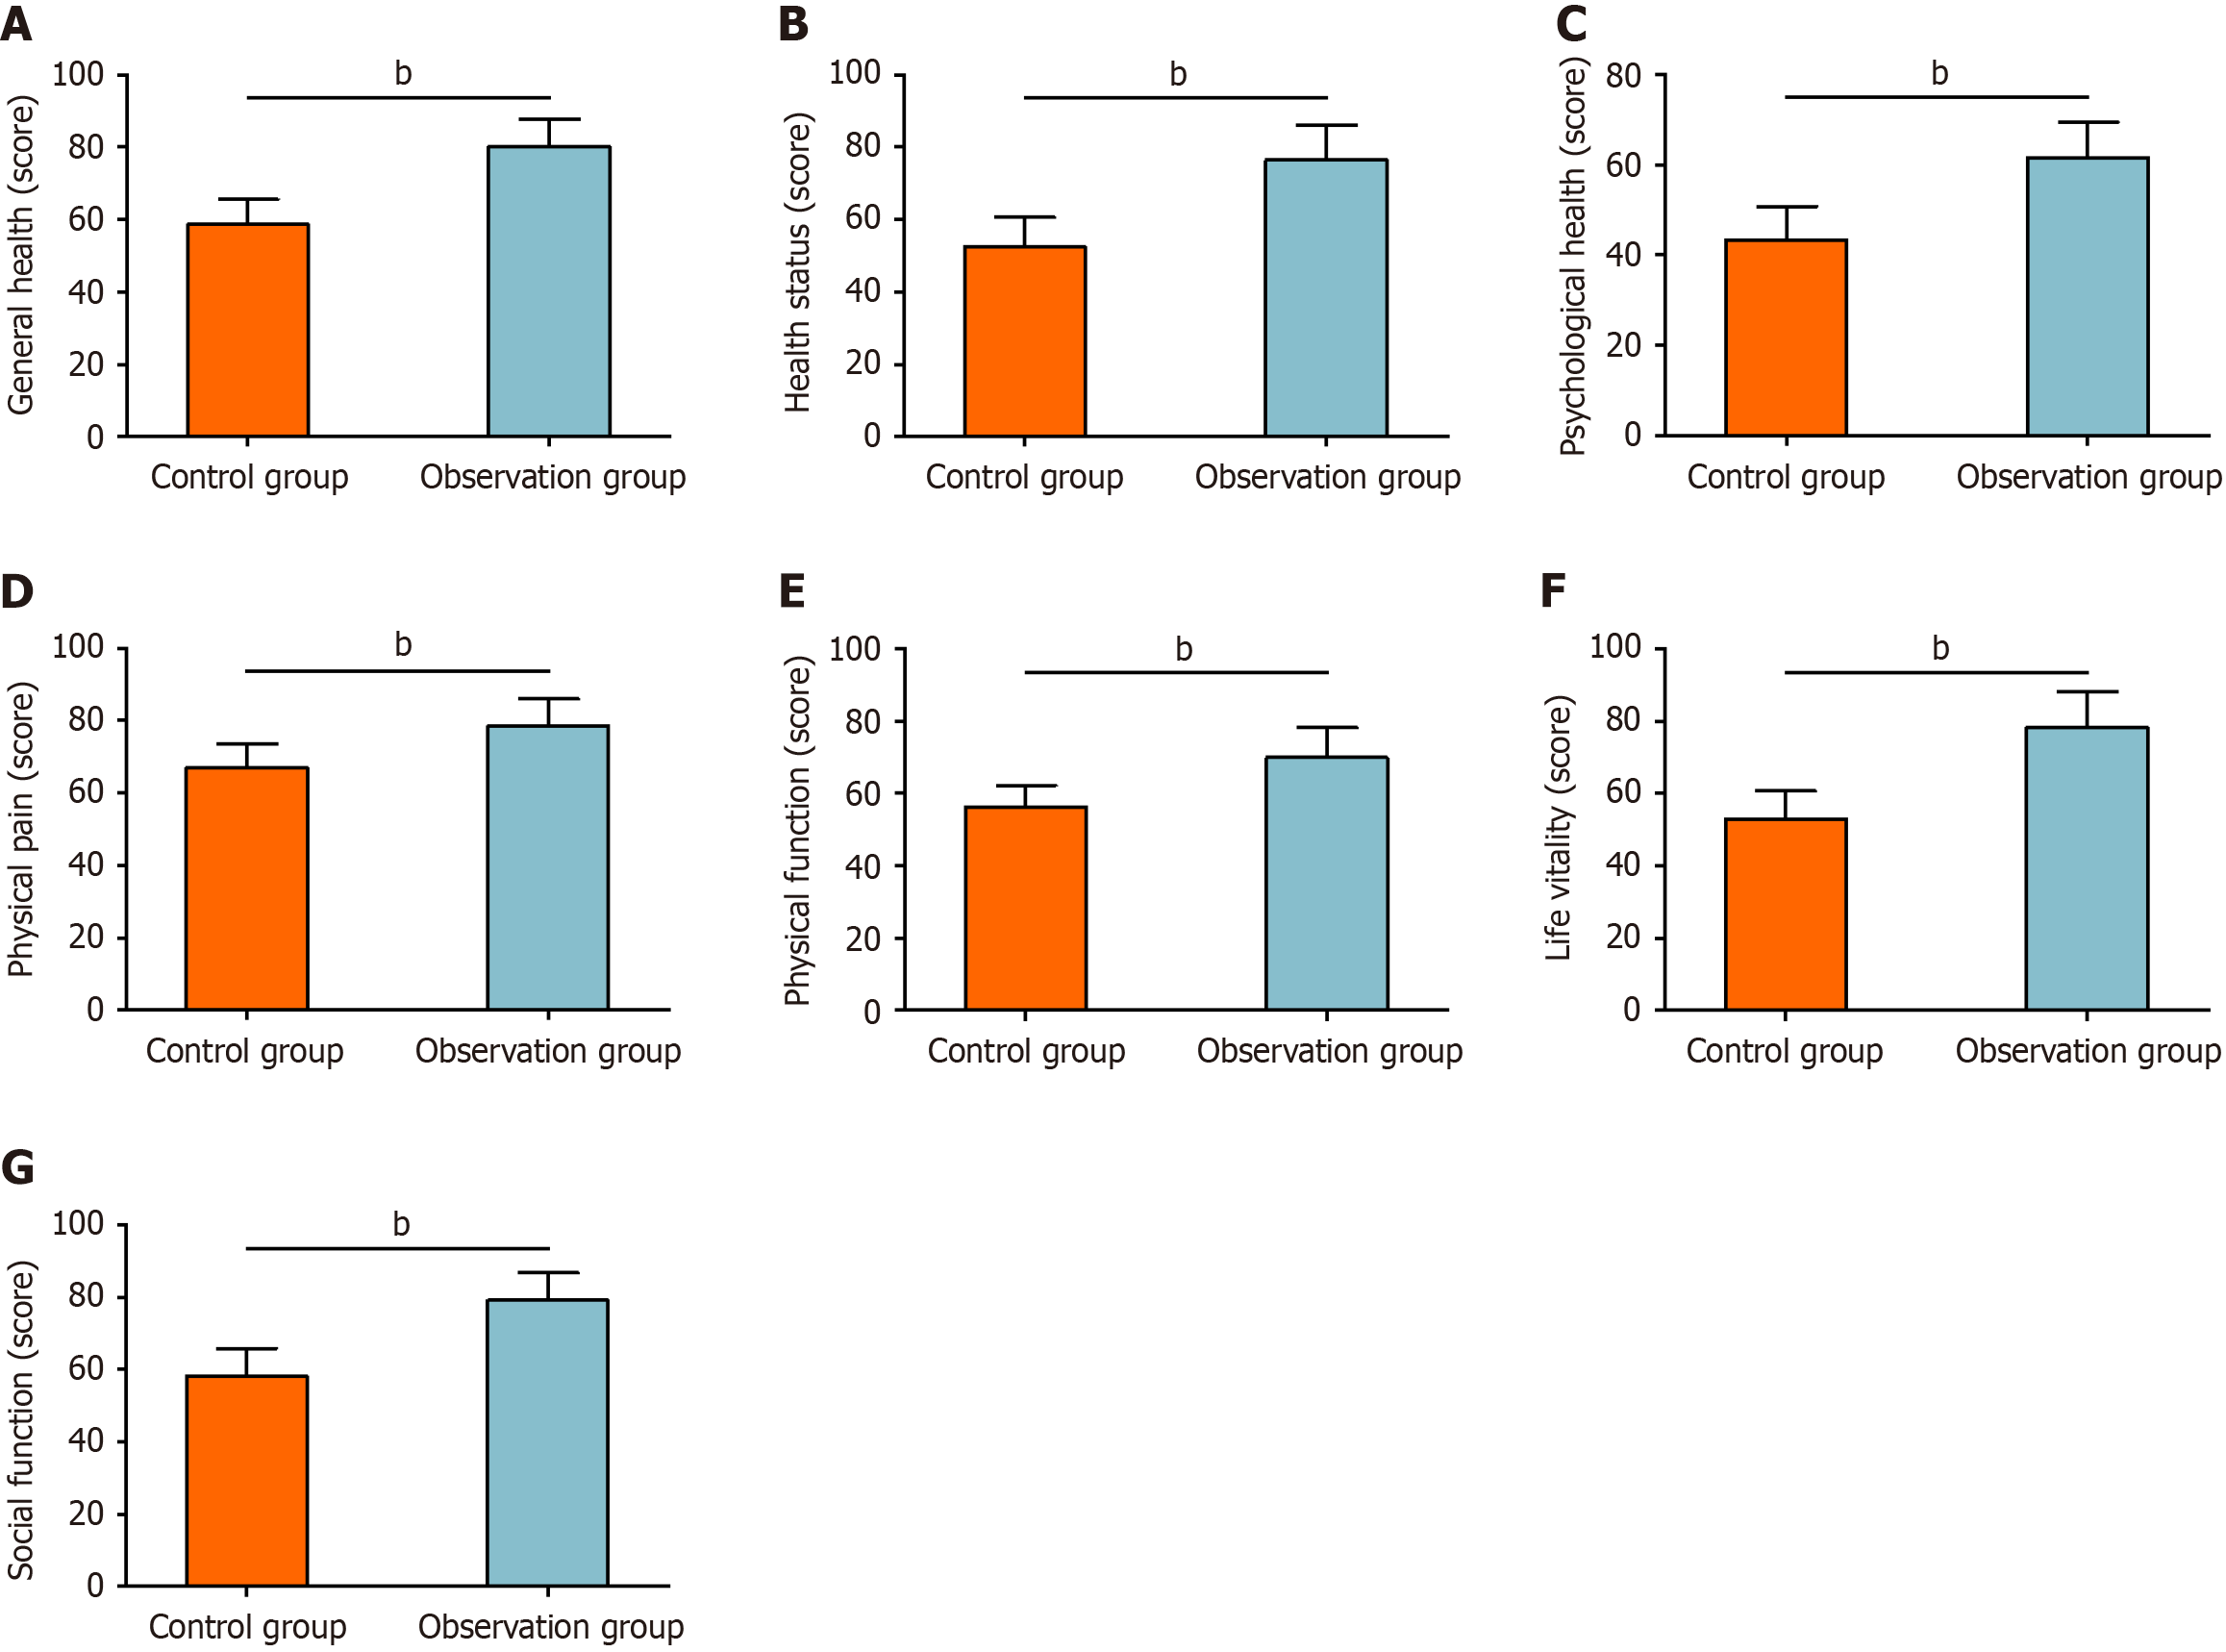
Figure 5 Quality of life of the two groups.
A: General health scores of the control and observation groups; B: Health status scores of the control and observation groups; C: Mental health scores of the control and observation groups; D: Bodily pain scores of the control and observation groups; E: Physical function scores of the control and observation groups; F: Vitality scores of the control and observation groups; G: Social function scores of the control and observation groups. bP < 0.01.
- Citation: Wu D, Wang J. Impact of enhanced recovery after surgery on postoperative pain management and functional recovery in patients with colorectal cancer. World J Gastrointest Surg 2025; 17(9): 107356
- URL: https://www.wjgnet.com/1948-9366/full/v17/i9/107356.htm
- DOI: https://dx.doi.org/10.4240/wjgs.v17.i9.107356


