Copyright
©The Author(s) 2025.
World J Gastrointest Surg. Sep 27, 2025; 17(9): 105779
Published online Sep 27, 2025. doi: 10.4240/wjgs.v17.i9.105779
Published online Sep 27, 2025. doi: 10.4240/wjgs.v17.i9.105779
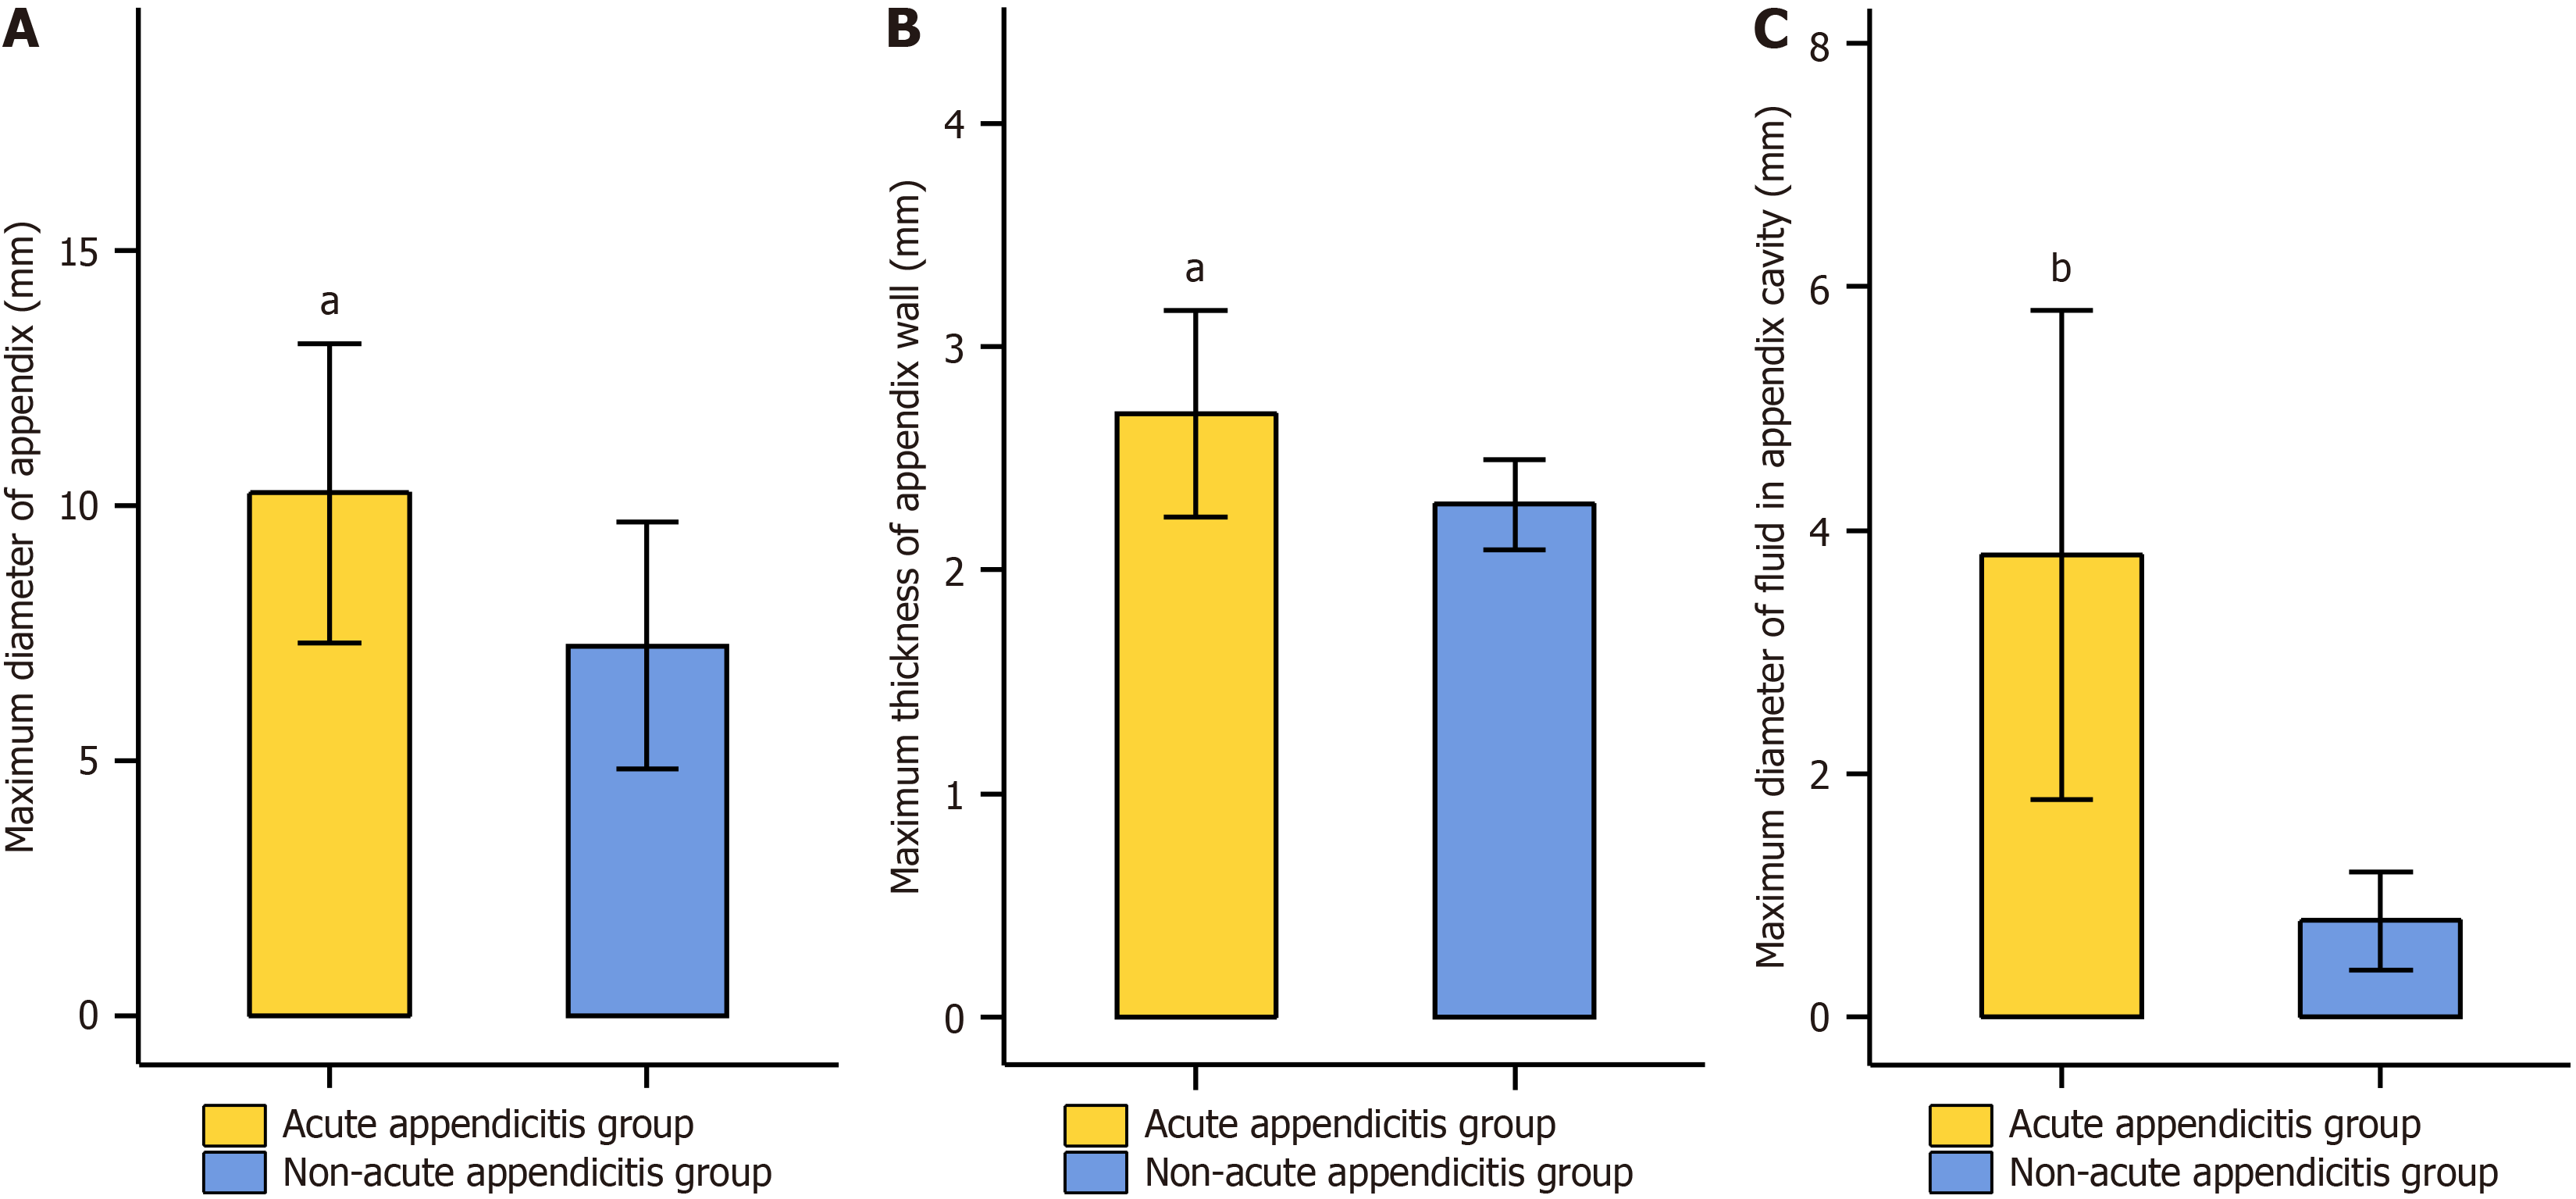
Figure 1 Comparative analysis of appendix-related parameters between the two pediatric patient groups.
A: The maximum diameter of the appendix of the two pediatric patient groups; B: The maximum thickness of the appendiceal wall of the two pediatric patient groups; C: The maximum extent of transmural oedema of the two pediatric patient groups. aP < 0.01 vs the non-acute appendicitis group; bP < 0.001 vs the non-acute appendicitis group.
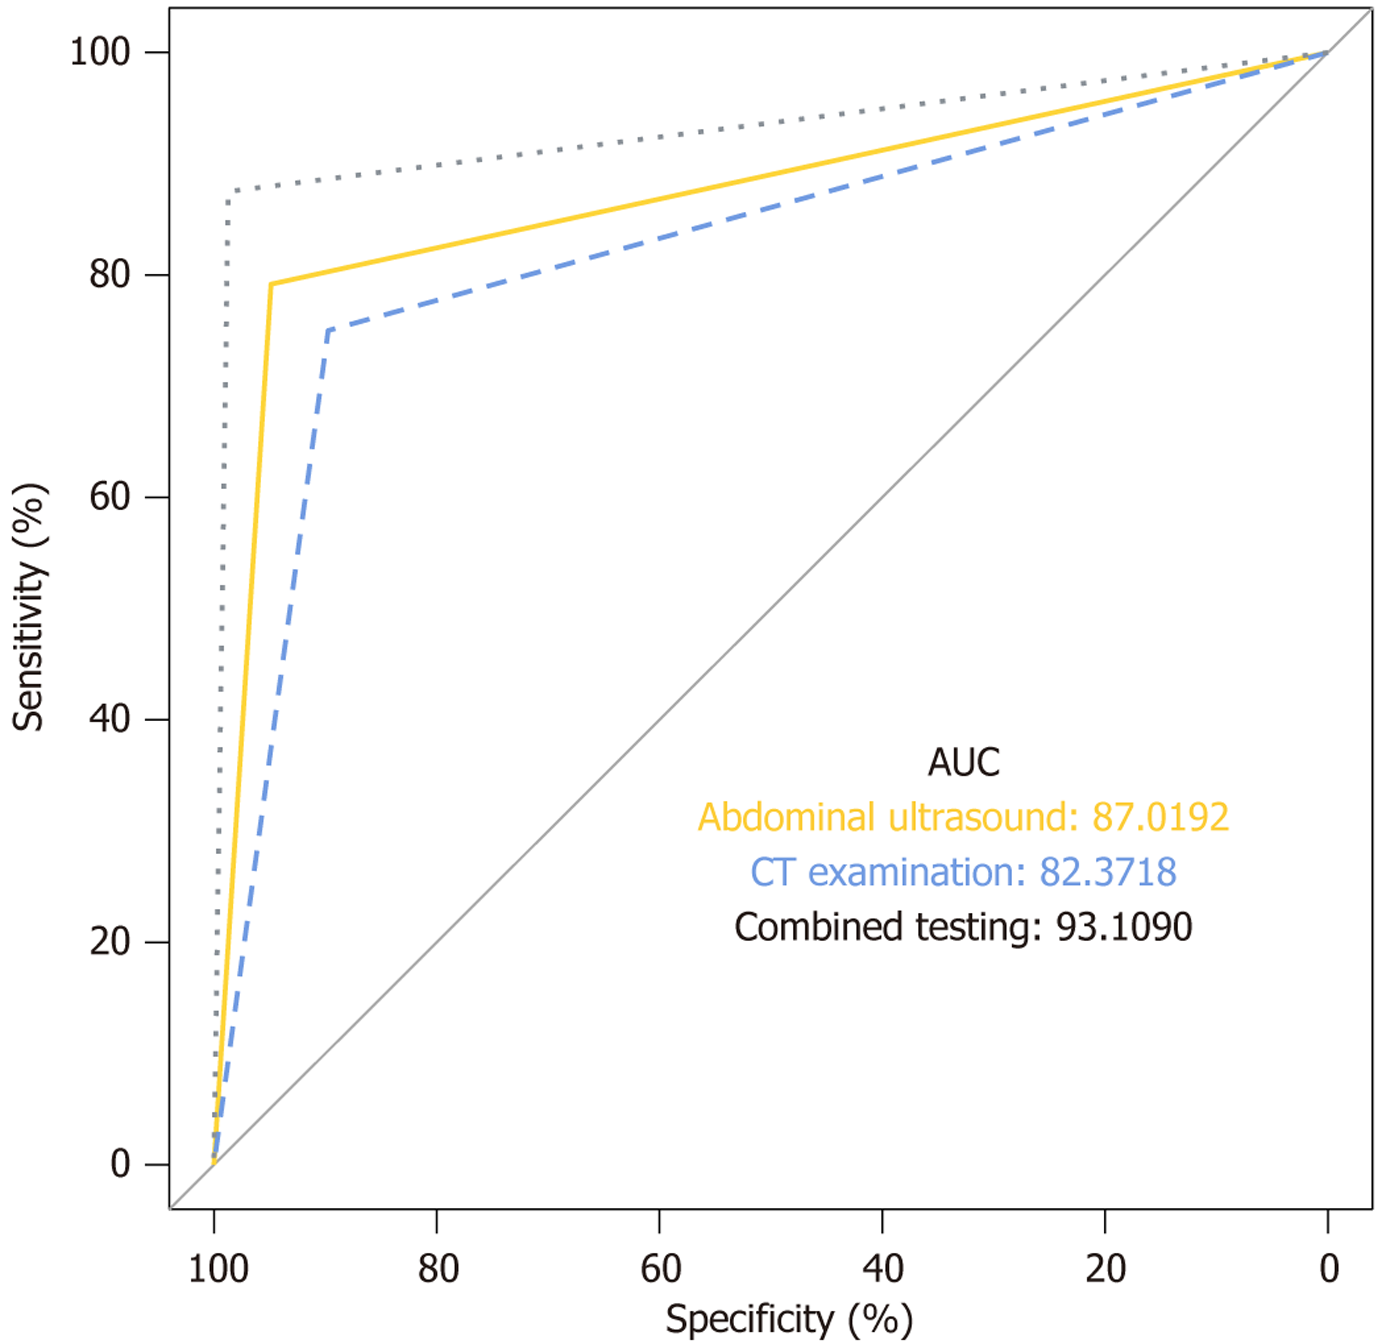
Figure 2 Receiver operating characteristic curves of abdominal ultrasonography, computed tomography examination, and their combined detection for pediatric acute appendicitis.
AUC: Area under the curve; CT: Computed tomography.
- Citation: Dai M, Zhang FW, Jiang W. Application value of abdominal ultrasonography in the diagnosis of pediatric patients aged 3-12 years with acute appendicitis. World J Gastrointest Surg 2025; 17(9): 105779
- URL: https://www.wjgnet.com/1948-9366/full/v17/i9/105779.htm
- DOI: https://dx.doi.org/10.4240/wjgs.v17.i9.105779


