Copyright
©The Author(s) 2025.
World J Gastrointest Surg. Sep 27, 2025; 17(9): 105134
Published online Sep 27, 2025. doi: 10.4240/wjgs.v17.i9.105134
Published online Sep 27, 2025. doi: 10.4240/wjgs.v17.i9.105134
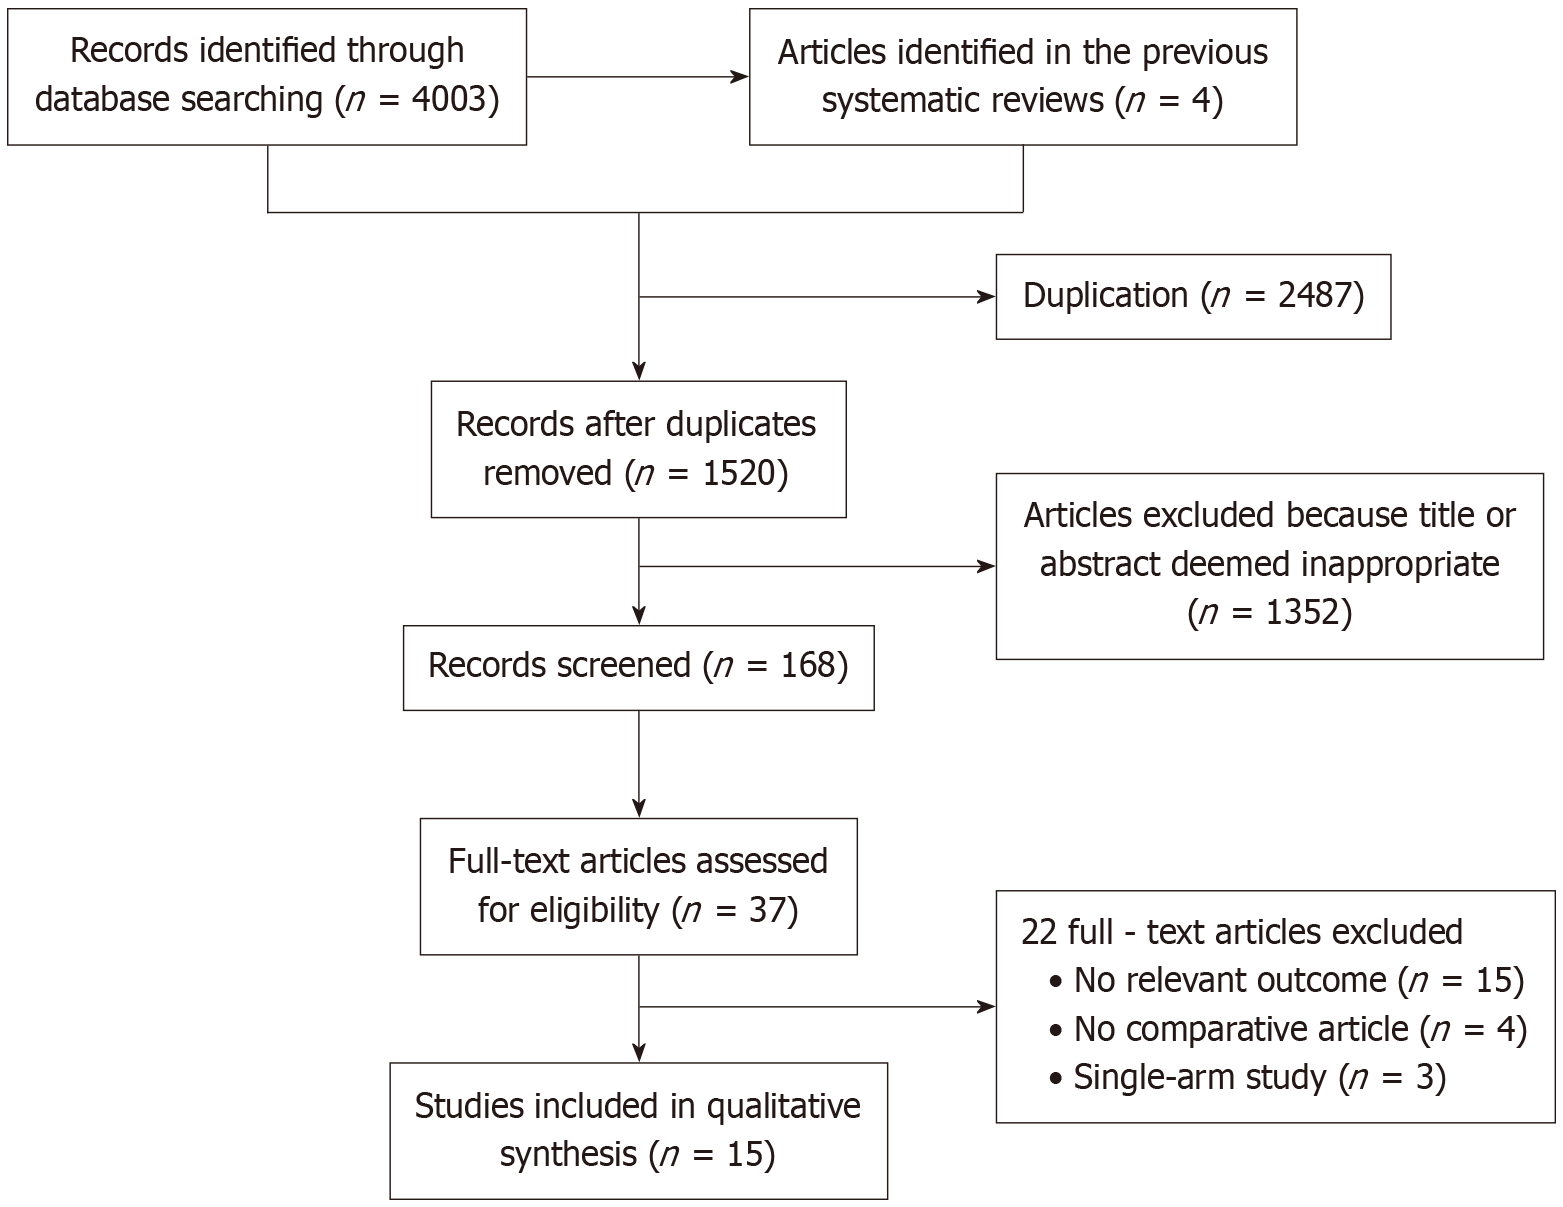
Figure 1
Flow chart of article screening.
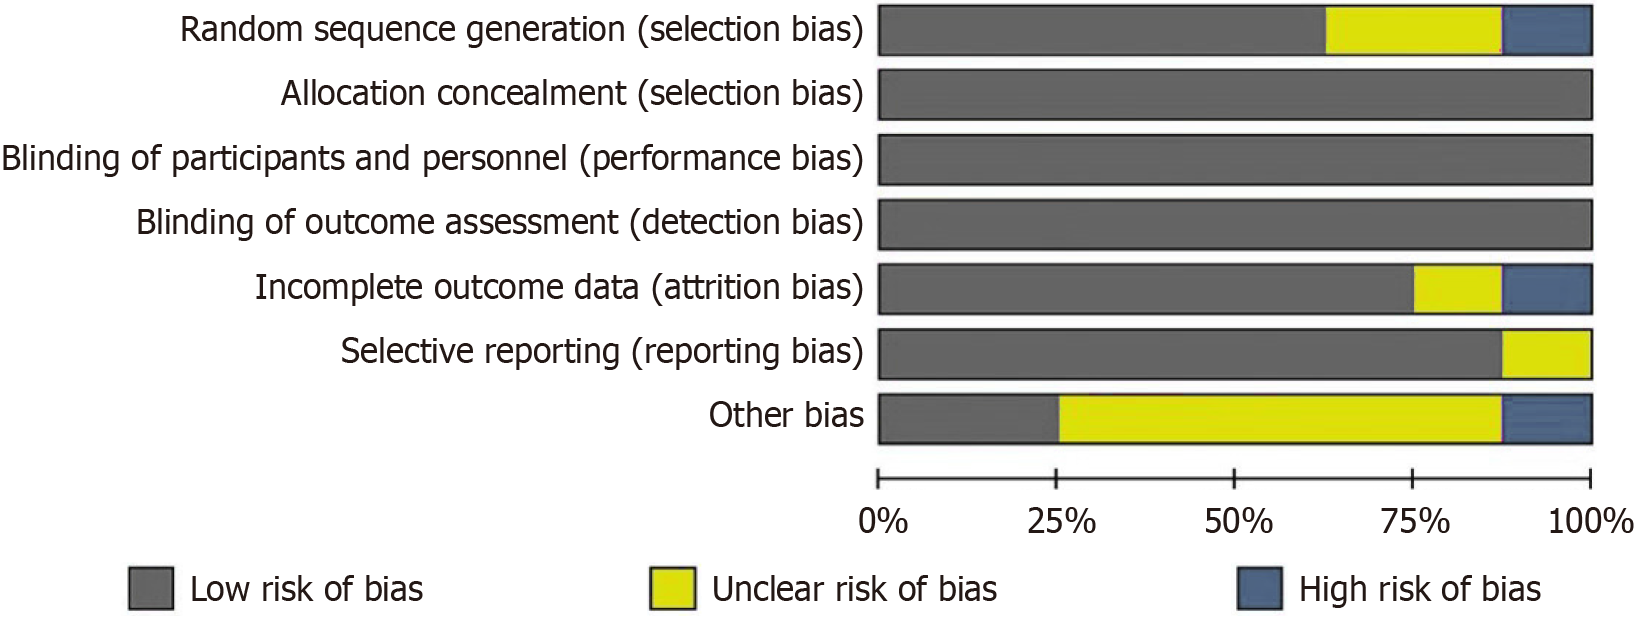
Figure 2
Article quality evaluation chart: Randomized controlled trials.
Figure 3 Meta-analyses of surgical and postoperative outcomes (including operation time, puncture-related indicators, and postoperative complications).
A: Meta-analysis of operation time; B: Meta-analysis of number of punctures; C: Meta-analysis of first puncture success rate; D: Meta-analysis of overall puncture success rate; E: Meta-analysis of post-operative bleeding; F: Meta-analysis of biliary fistula; G: Meta-analysis of postoperative infection; H: Meta-analysis of overall post-operative complications rate; I: Meta-analysis of the reduction levels of postoperative total bilirubin. 3D: Three-dimensional; CI: Confidence interval.
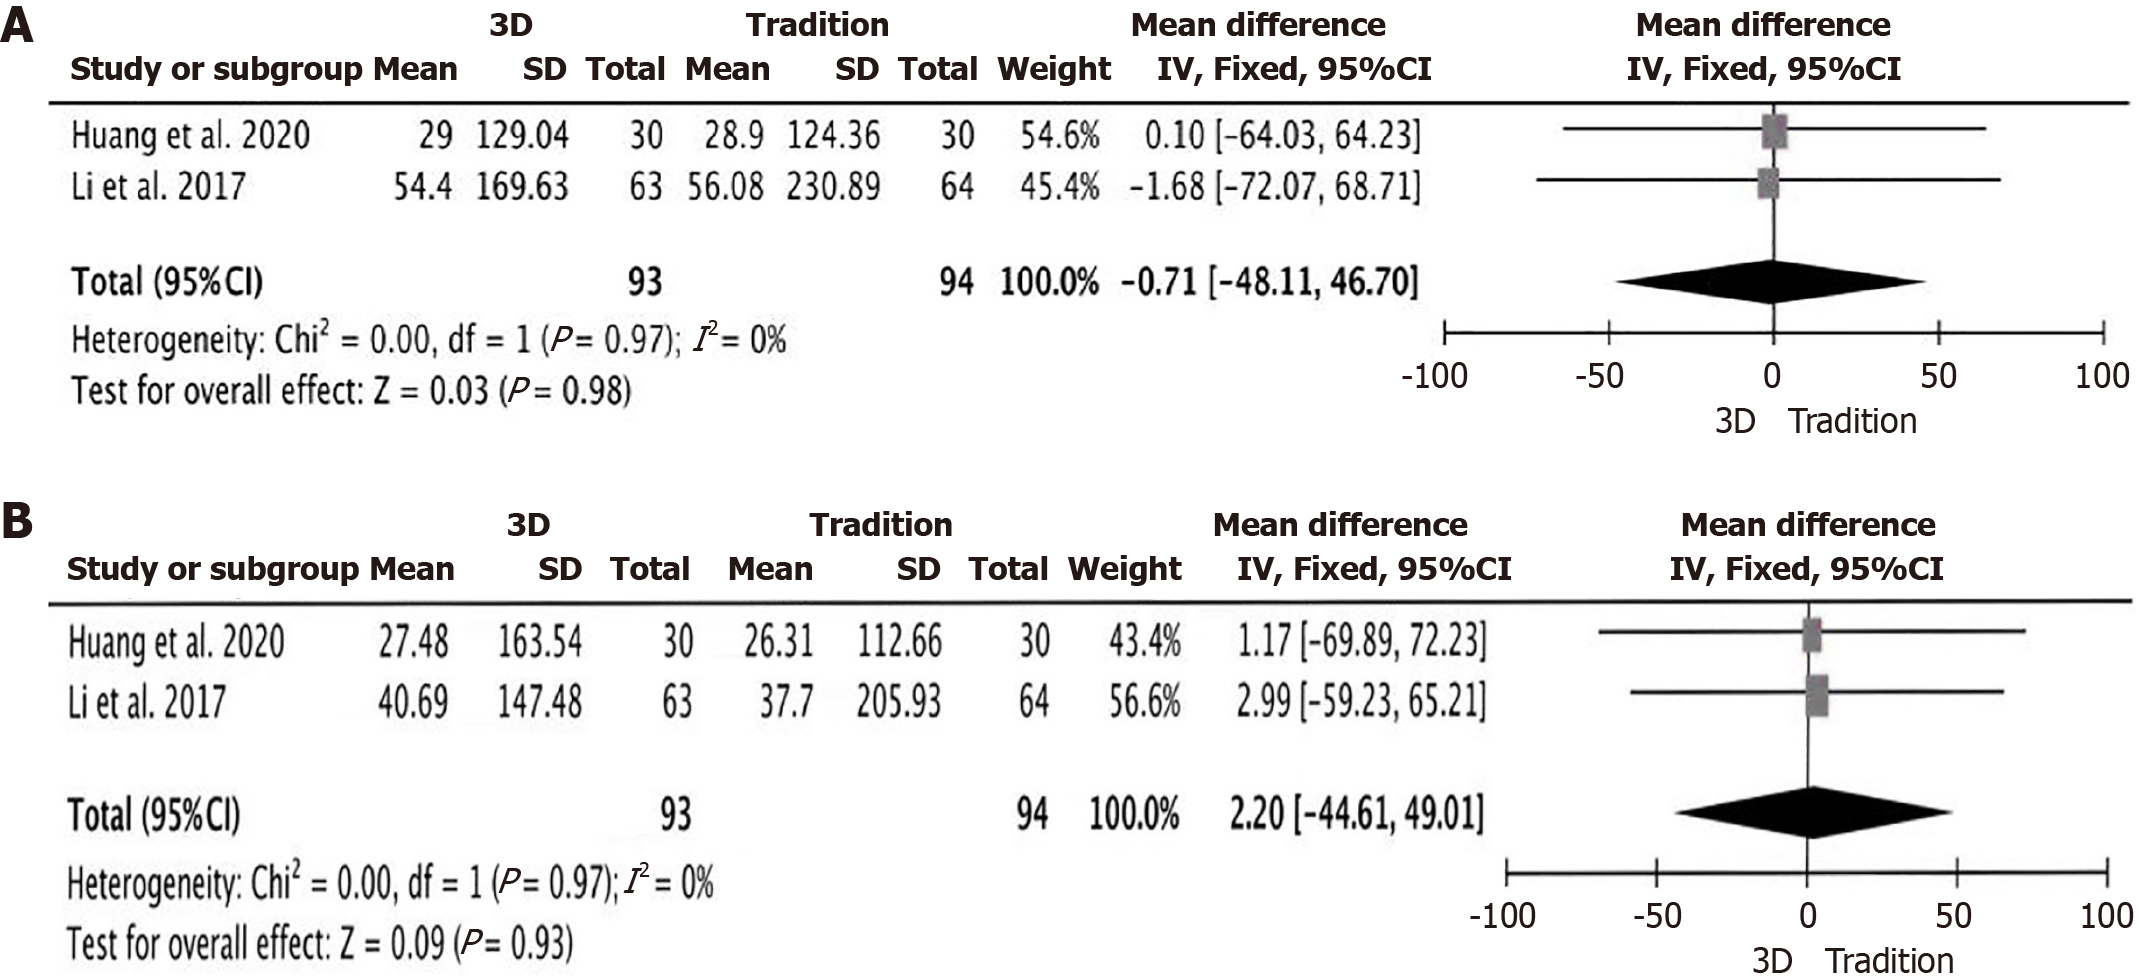
Figure 4 Meta-analysis of the reduction levels of aspartate transaminase and alanine transaminase.
A: Meta-analysis of the reduction levels of aspartate transaminase; B: Meta-analysis of the reduction levels of alanine transaminase. 3D: Three-dimensional; CI: Confidence interval.
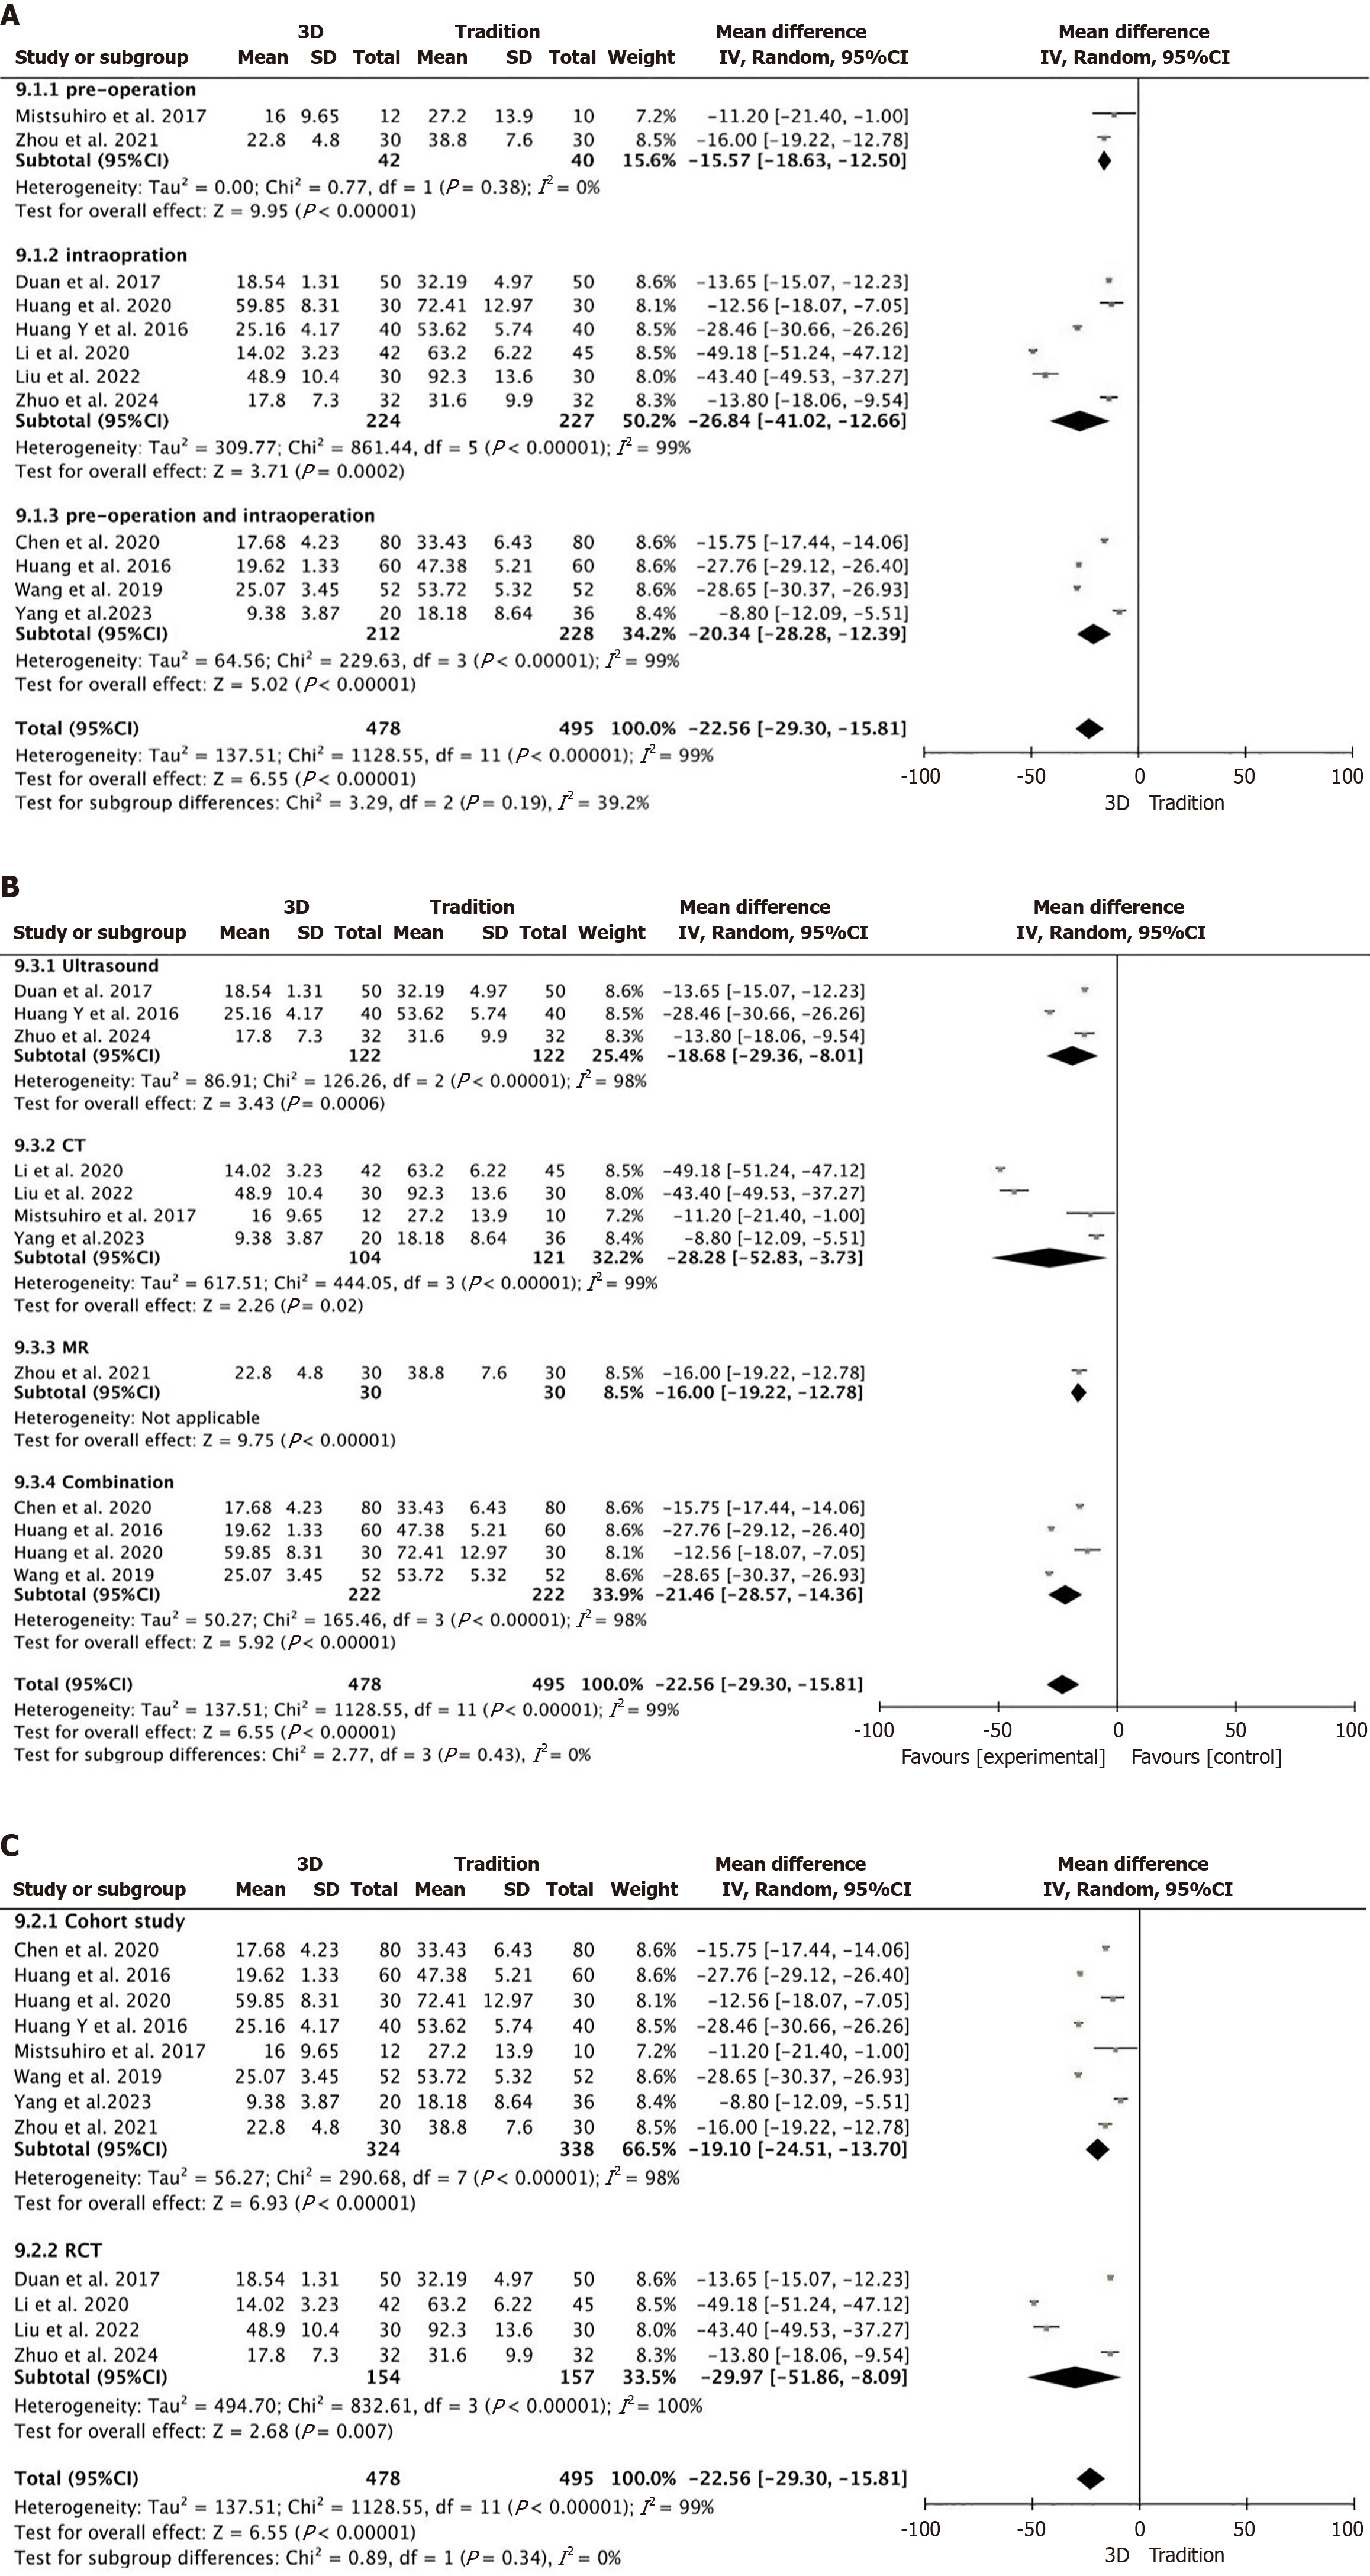
Figure 5 Meta-analysis for subgroup analysis of surgery time.
A: Meta-analysis for subgroup analysis of surgery time according to guidance stages of the three-dimensional reconstruction; B: Meta-analysis for subgroup analysis of surgery time according to three-dimensional reconstruction imaging modalities; C: Meta-analysis for subgroup analysis of surgery time according to types of studies. CI: Confidence interval.
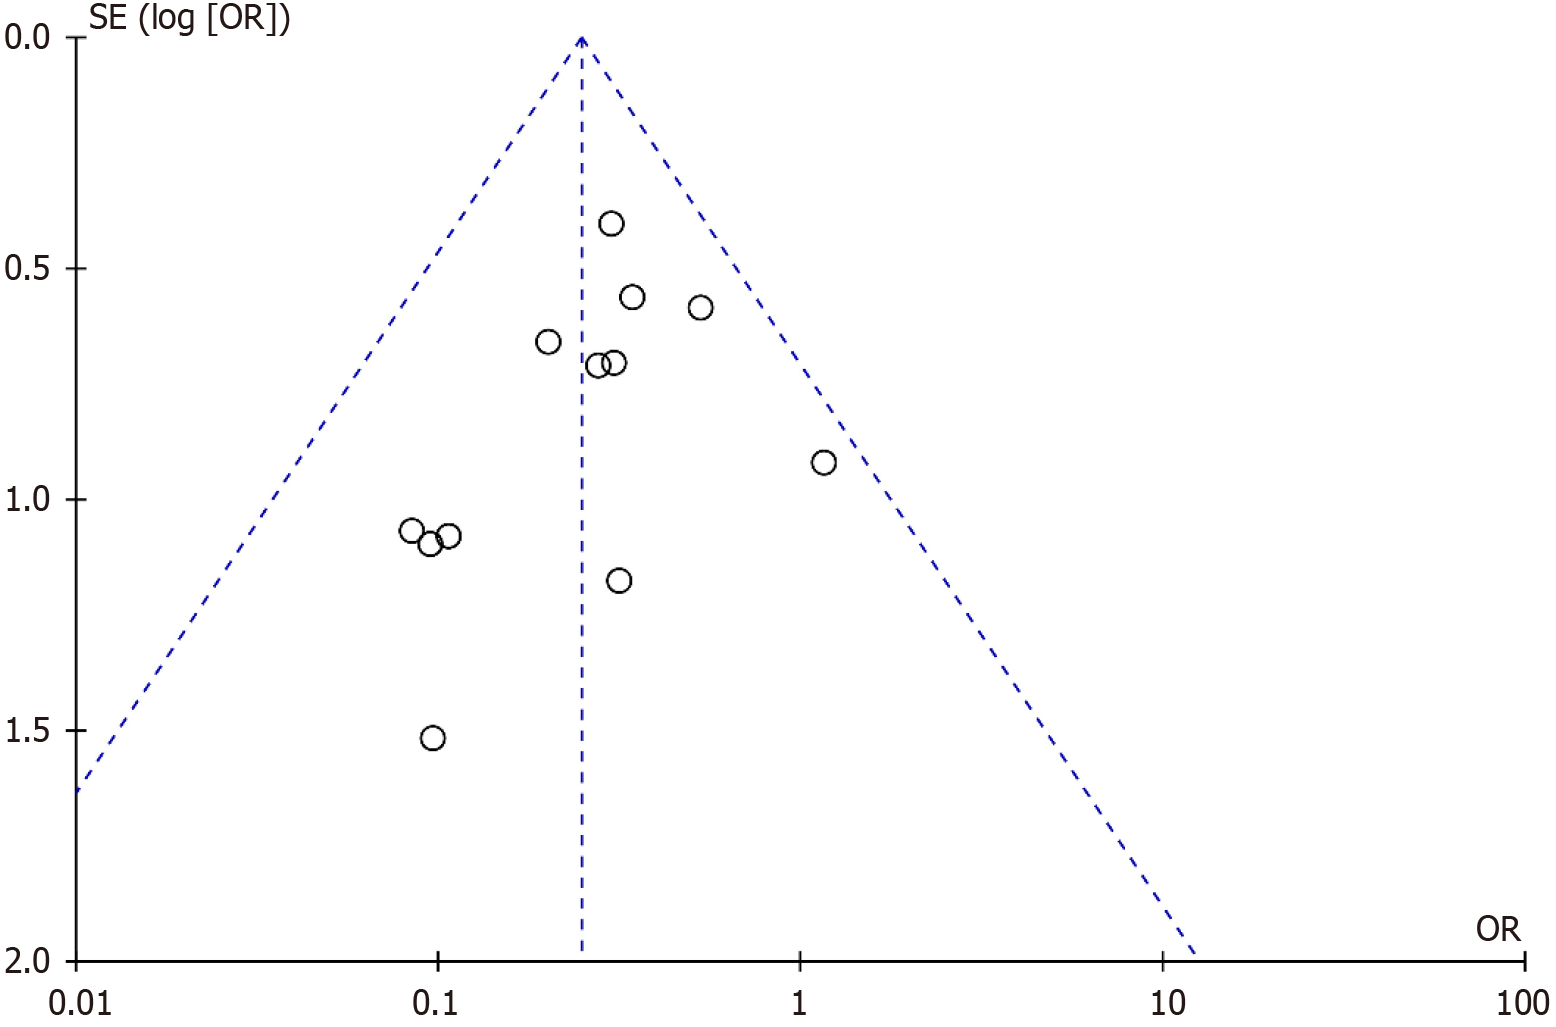
Figure 6 Funnel plot based on overall post-operative complications rate.
OR: Odds ratio.
- Citation: Chen ZH, Zhang LJ, Lin ZX, Lin SX, Song ZF, Wu ZJ, Lin W. Safety and efficacy of three-dimensional reconstruction technology-assisted percutaneous transhepatic biliary drainage: A meta-analysis. World J Gastrointest Surg 2025; 17(9): 105134
- URL: https://www.wjgnet.com/1948-9366/full/v17/i9/105134.htm
- DOI: https://dx.doi.org/10.4240/wjgs.v17.i9.105134


