Copyright
©The Author(s) 2025.
World J Gastrointest Surg. May 27, 2025; 17(5): 102201
Published online May 27, 2025. doi: 10.4240/wjgs.v17.i5.102201
Published online May 27, 2025. doi: 10.4240/wjgs.v17.i5.102201
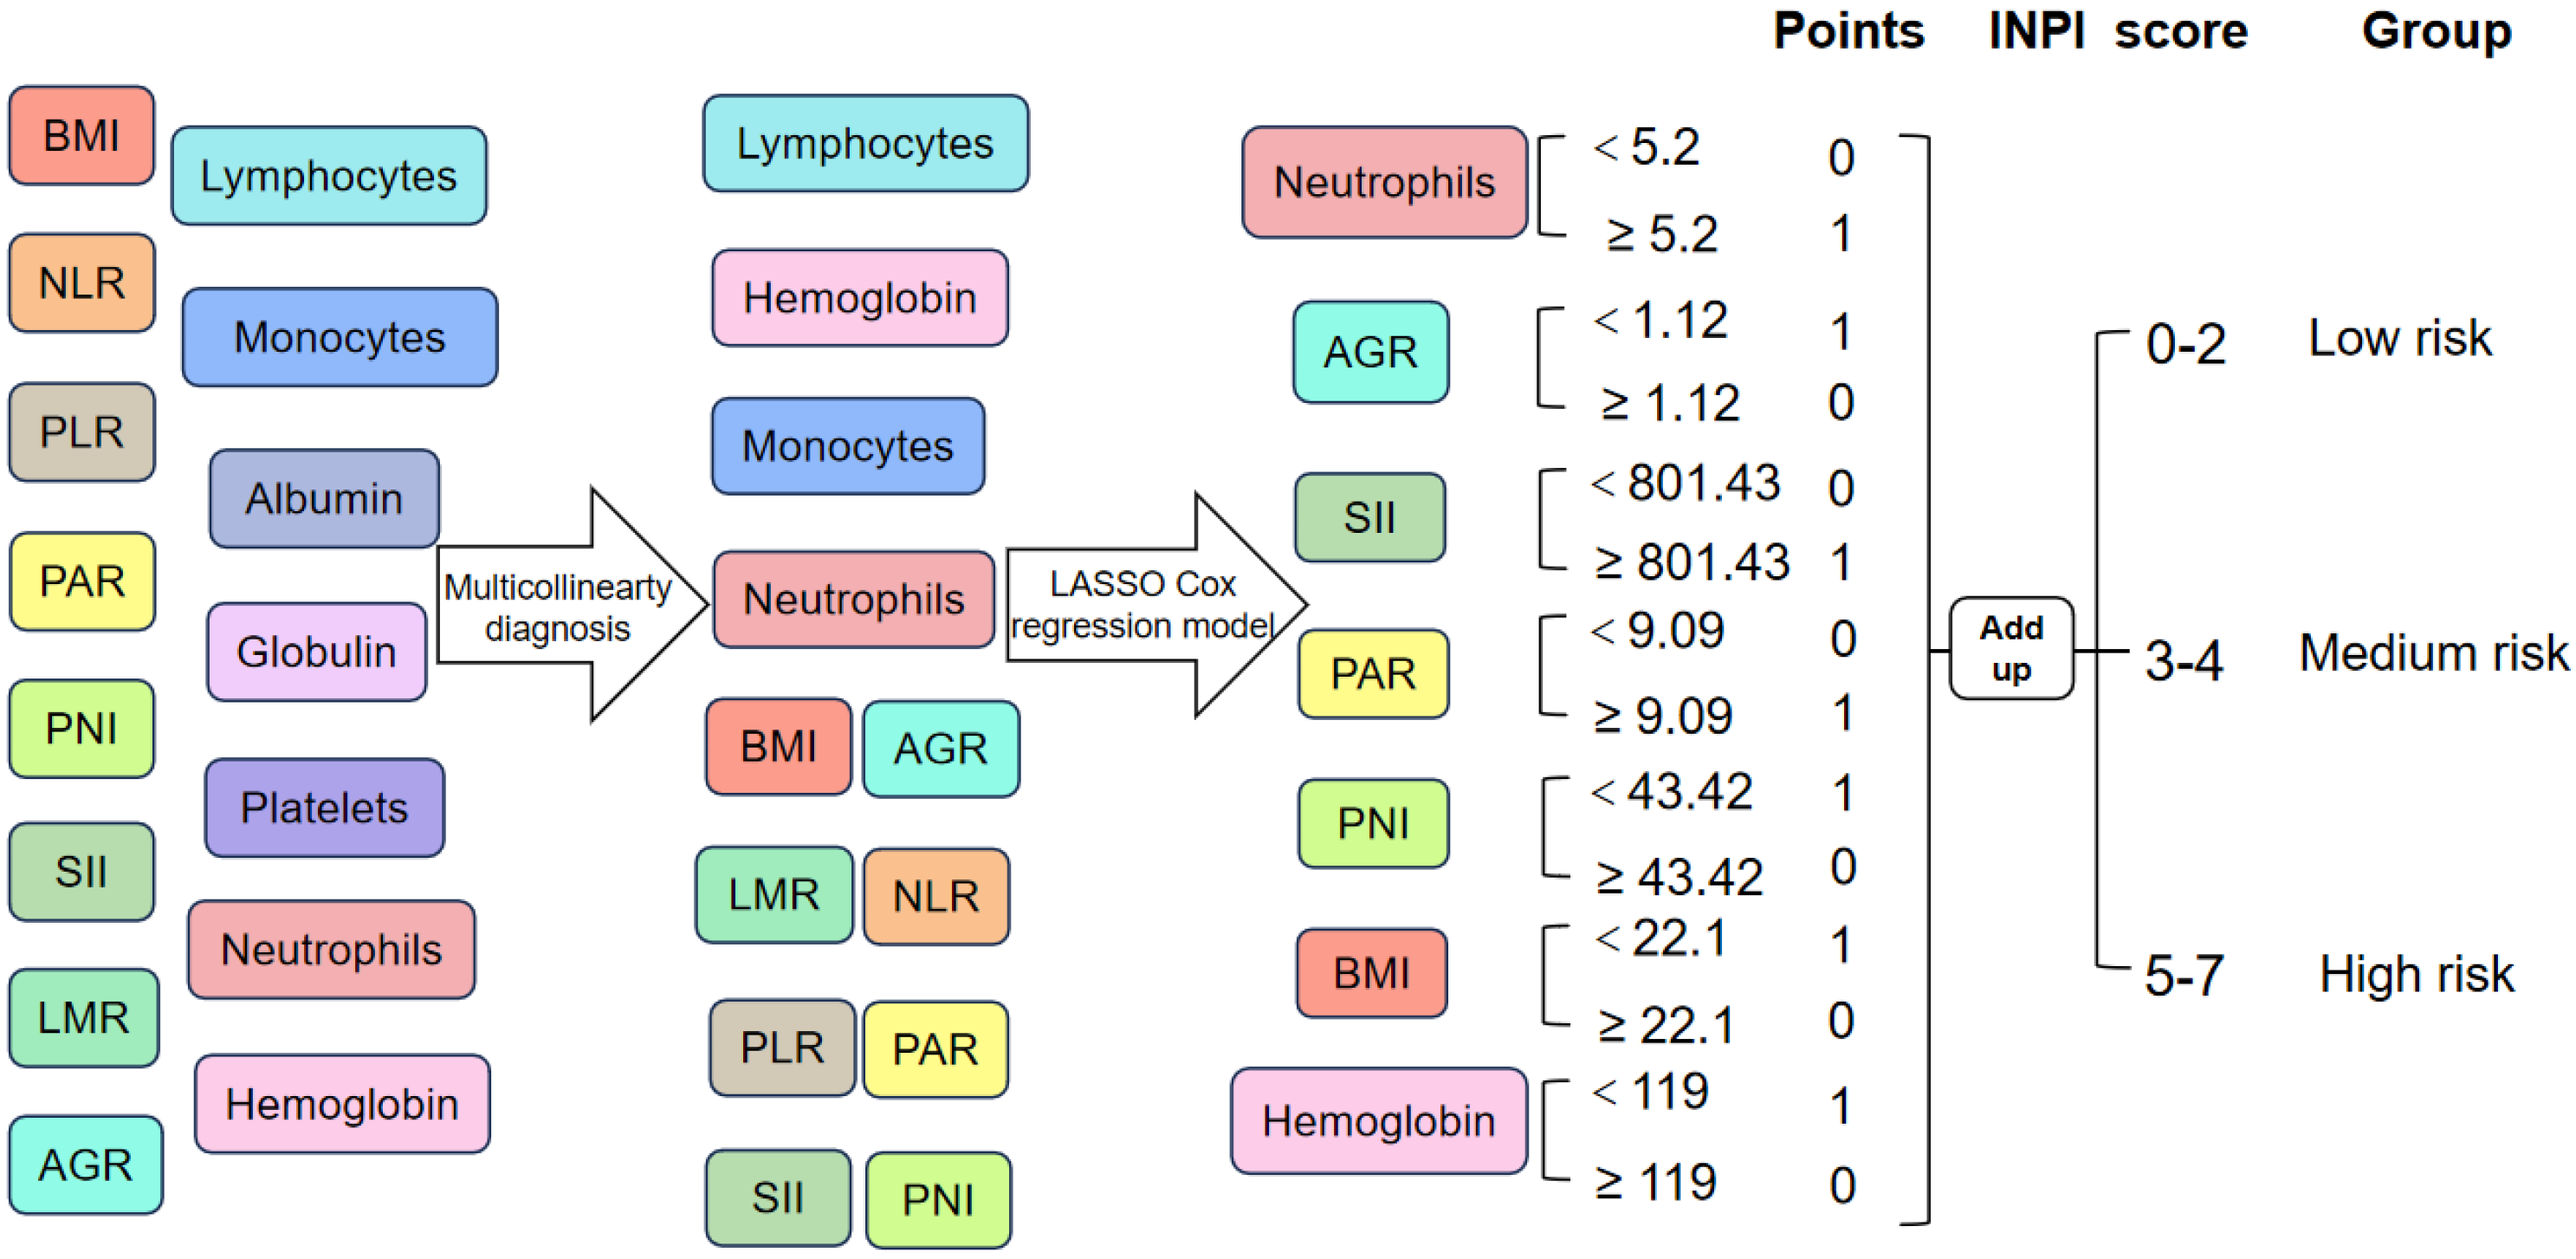
Figure 1 Inflammatory-nutritional prognostic index construction process and patient risk stratification.
NLR: Neutrophil-to-lymphocyte ratio; PLR: Platelet-to-lymphocyte ratio; PAR: Platelet-to-albumin ratio; PNI: Prognostic nutritional index; SII: Systemic immune-inflammatory index; LMR: Lymphocyte-to-monocyte ratio; AGR: Albumin-to-globulin ratio; BMI: Body mass index; INPI: Inflammatory nutritional prognostic index.
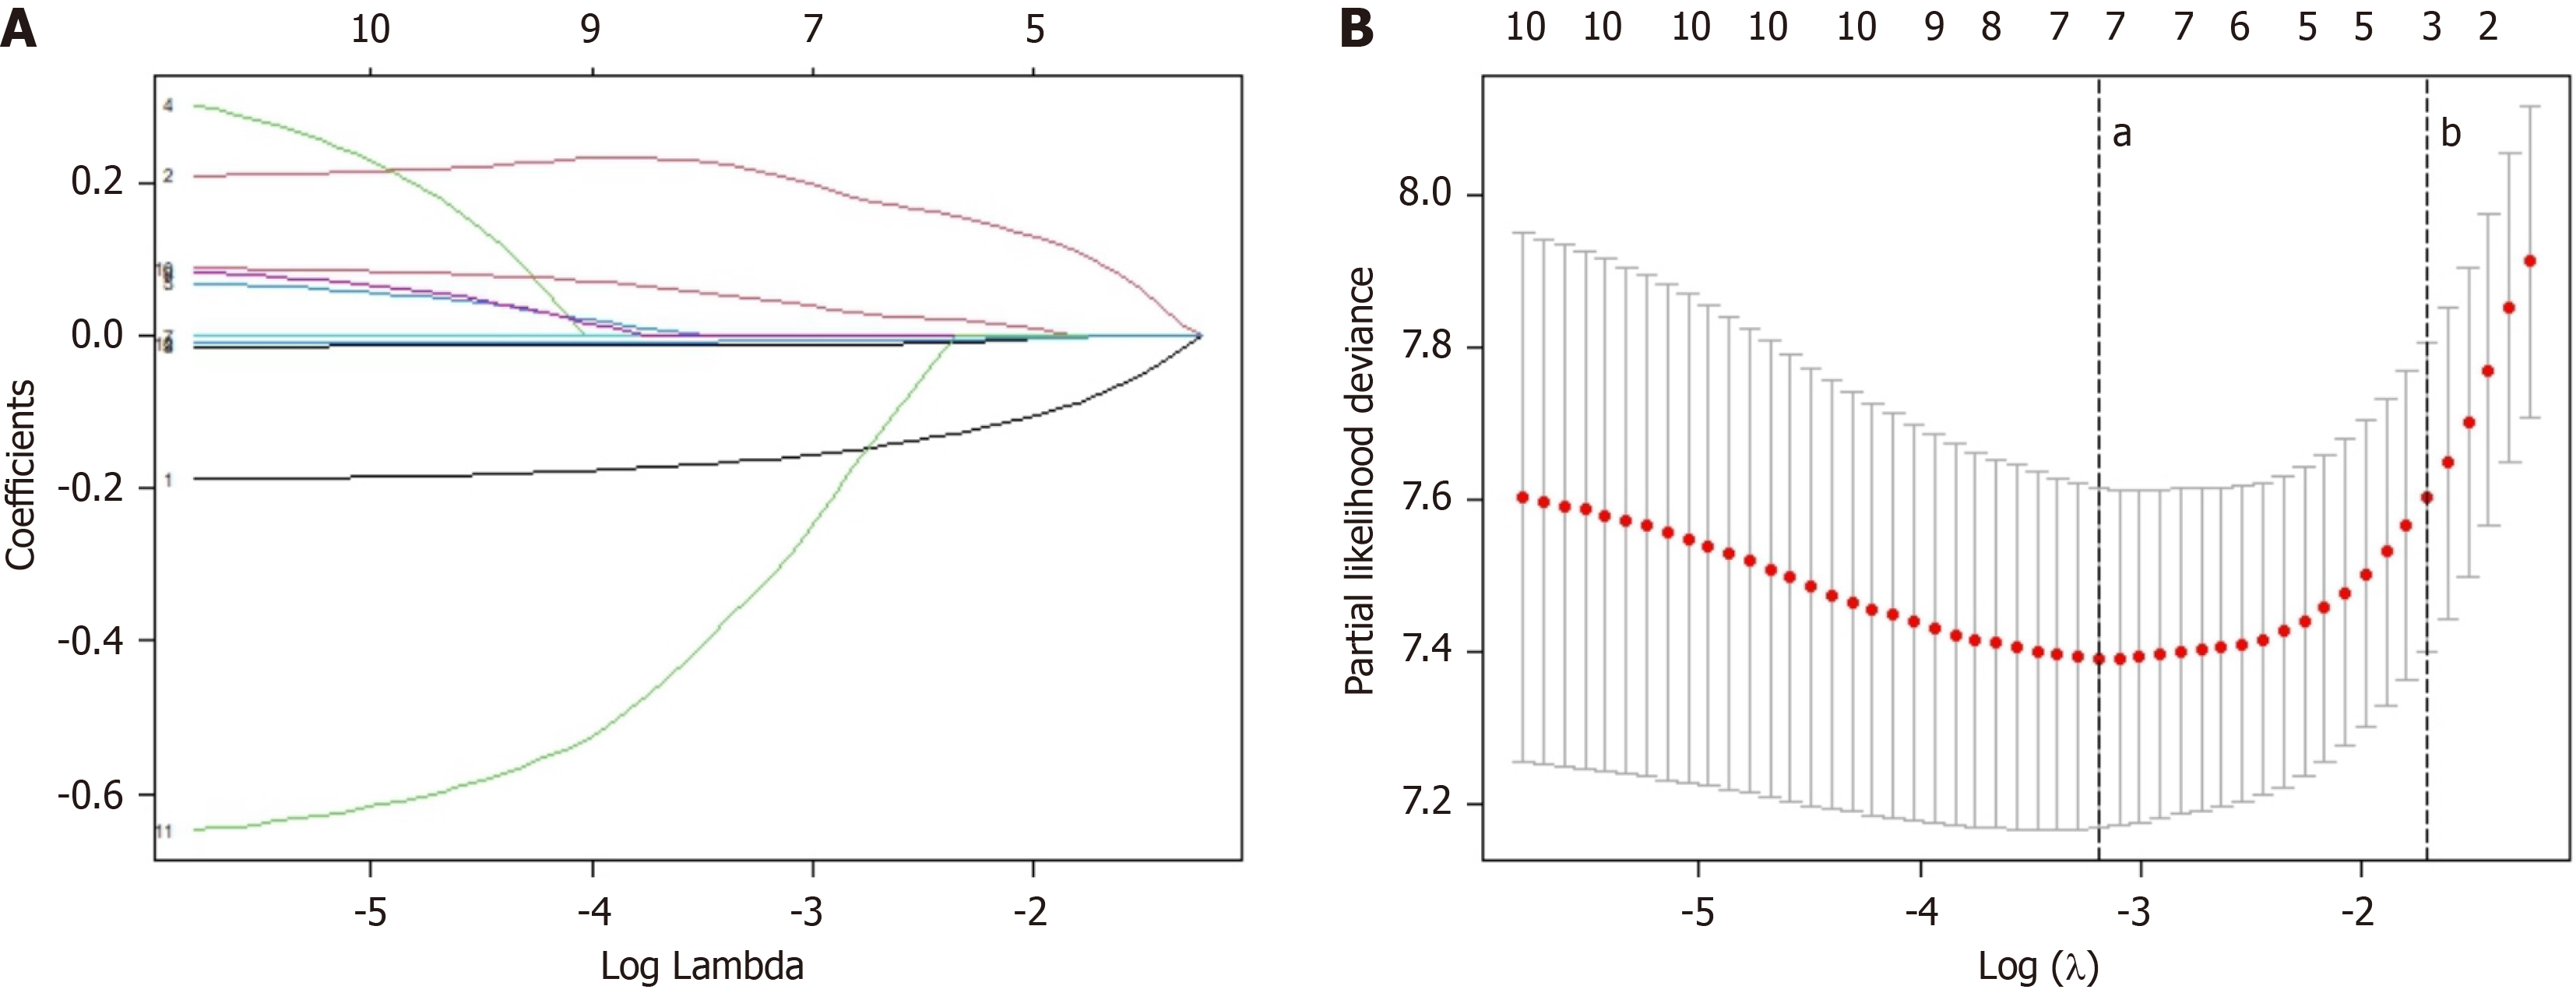
Figure 2 Construction of the inflammatory-nutritional prognostic index using the least absolute shrinkage and selection operator Cox regression model.
A: The least absolute shrinkage and selection operator coefficient curves of 12 inflammatory and nutritional indicators, showing the changes in the regression coefficients of each indicator in the model. As the regularization parameter λ increases, some coefficients are gradually shrunk to zero, thus achieving variable selection and enhancing the sparsity of the model; B: Ten-fold cross-validation was used for parameter tuning and selection of the least absolute shrinkage and selection operator model. The vertical "dotted line a" represents λmin, that is, the number of independent variables in the model corresponding to the minimum error. It indicates that under the λ =0.041, the cross-validation error of the model reaches the minimum. The vertical "dotted line b" represents λ1se, which is the number of independent variables in the model corresponding to the position of one standard error from the minimum error.
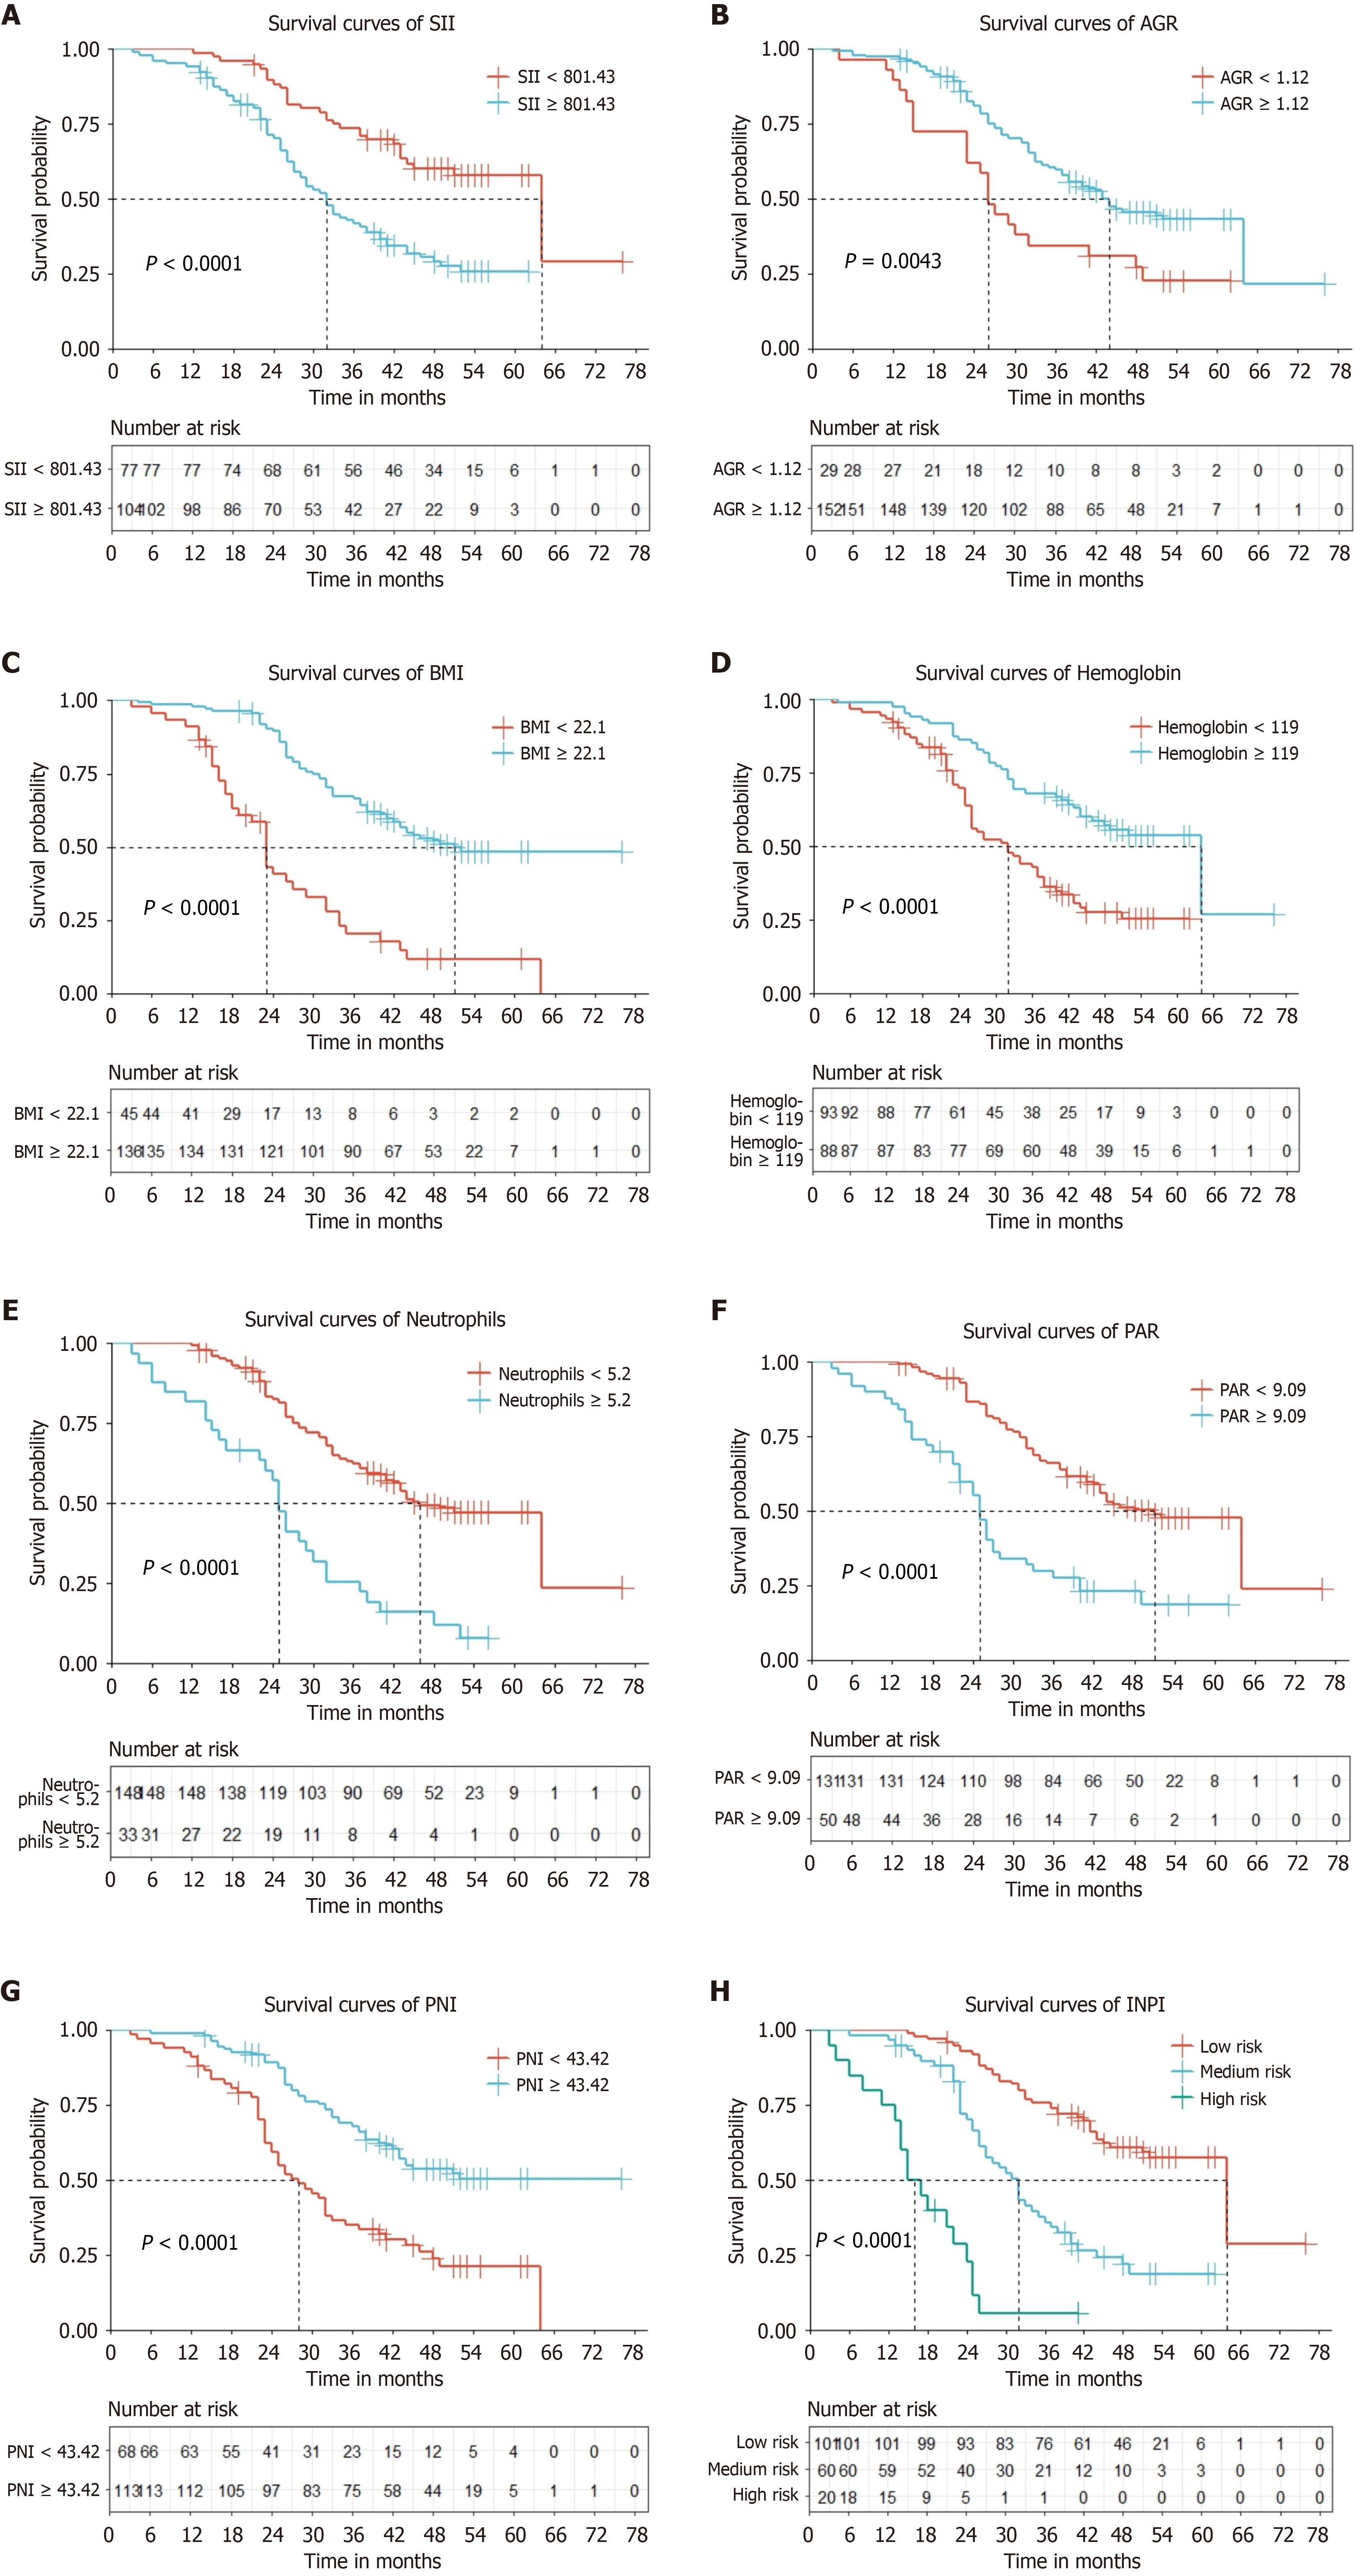
Figure 3 Survival curves via Kaplan-Meier analysis of 7 inflammation and nutrition indicators and inflammatory-nutritional prognostic index groups.
A: Survival curves of systemic immune-inflammatory index (≥ 801.43 vs < 801.43); B: Survival curves of albumin-to-globulin ratio (AGR) (≥ 1.12 vs < 1.12); C: Survival curves of body mass index (≥ 22.1 vs < 22.1); D: Survival curves of AGR hemoglobin (≥ 119 vs < 119); E: Survival curves of neutrophils (≥ 5.2 vs < 5.2); F: Survival curves of platelet-to-albumin ratio (≥ 9.09 vs < 9.09); G: Survival curves of prognostic nutritional index (≥ 43.42 vs < 43.42); H: Survival curves of inflammatory-nutritional prognostic index (low risk vs medium risk vs high risk). SII: Systemic immune-inflammatory index; AGR: Albumin-to-globulin ratio; PAR: Platelet-to-albumin ratio; INPI: Inflammatory nutritional prognostic index.
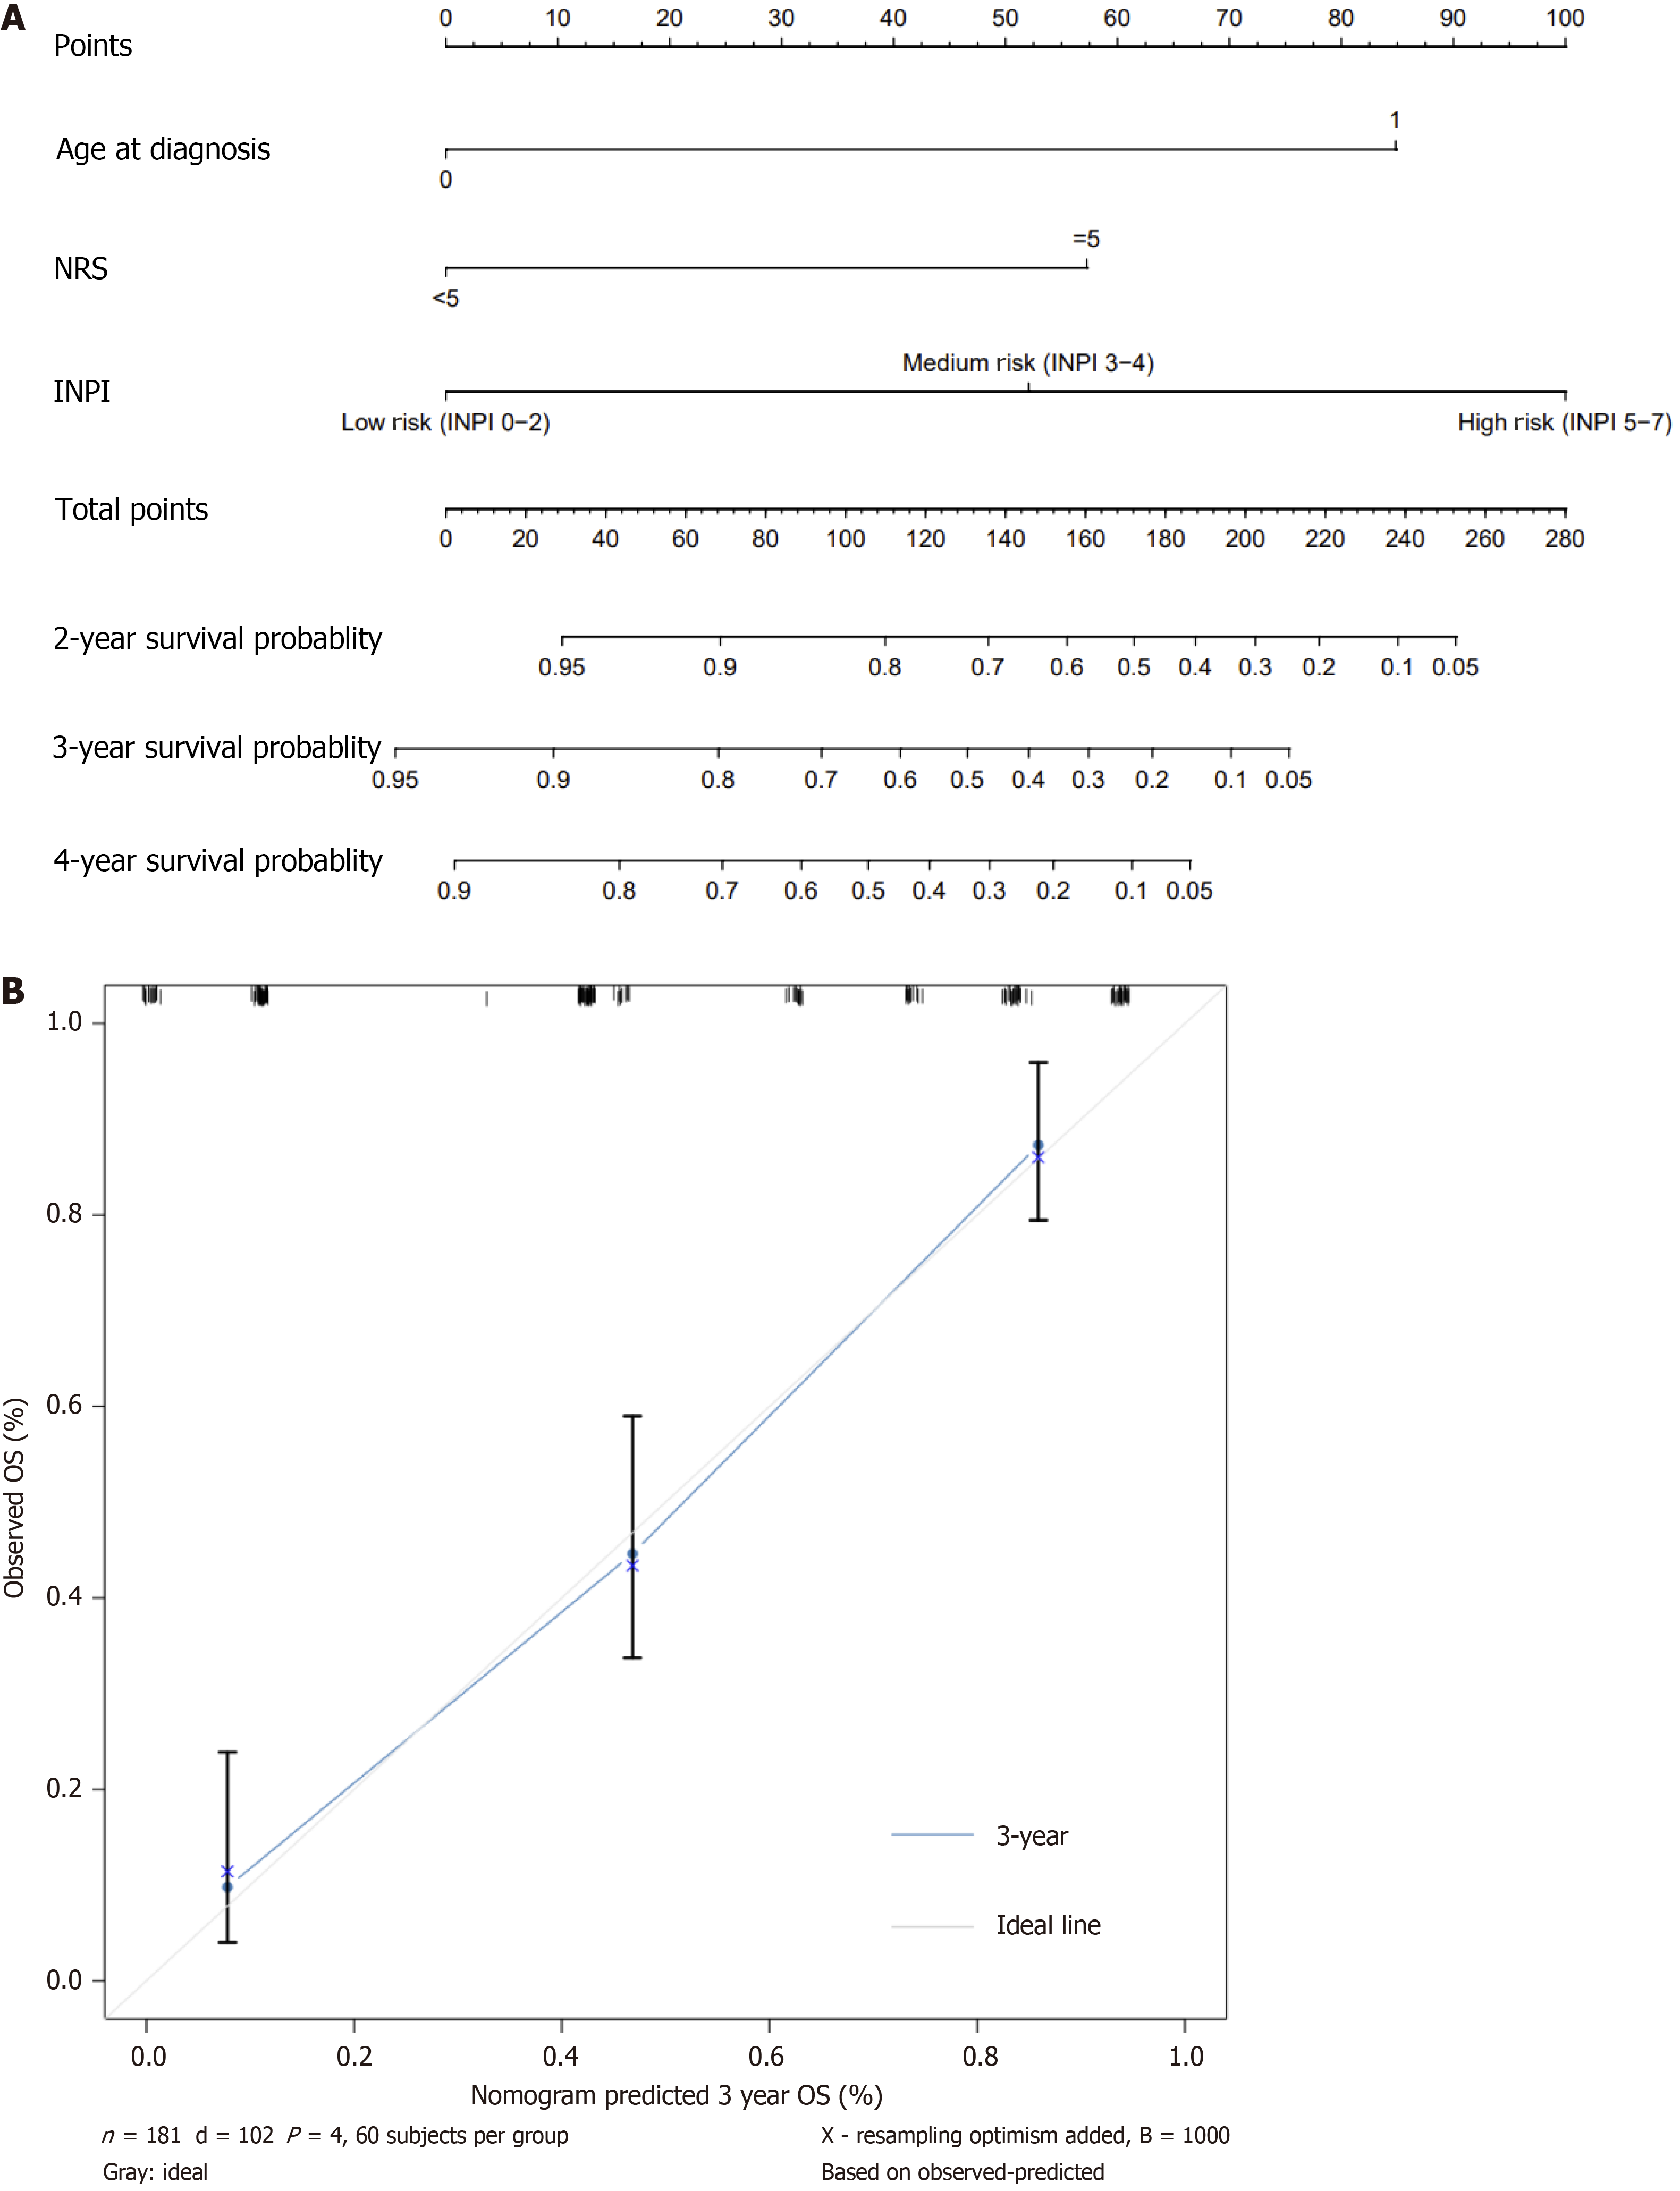
Figure 4 A novel prognostic nomogram based on inflammatory-nutritional prognostic index for advanced gastric cancer patients undergoing curative surgery with prophylactic hyperthermic intraperitoneal chemotherapy.
A: The nomogram for predicting 2, 3 and 4 year survival probability in advanced gastric cancer patients undergoing curative surgery with prophylactic hyperthermic intraperitoneal chemotherapy; B: Calibration plots of the nomogram for 3-year survival probability using bootstraps with 1000 resample. NRS: Nutritional Risk Screening; INPI: Inflammatory nutritional prognostic index; OS: Overall survival.
- Citation: Wang L, Chen MZ, Liu L, Jiang ZN, Zhang SM, Zhang MS, Zhang XX, Liu RQ, Wang DS. Novel inflammatory-nutritional prognostic index for advanced gastric cancer patients undergoing gastrectomy and prophylactic hyperthermic intraperitoneal chemotherapy. World J Gastrointest Surg 2025; 17(5): 102201
- URL: https://www.wjgnet.com/1948-9366/full/v17/i5/102201.htm
- DOI: https://dx.doi.org/10.4240/wjgs.v17.i5.102201


