Copyright
©The Author(s) 2025.
World J Gastrointest Surg. Apr 27, 2025; 17(4): 104187
Published online Apr 27, 2025. doi: 10.4240/wjgs.v17.i4.104187
Published online Apr 27, 2025. doi: 10.4240/wjgs.v17.i4.104187
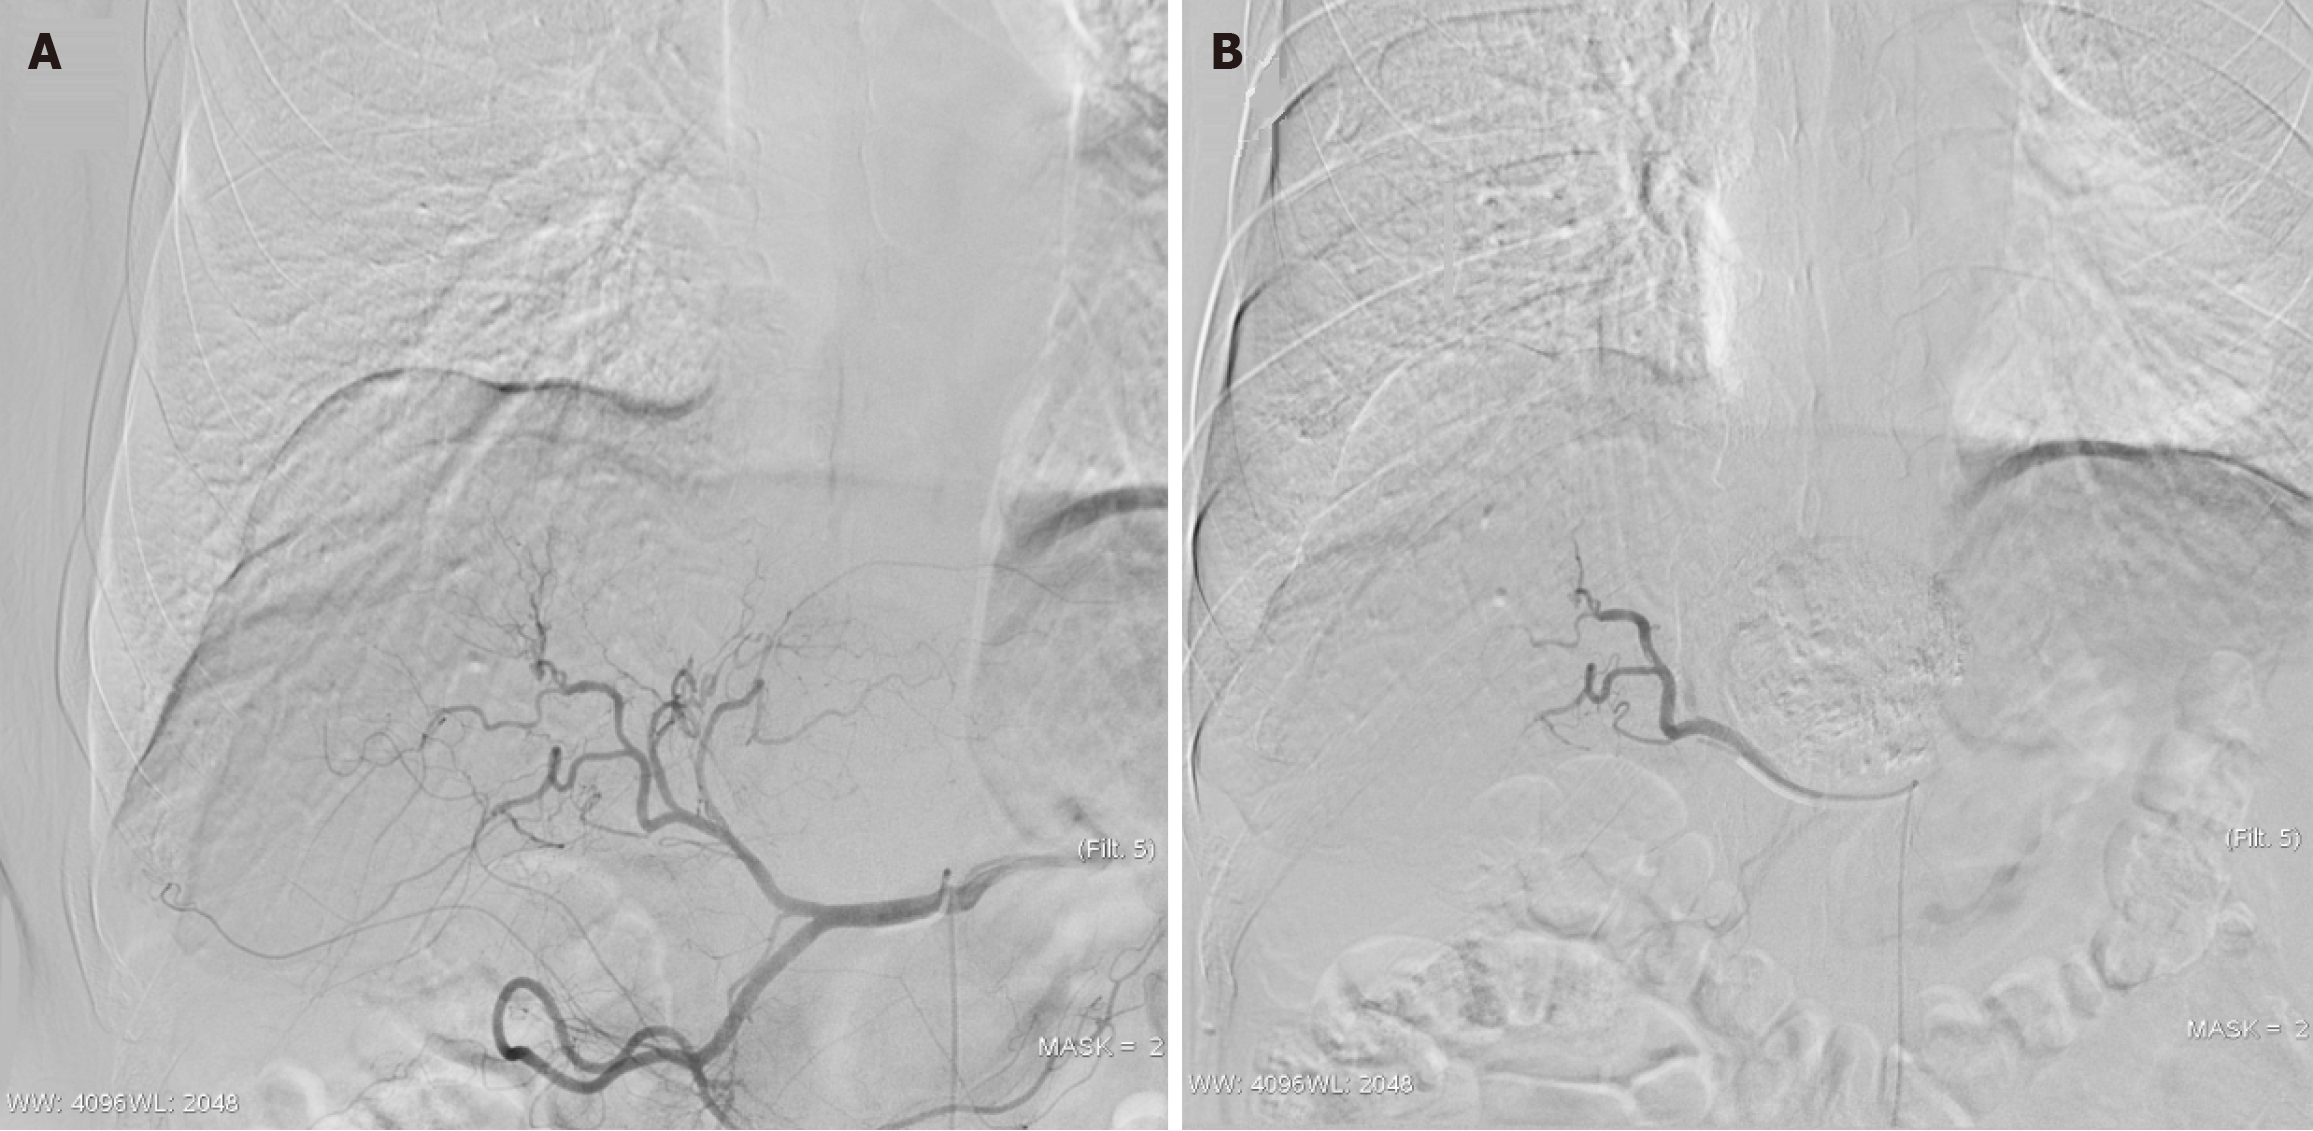
Figure 1 Angiographic images before and after transcatheter arterial chemoembolization procedure.
A: The pre-transcatheter arterial chemoembolization image reveals a hypervascular tumor blush, indicating the presence of a highly vascularized liver tumor; B: The post-transcatheter arterial chemoembolization image demonstrates that the tumor blush has significantly decreased in intensity.
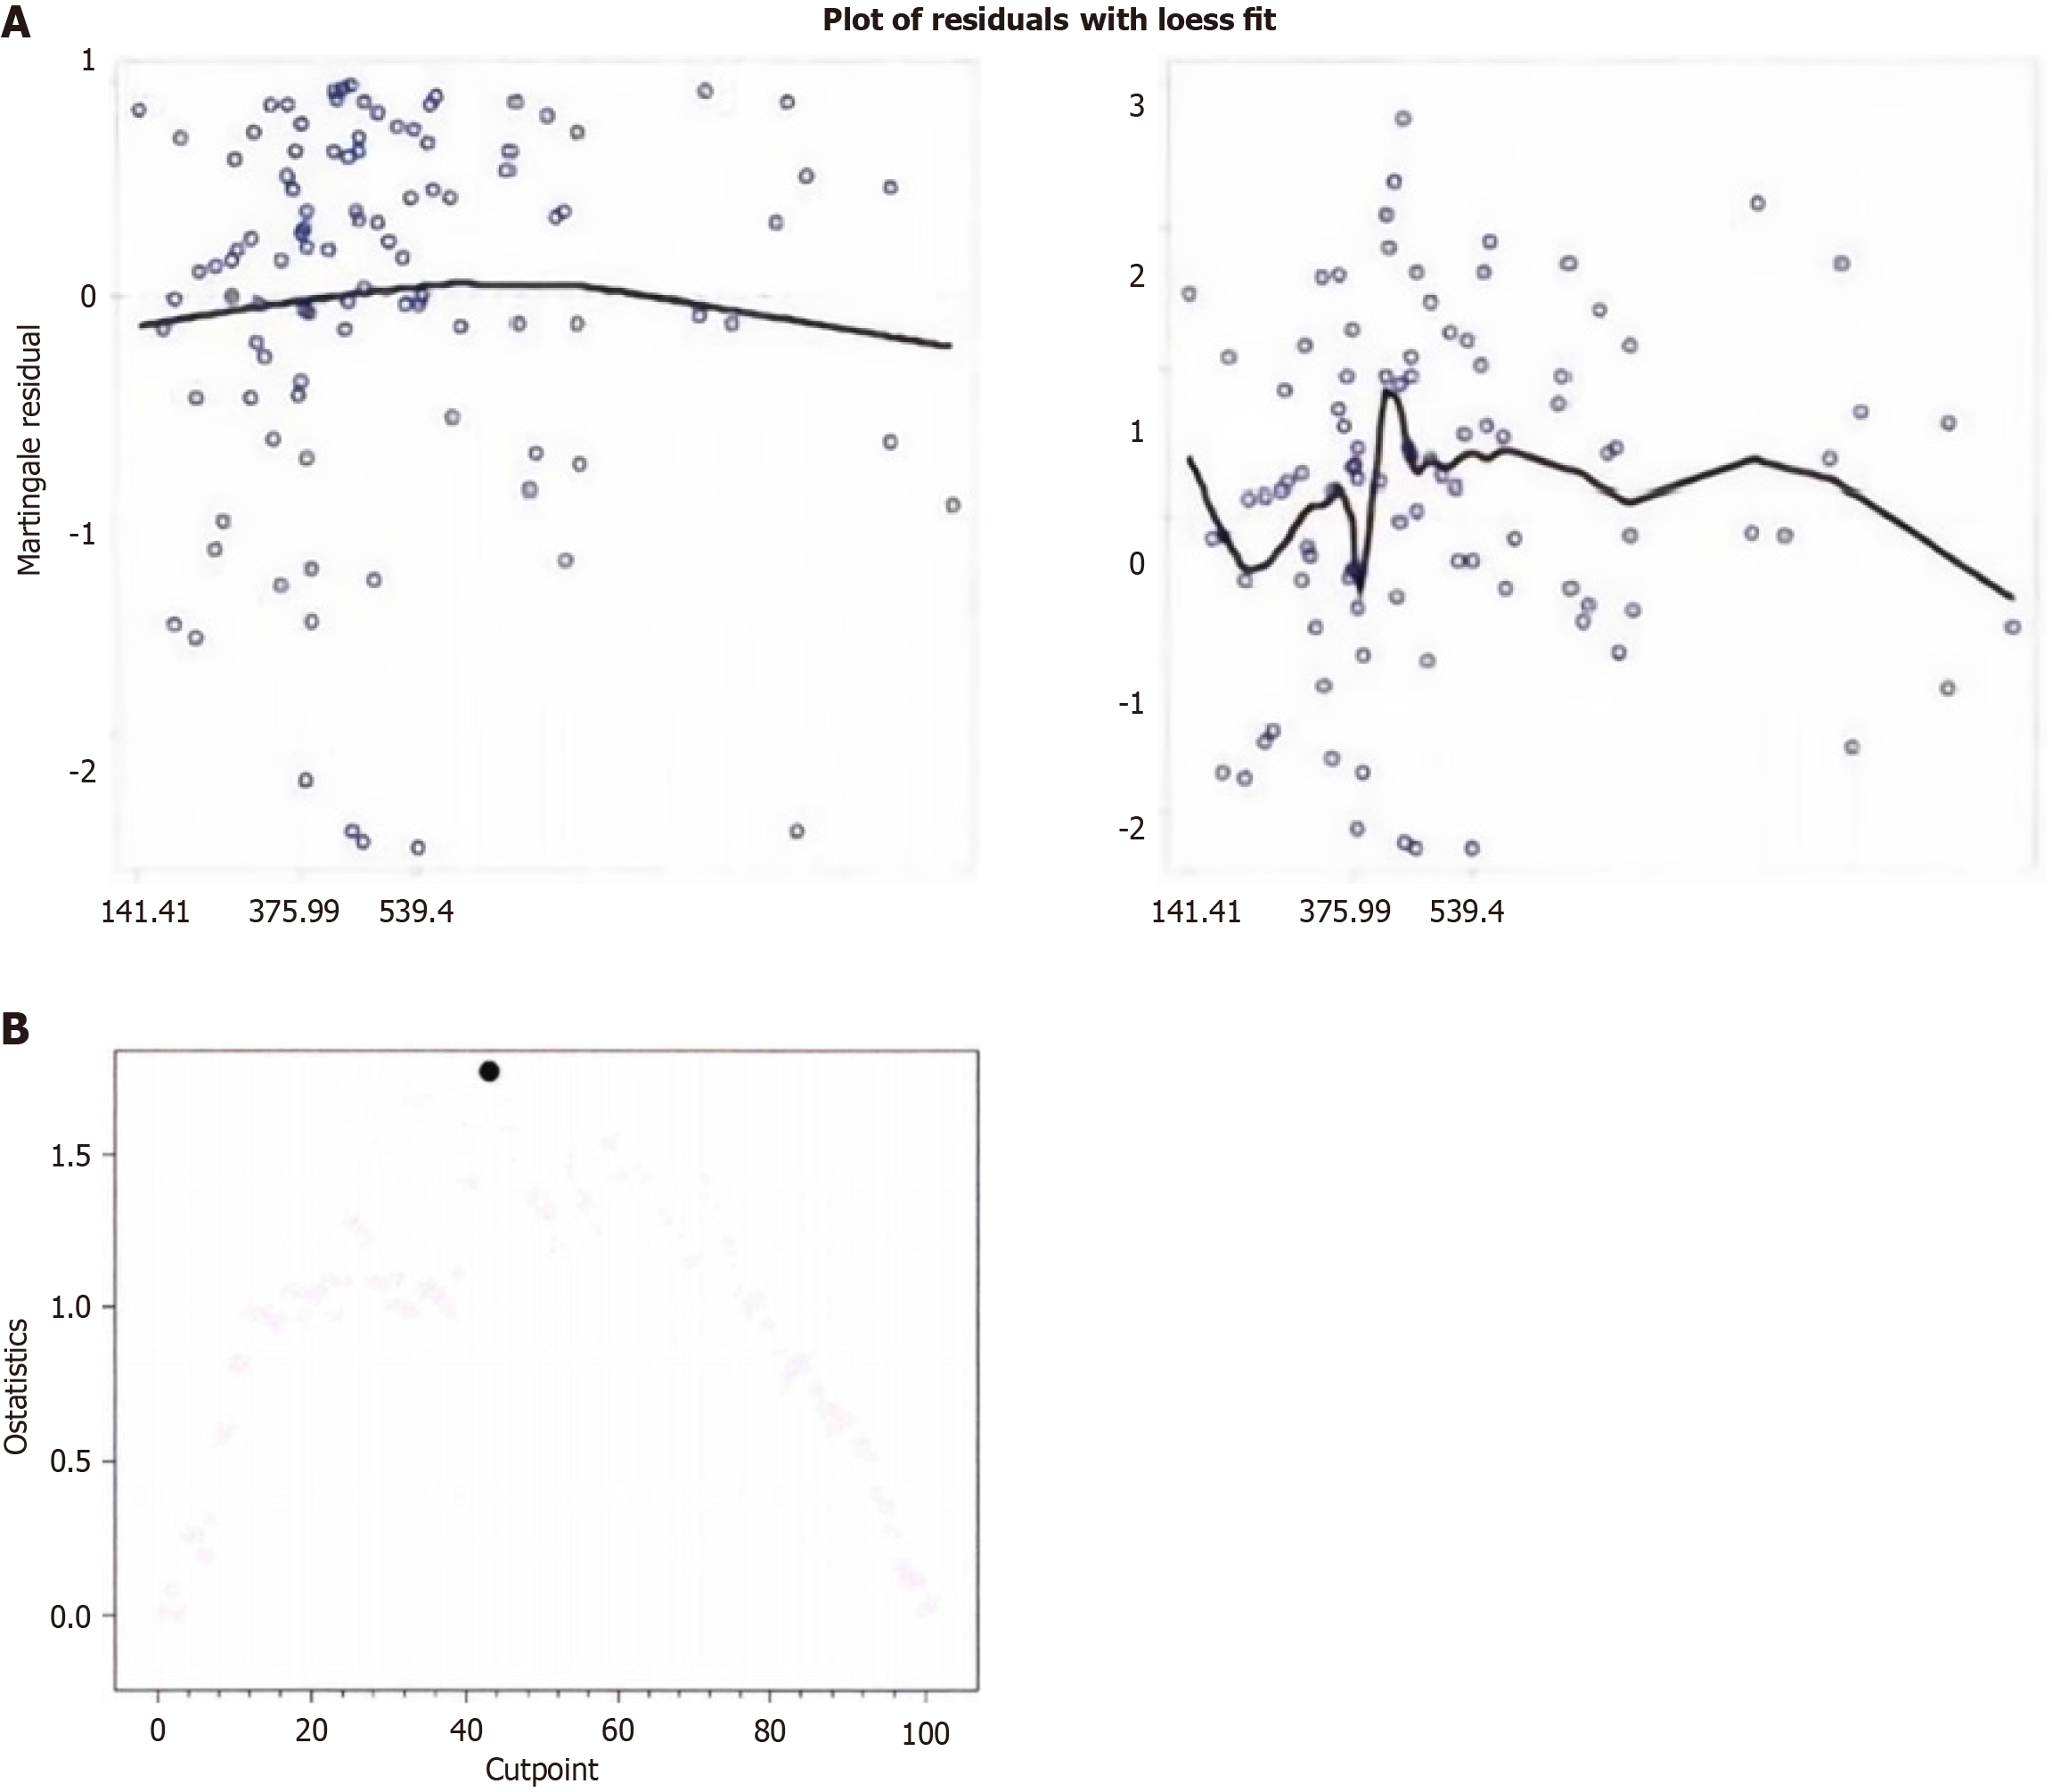
Figure 2 Enhanced tumor volume before the first transcatheter arterial chemoembolization treatment.
A: Martingale residual local weighted scatterplot smoothing line of enhanced tumor volume before the first transcatheter arterial chemoembolization treatment; B: Enhanced tumor volume threshold before the first transcatheter arterial chemoembolization treatment corrected using bias field.
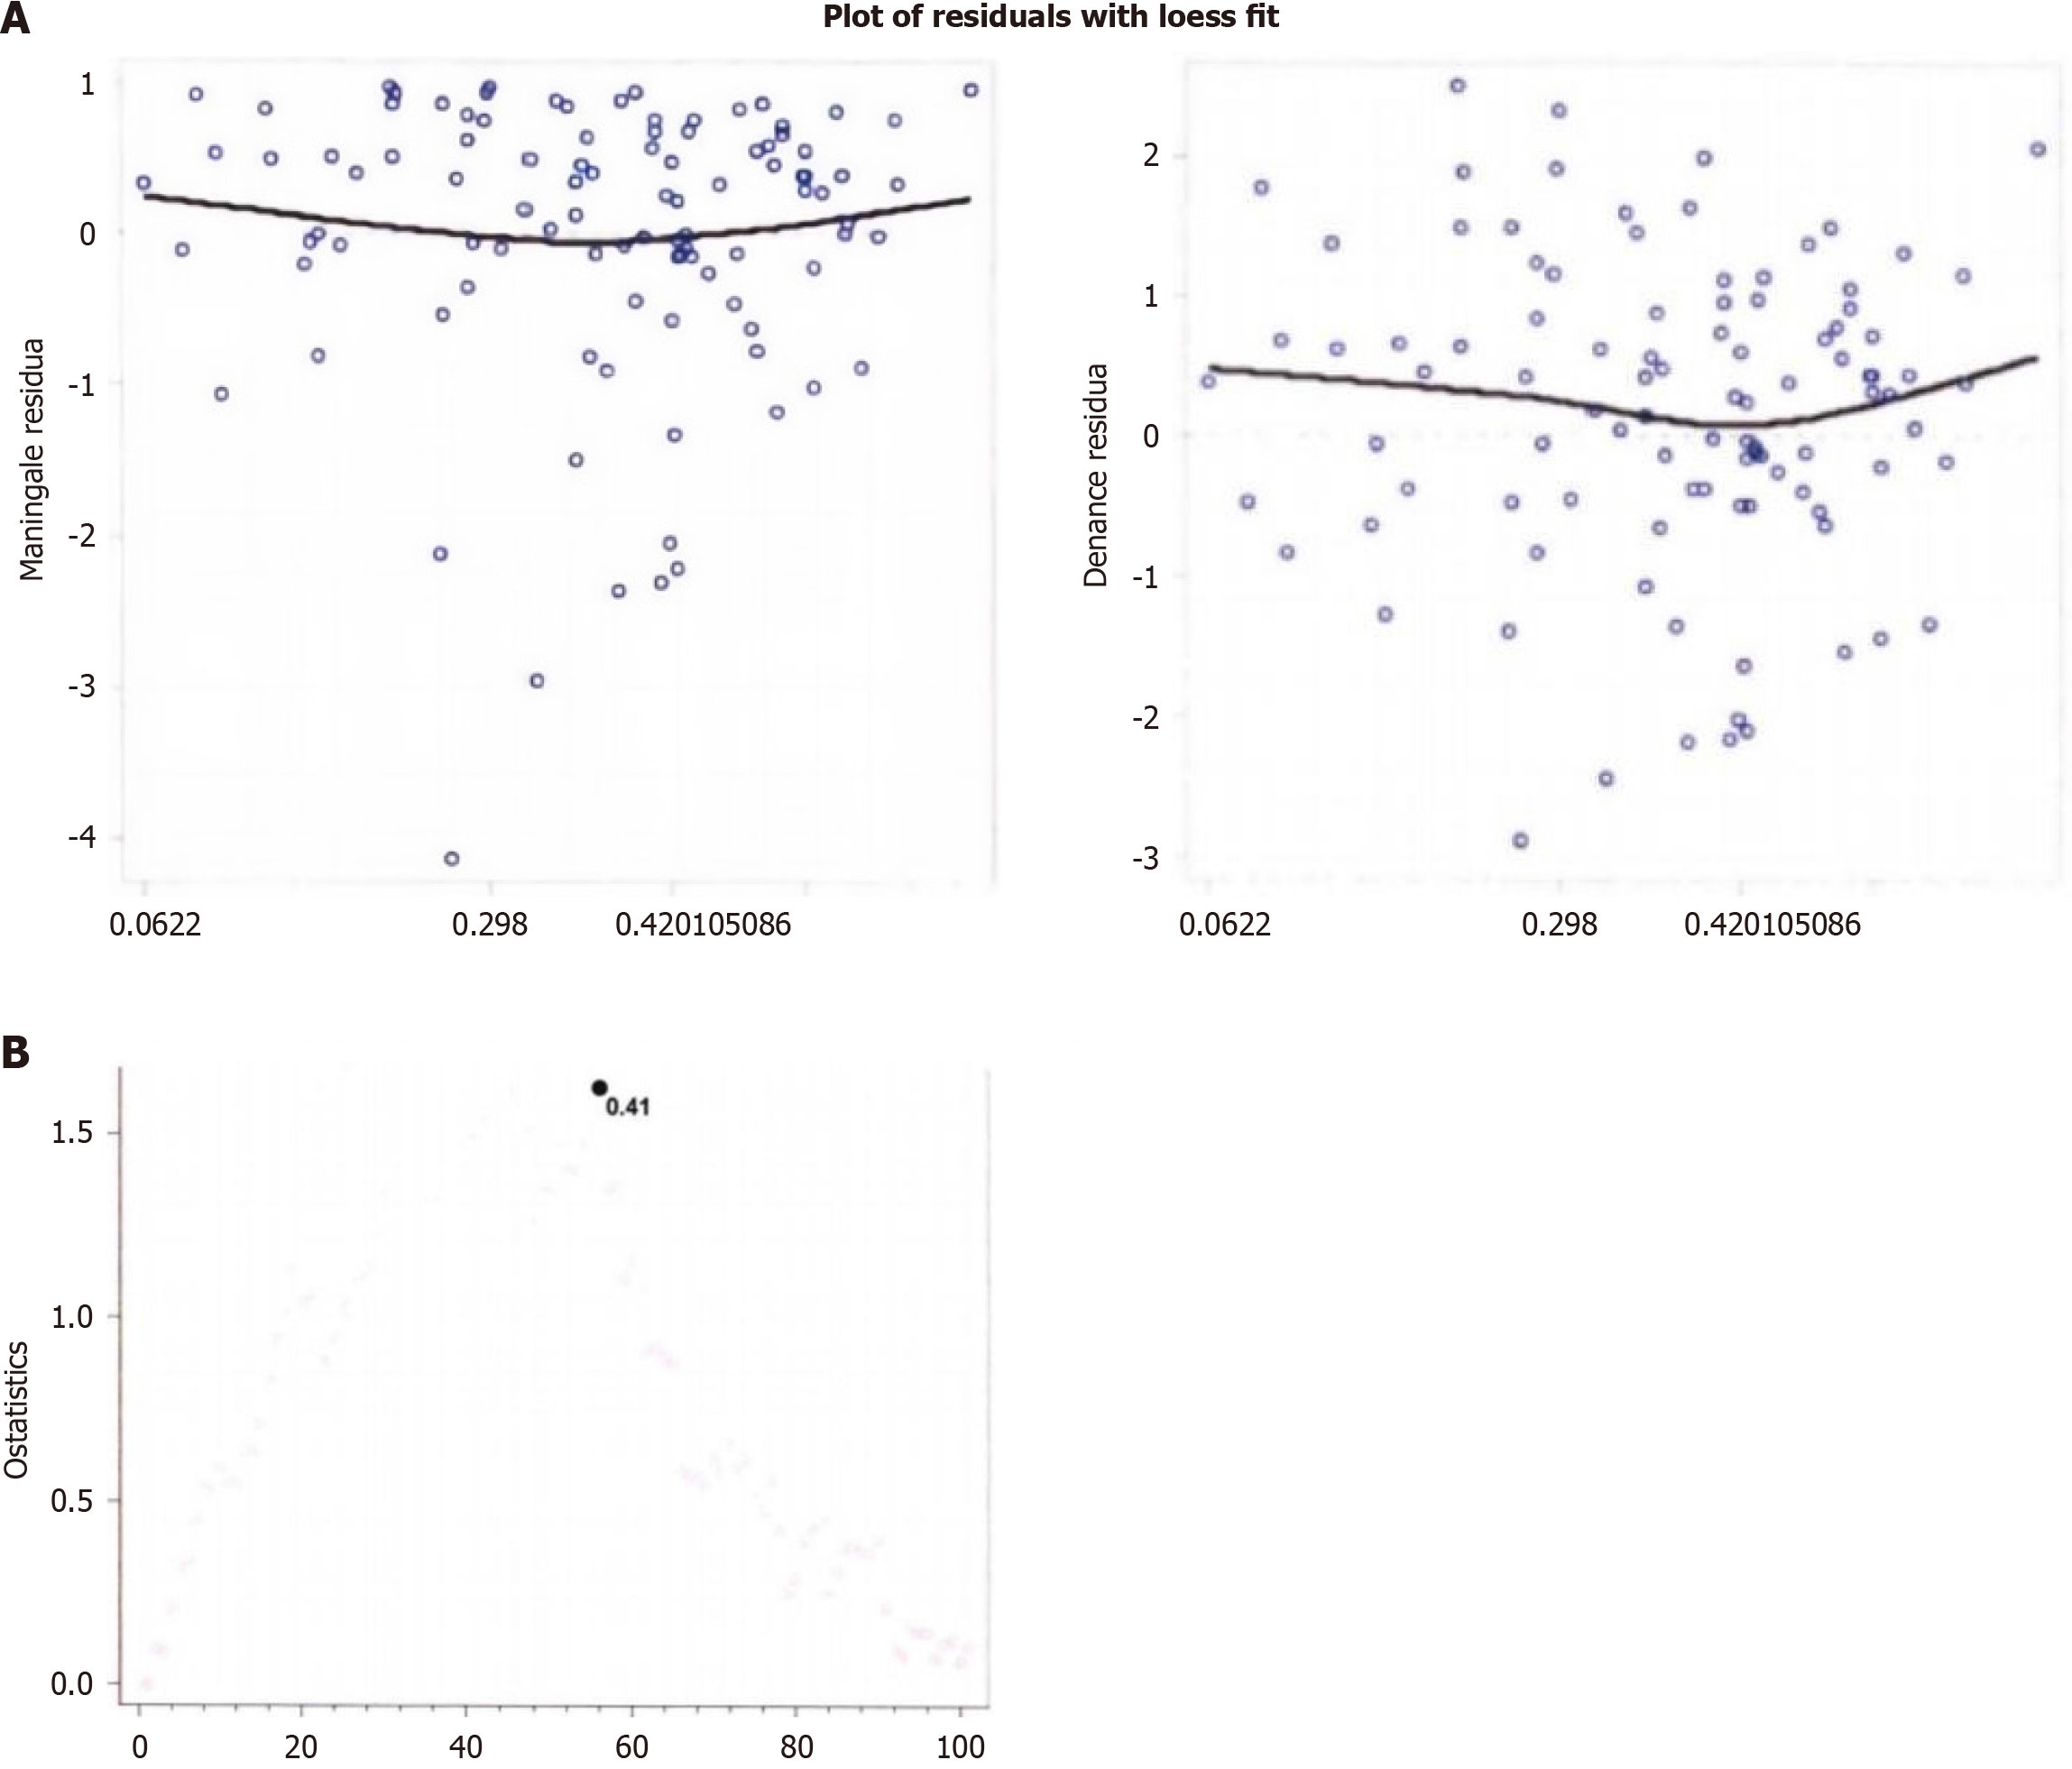
Figure 3 Local weighted scatterplot smoothing line of martingale residuals for enhanced tumor volume% before the first transcatheter arterial chemoembolization treatment.
A: Martingale residual local weighted scatterplot smoothing line for enhanced tumor volume%; B: The critical value of enhanced tumor volume% before and after transcatheter arterial chemoembolization treatment with magnetic resonance bias field correction.
- Citation: Liu K, Li JB, Wang Y, Li Y. Magnetic resonance imaging bias field correction improves tumor prognostic evaluation after transcatheter arterial chemoembolization for liver cancer. World J Gastrointest Surg 2025; 17(4): 104187
- URL: https://www.wjgnet.com/1948-9366/full/v17/i4/104187.htm
- DOI: https://dx.doi.org/10.4240/wjgs.v17.i4.104187


