Copyright
©The Author(s) 2025.
World J Gastrointest Surg. Apr 27, 2025; 17(4): 100617
Published online Apr 27, 2025. doi: 10.4240/wjgs.v17.i4.100617
Published online Apr 27, 2025. doi: 10.4240/wjgs.v17.i4.100617
Figure 1 Comparison of stress indicators.
A: Comparison of C-reactive protein levels before and after treatment in two groups; B: Comparison of white blood cell levels before and after treatment in two groups. aP < 0.05 the group before vs after treatment. bP < 0.05 between groups after treatment. CRP: C-reactive protein; WBC: White blood cell.
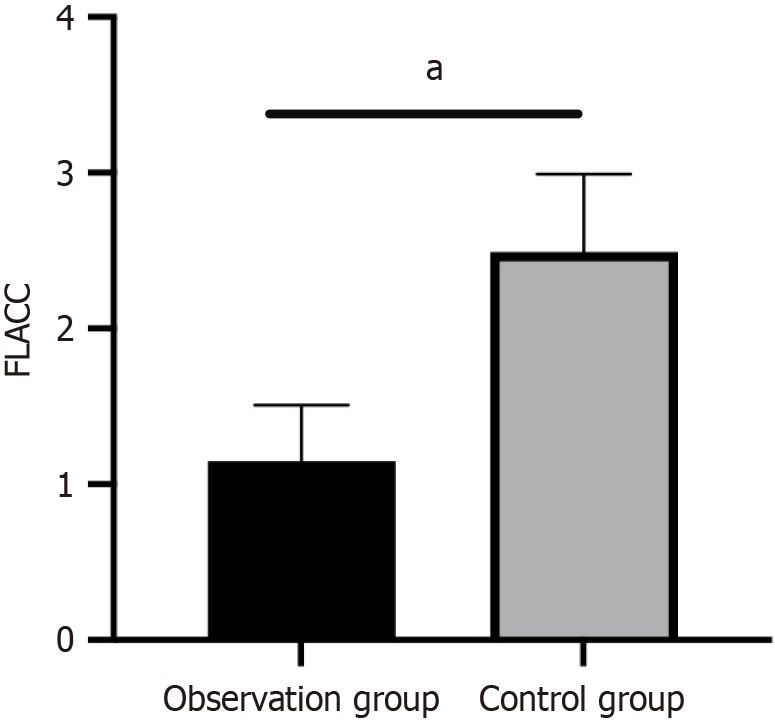
Figure 2 Comparison of postoperative pain between the two groups.
FLACC pain assessment (face: Facial expression; legs: Leg activity; activity: Body position; cry: Crying; consolability: Consolability) was performed 24 hours after surgery. aP < 0.05 for the comparison between the two groups.
- Citation: Wang XQ, Kong CH. Single-incision laparoscopic herniorrhaphy needle treatment for pediatric inguinal hernia: Surgical outcome, postoperative complications, and serum inflammation effects. World J Gastrointest Surg 2025; 17(4): 100617
- URL: https://www.wjgnet.com/1948-9366/full/v17/i4/100617.htm
- DOI: https://dx.doi.org/10.4240/wjgs.v17.i4.100617


