Copyright
©The Author(s) 2025.
World J Gastrointest Surg. Mar 27, 2025; 17(3): 102638
Published online Mar 27, 2025. doi: 10.4240/wjgs.v17.i3.102638
Published online Mar 27, 2025. doi: 10.4240/wjgs.v17.i3.102638
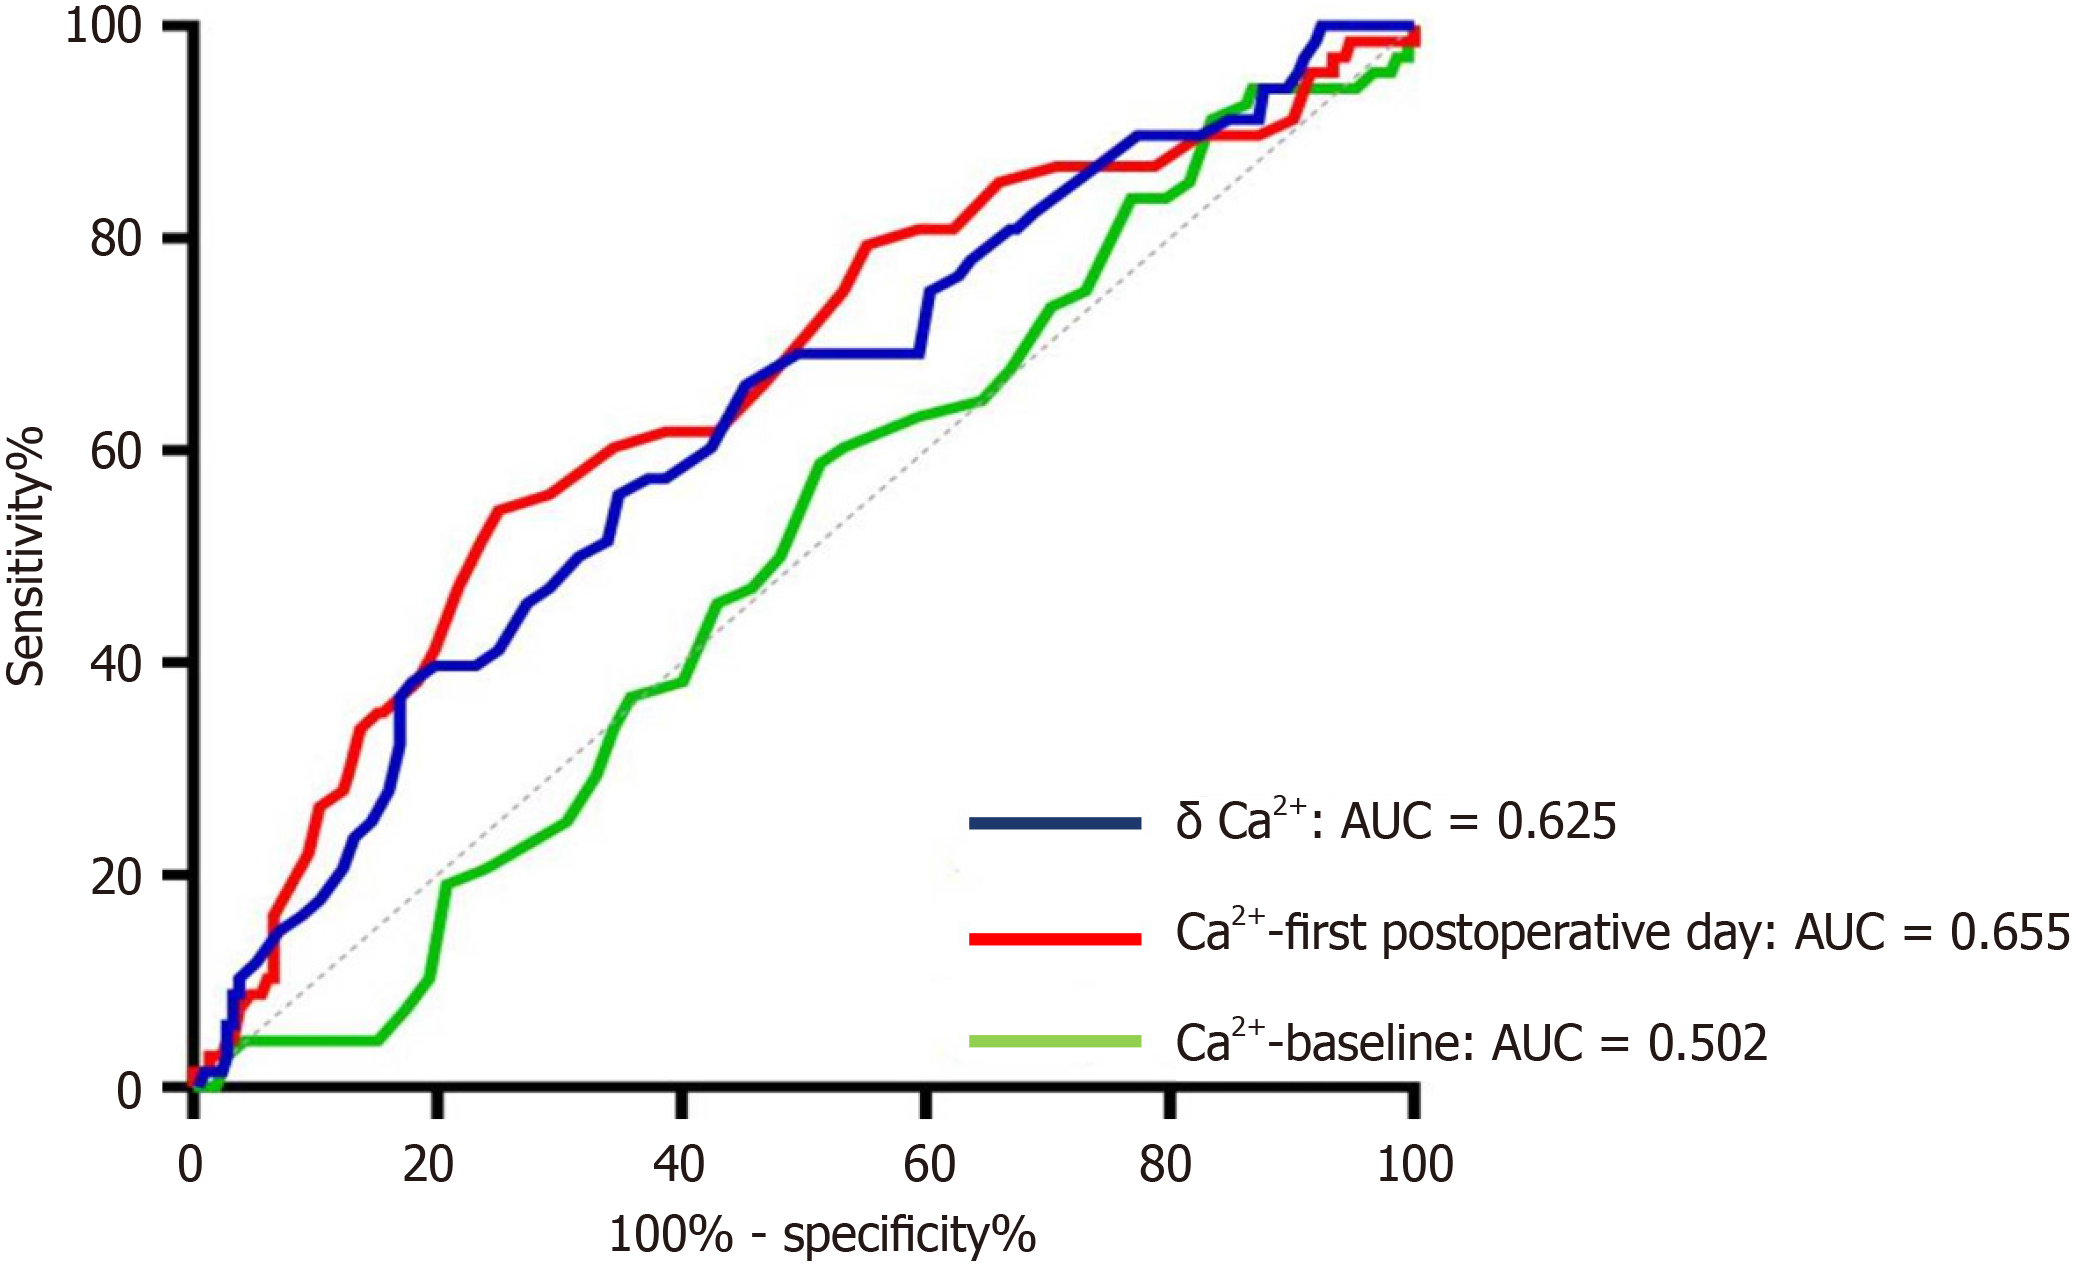
Figure 1 Receiver operating characteristic curve of serum calcium ion-related indicators to predict outcome.
δCa2+: Delta serum calcium; AUC: Area under the receiver operating characteristic curve; Ca2+-baseline: Baseline serum calcium ion levels; Ca2+-first postoperative day: Serum calcium ion level on the first day of postoperative period.
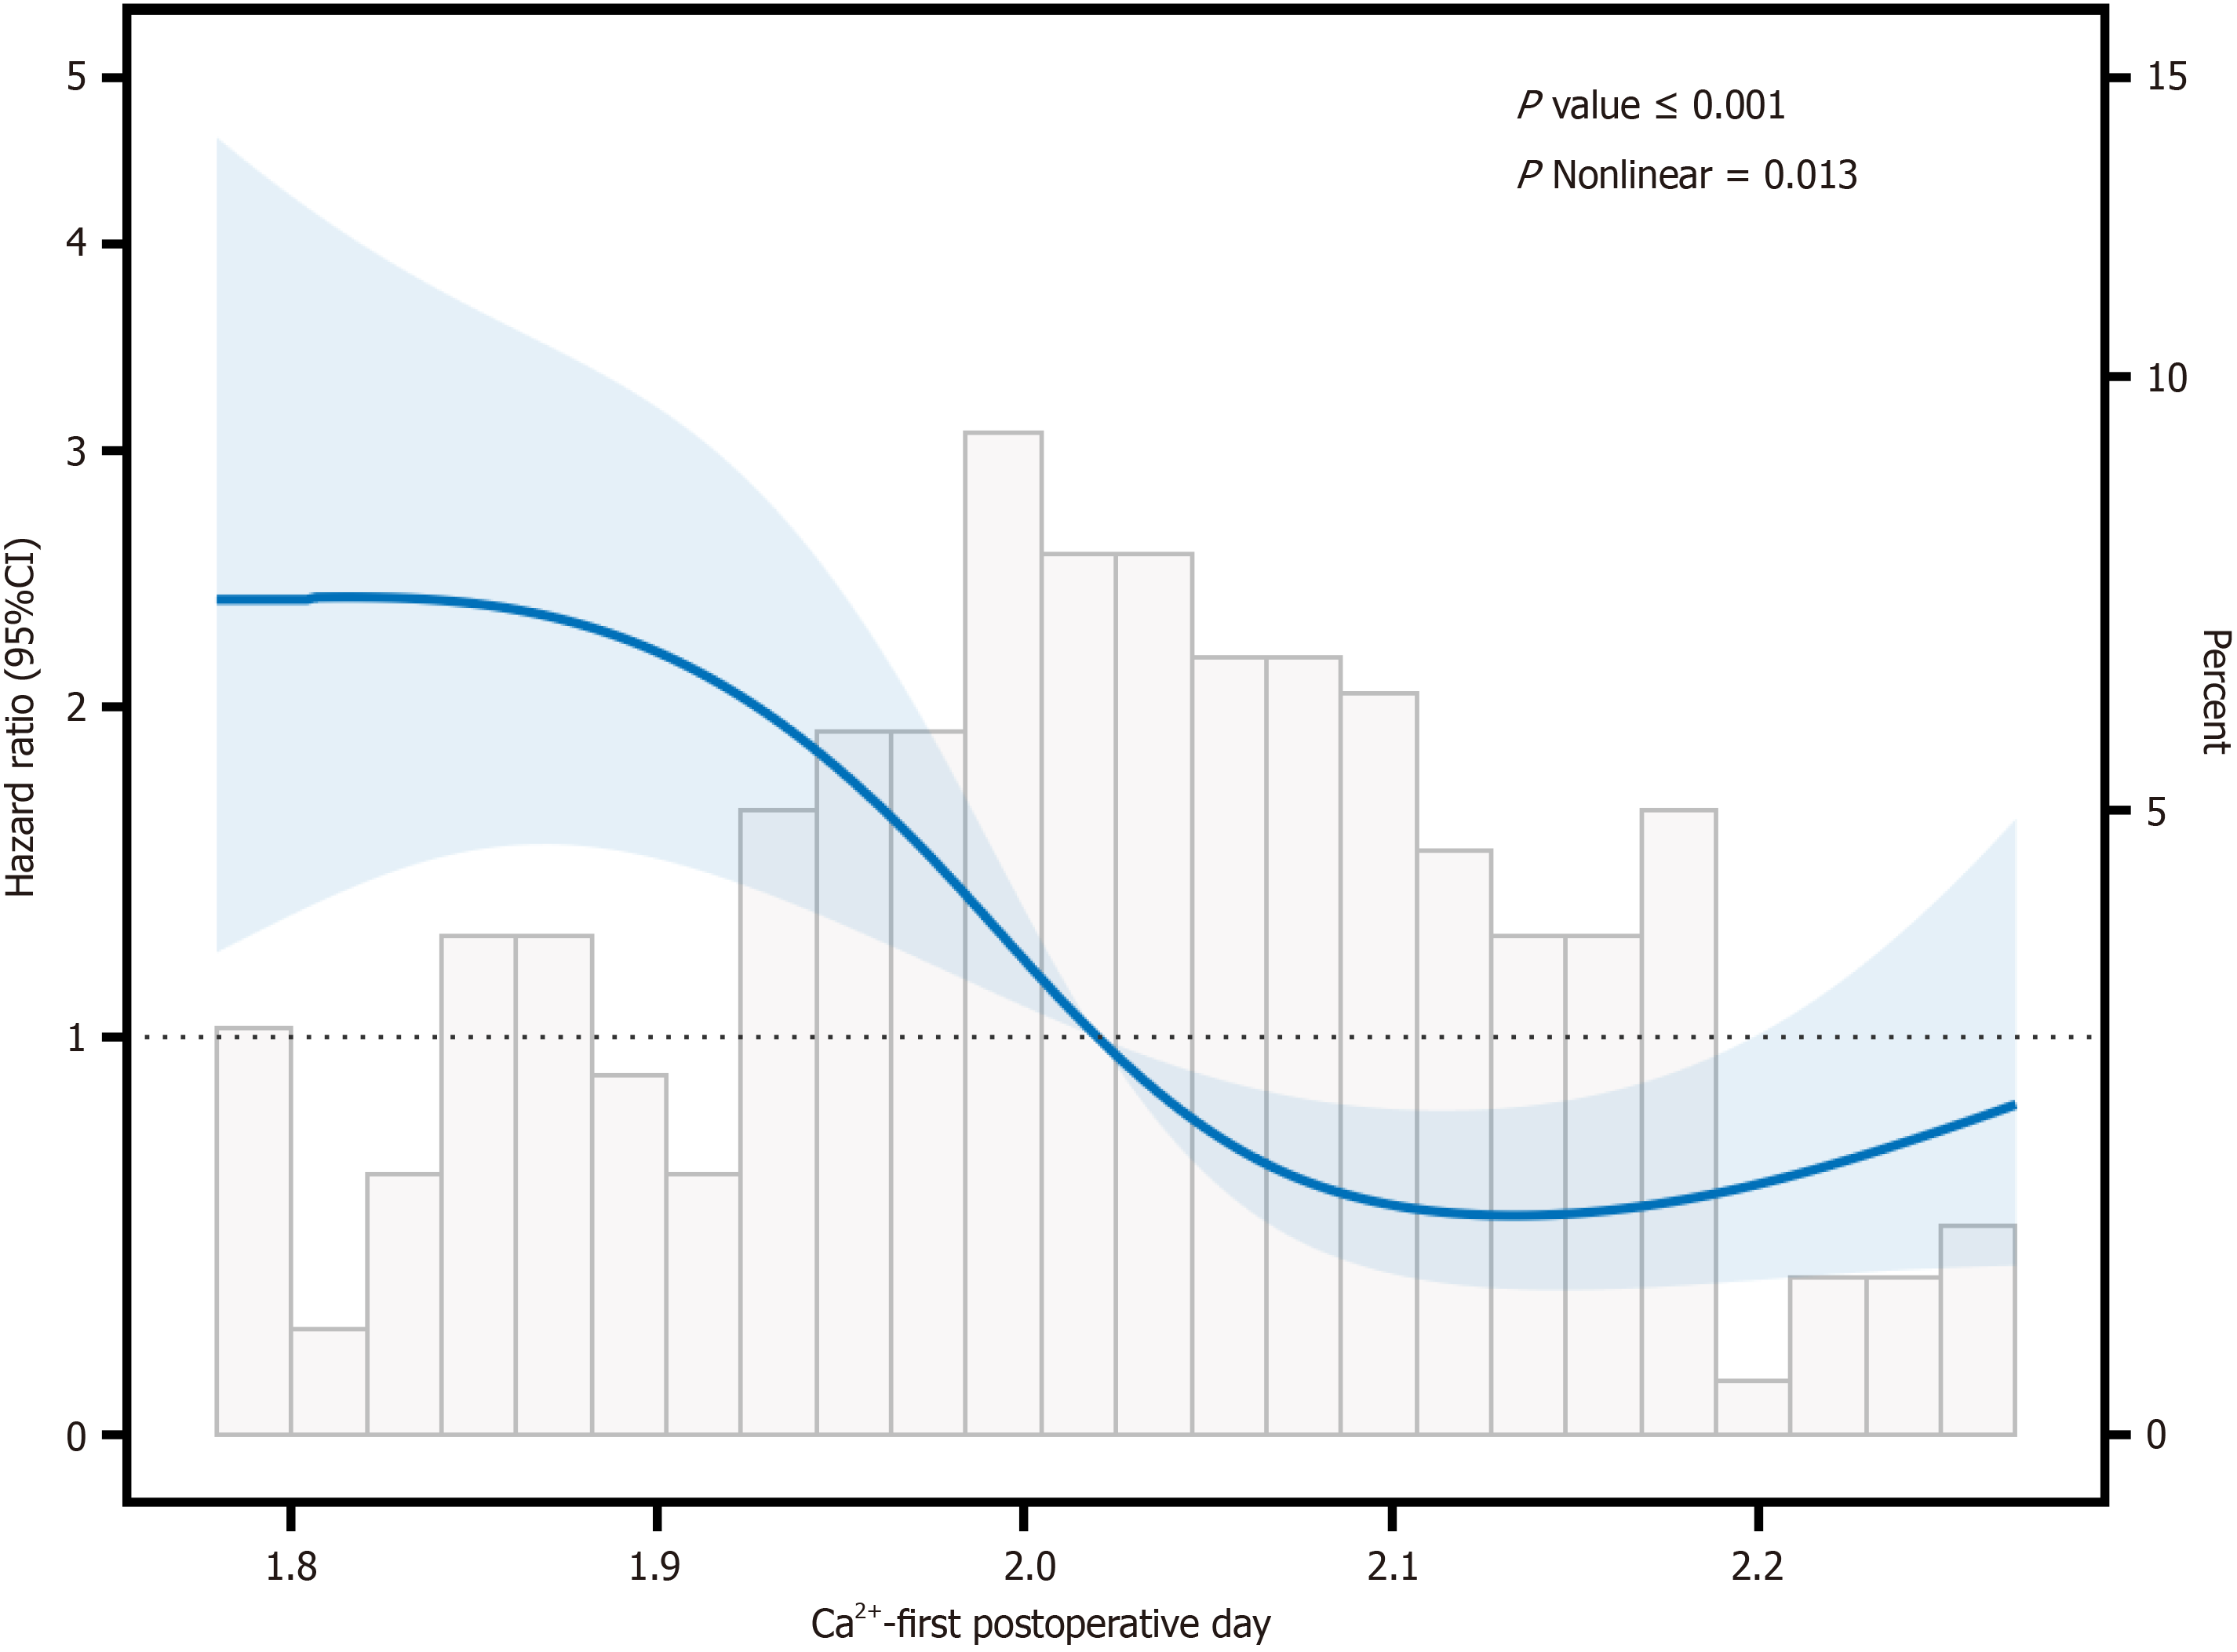
Figure 2 Restricted cubic spline curves for serum calcium ion level on the first day of the postoperative period in colorectal cancer.
Ca2+-first postoperative day: Serum calcium ion level on the first day of postoperative period; CI: Confidence interval.
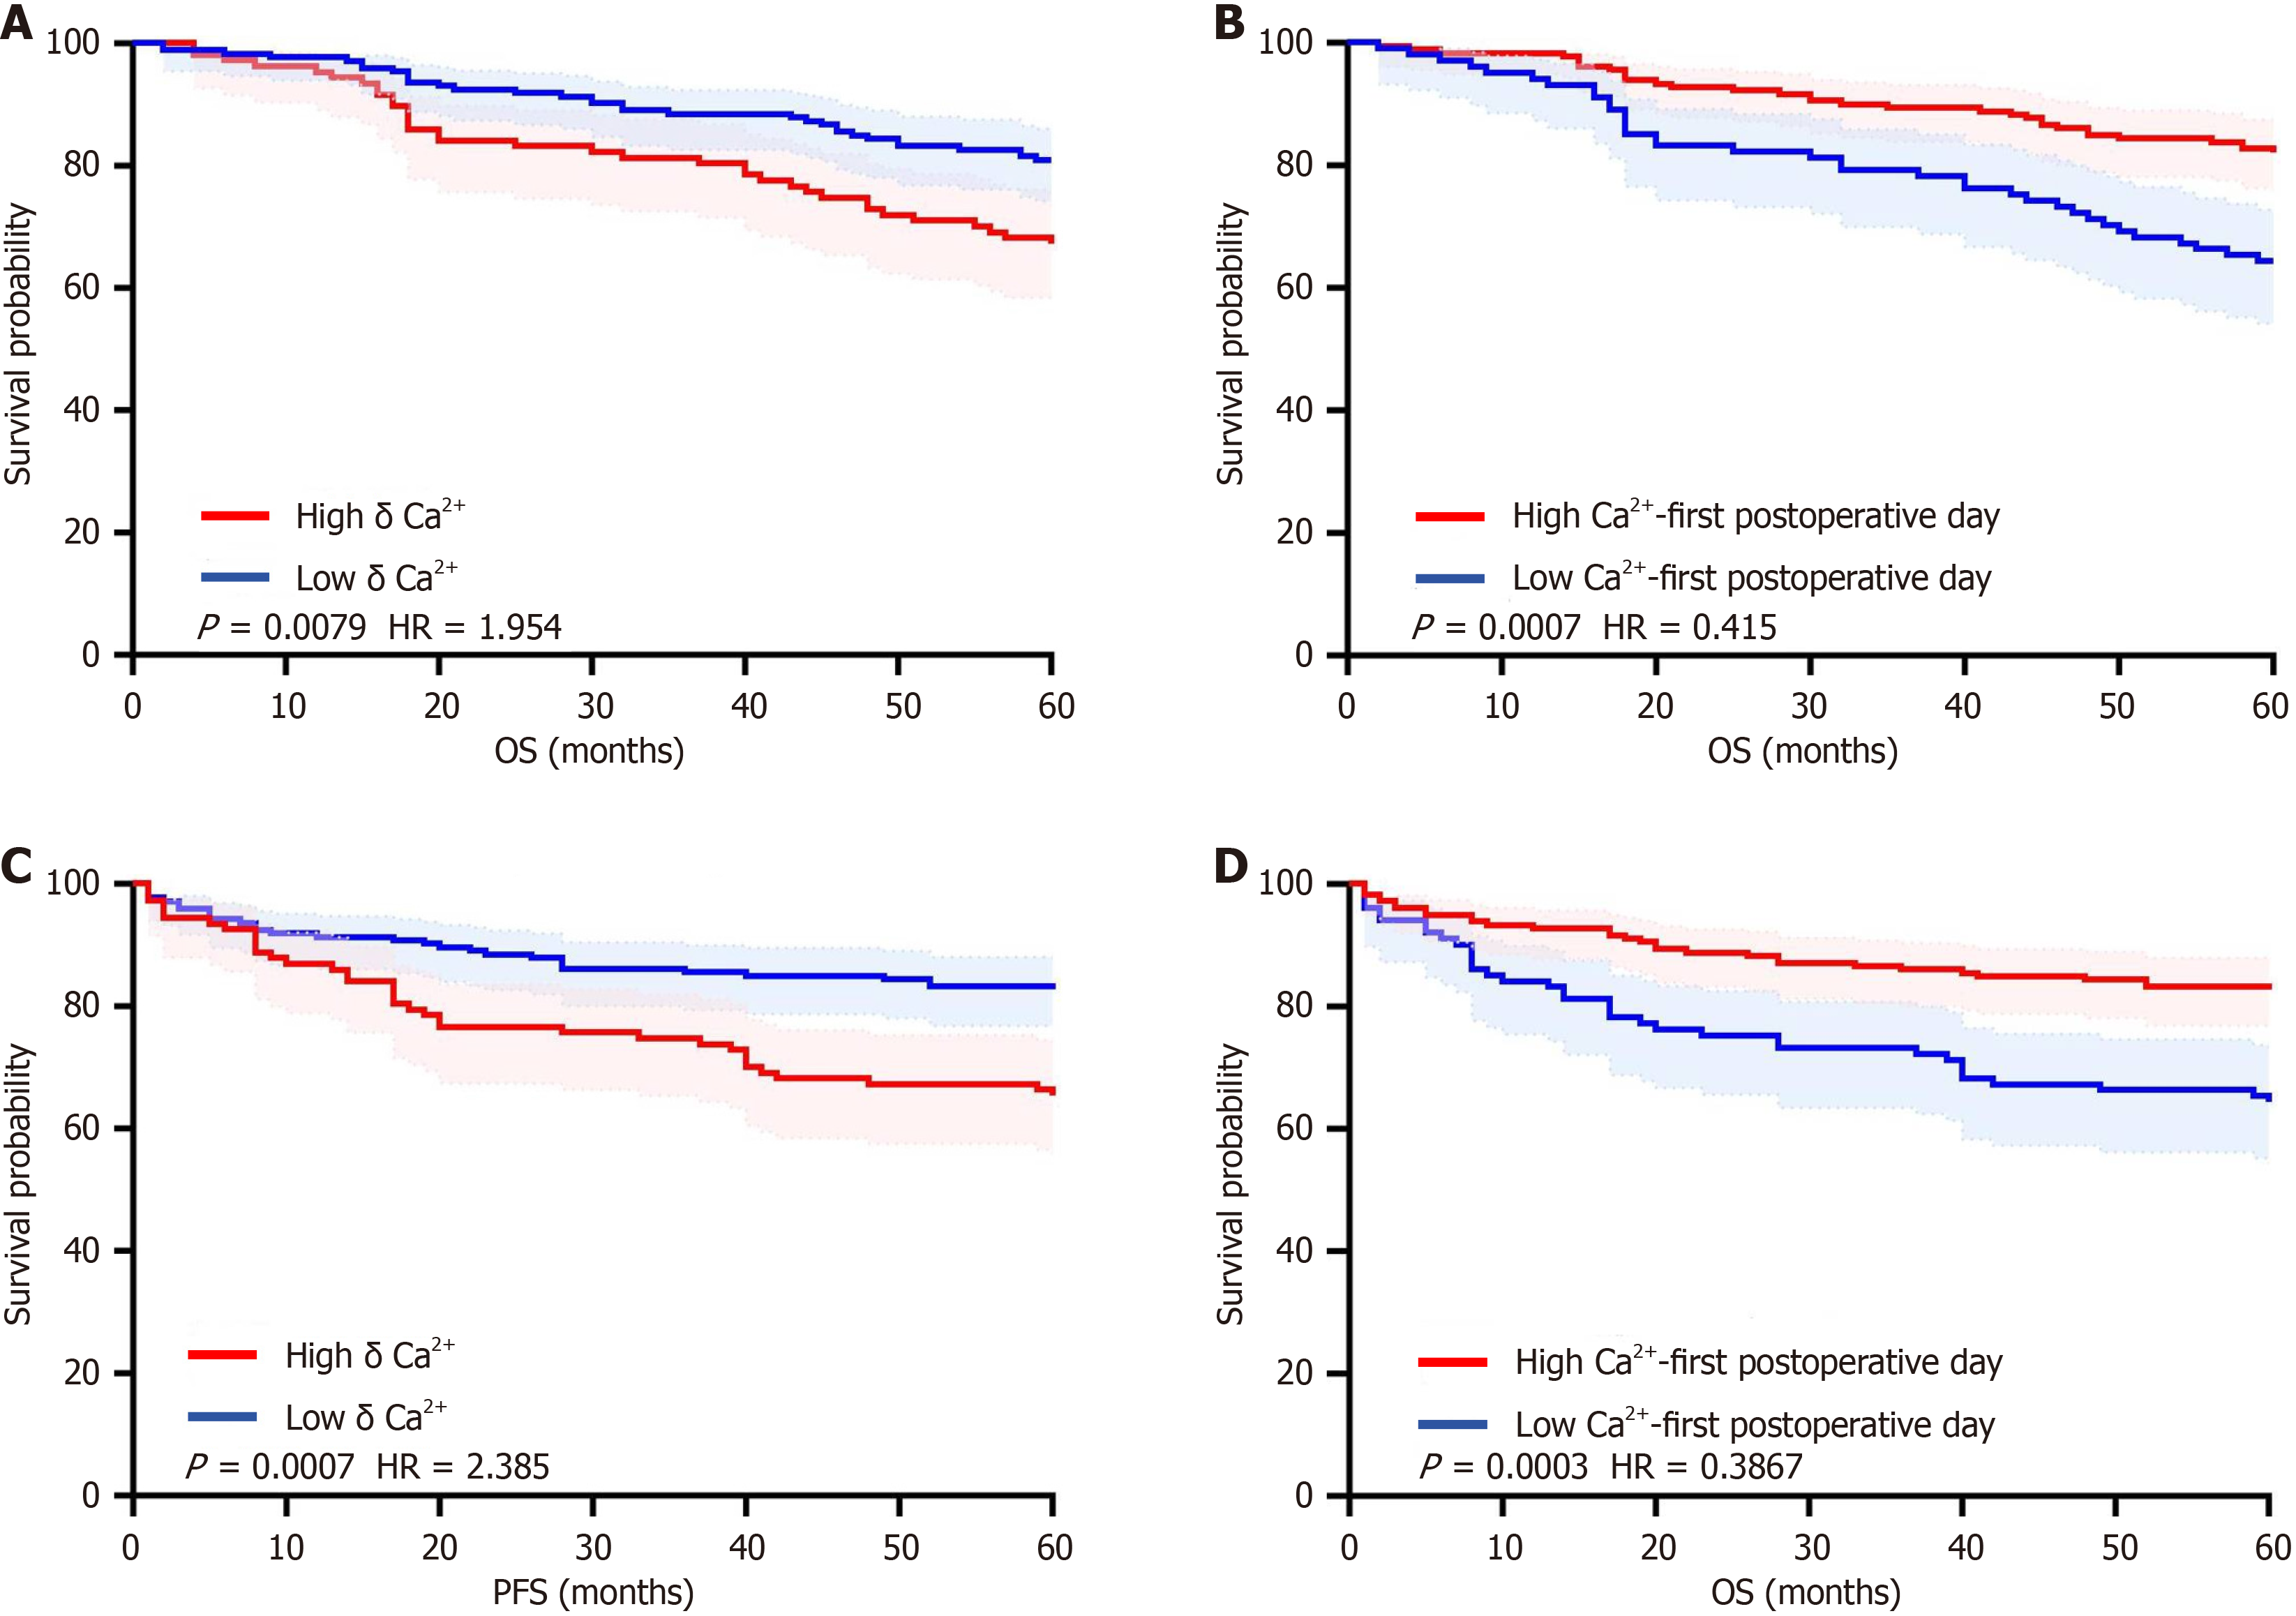
Figure 3 Overall survival and progression-free survival stratified by Δ calcium value and serum calcium ion level on the first day of postoperative period.
A: Overall survival (OS) stratified by delta serum calcium (δCa2+) value (P = 0.0079, hazard ratio [HR] = 1.954); B: OS stratified by serum Ca2+ ion level on the first day of postoperative period (Ca2+-first postoperative day) (P = 0.0007, HR = 0.415); C: Progression-free survival (PFS) stratified by δCa2+ value (P = 0.0007, HR = 2.385); D: PFS stratified by Ca2+-first postoperative day (P = 0.0003, HR = 0.3867).
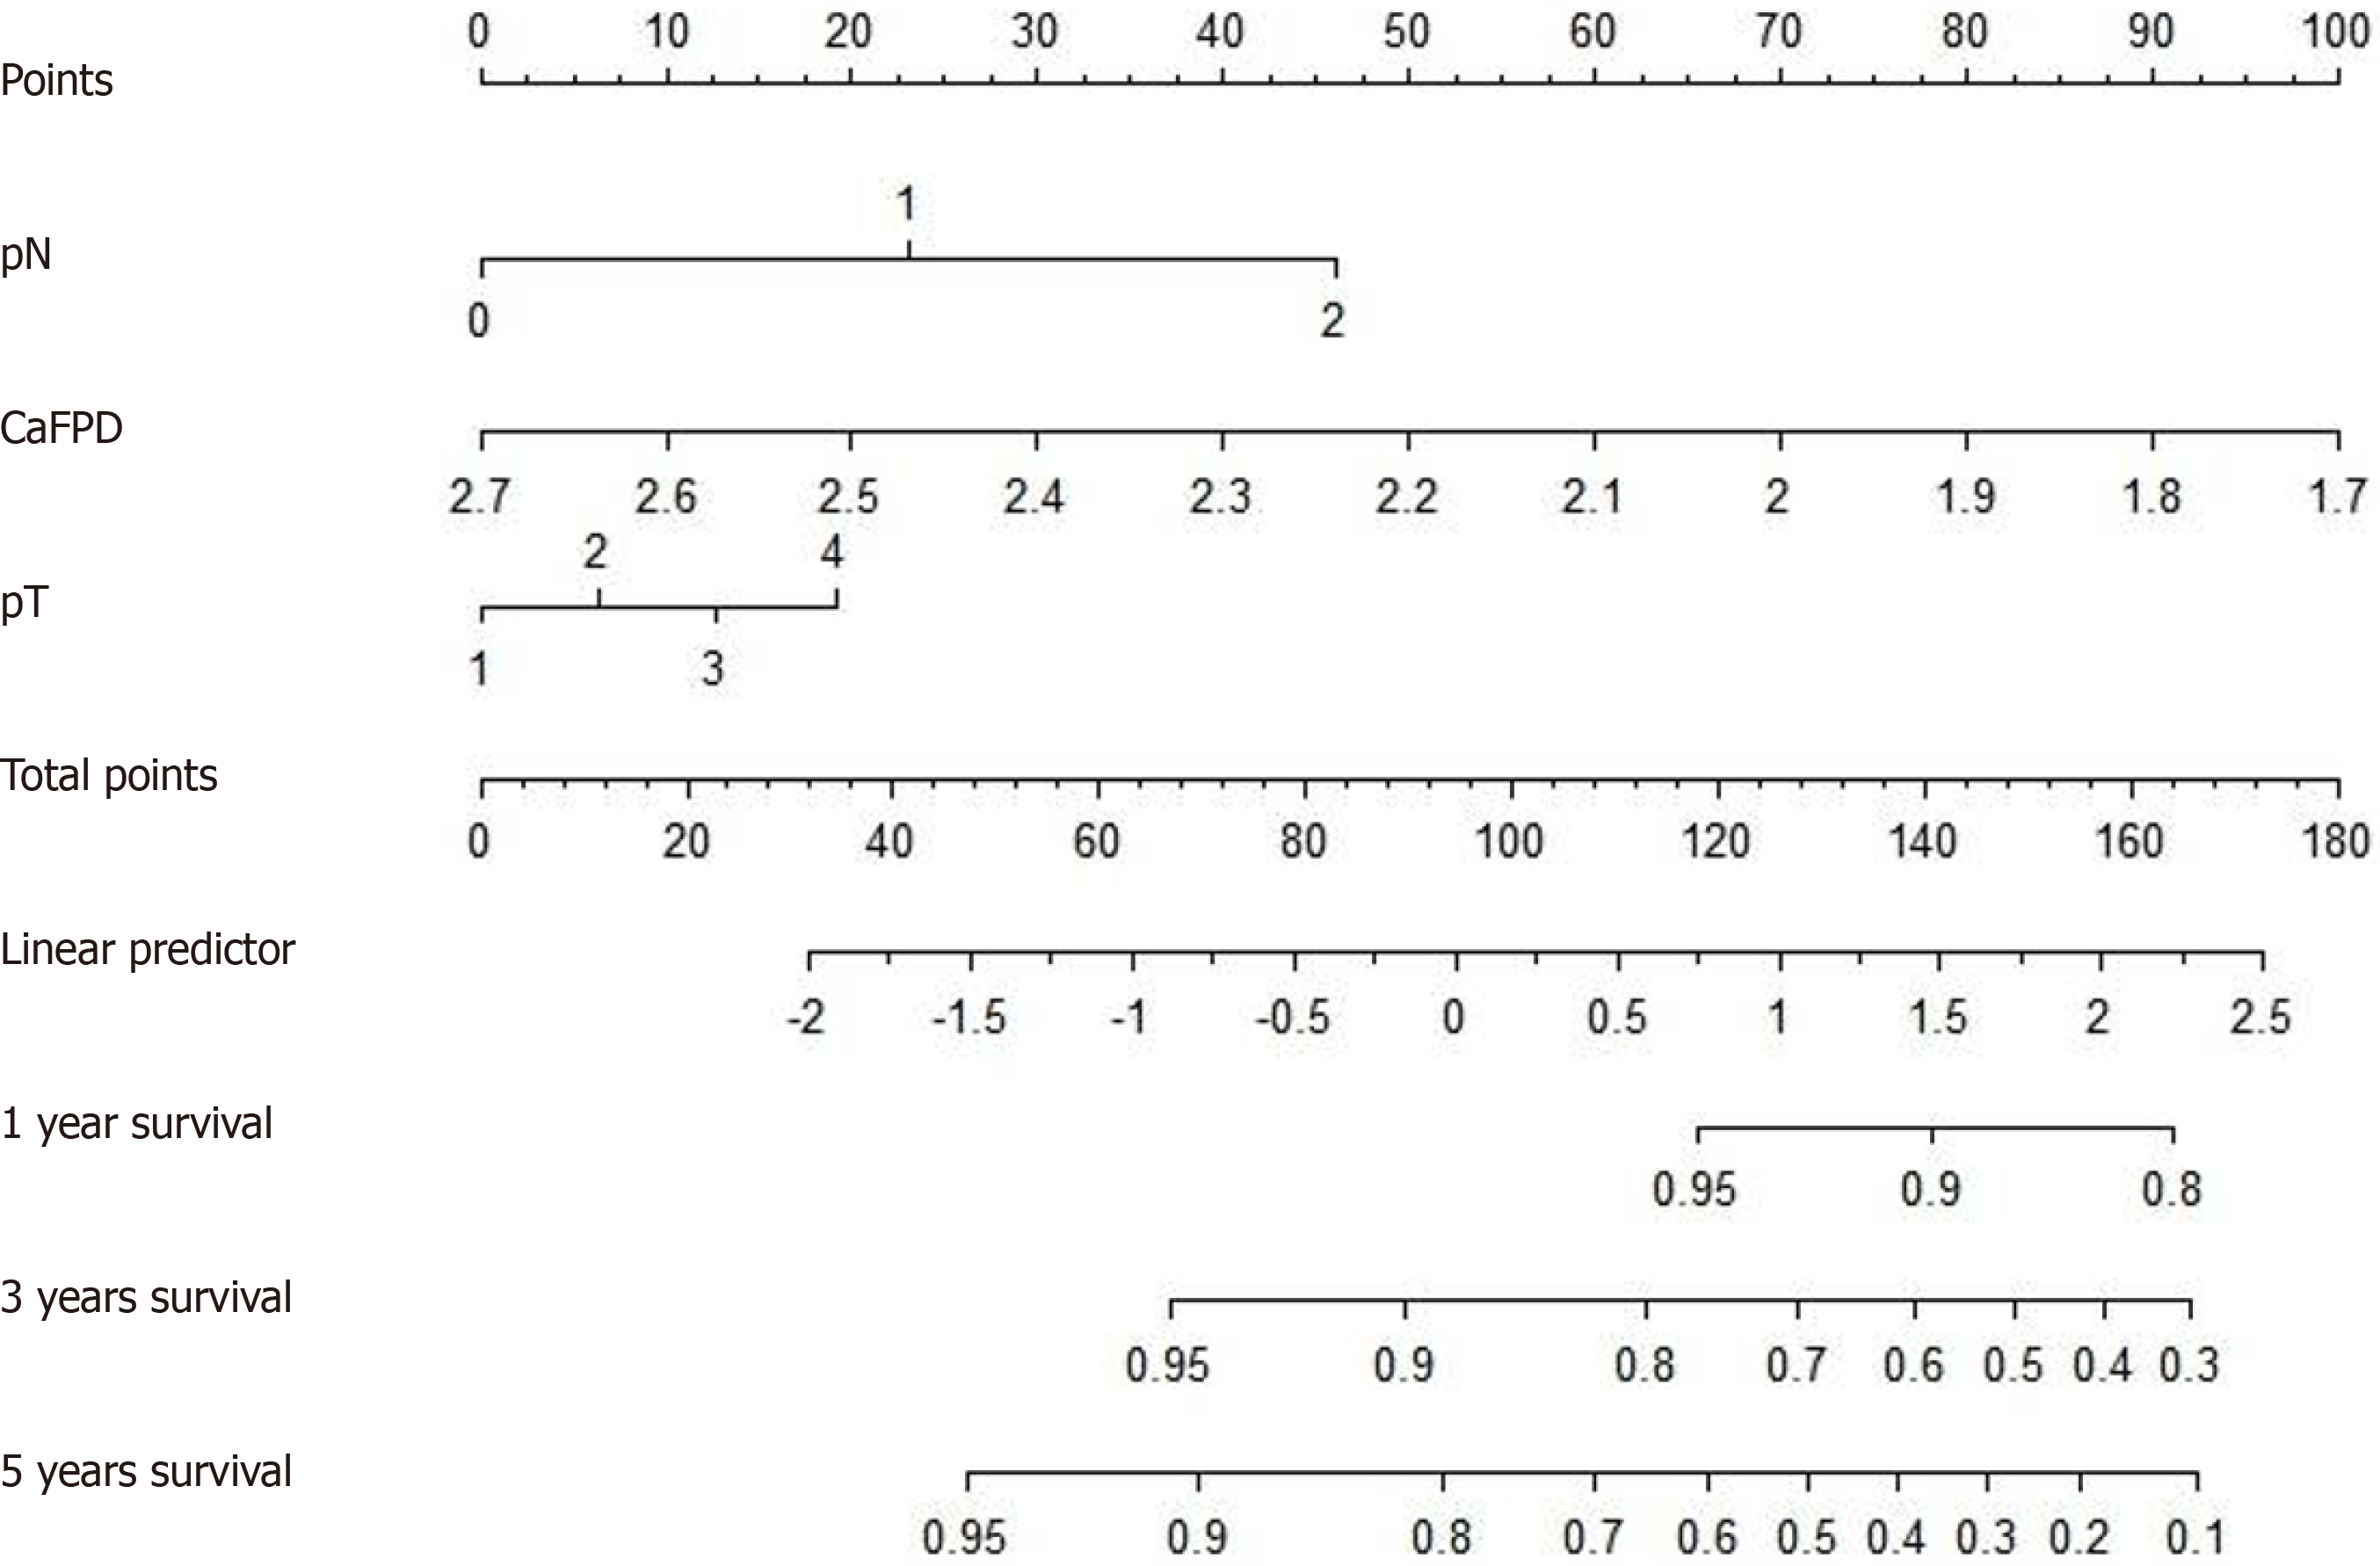
Figure 4 Nomograph of the model composed of T stage, N stage, and serum calcium level on the first postoperative day.
CaFPD: Calcium level on the first postoperative day.
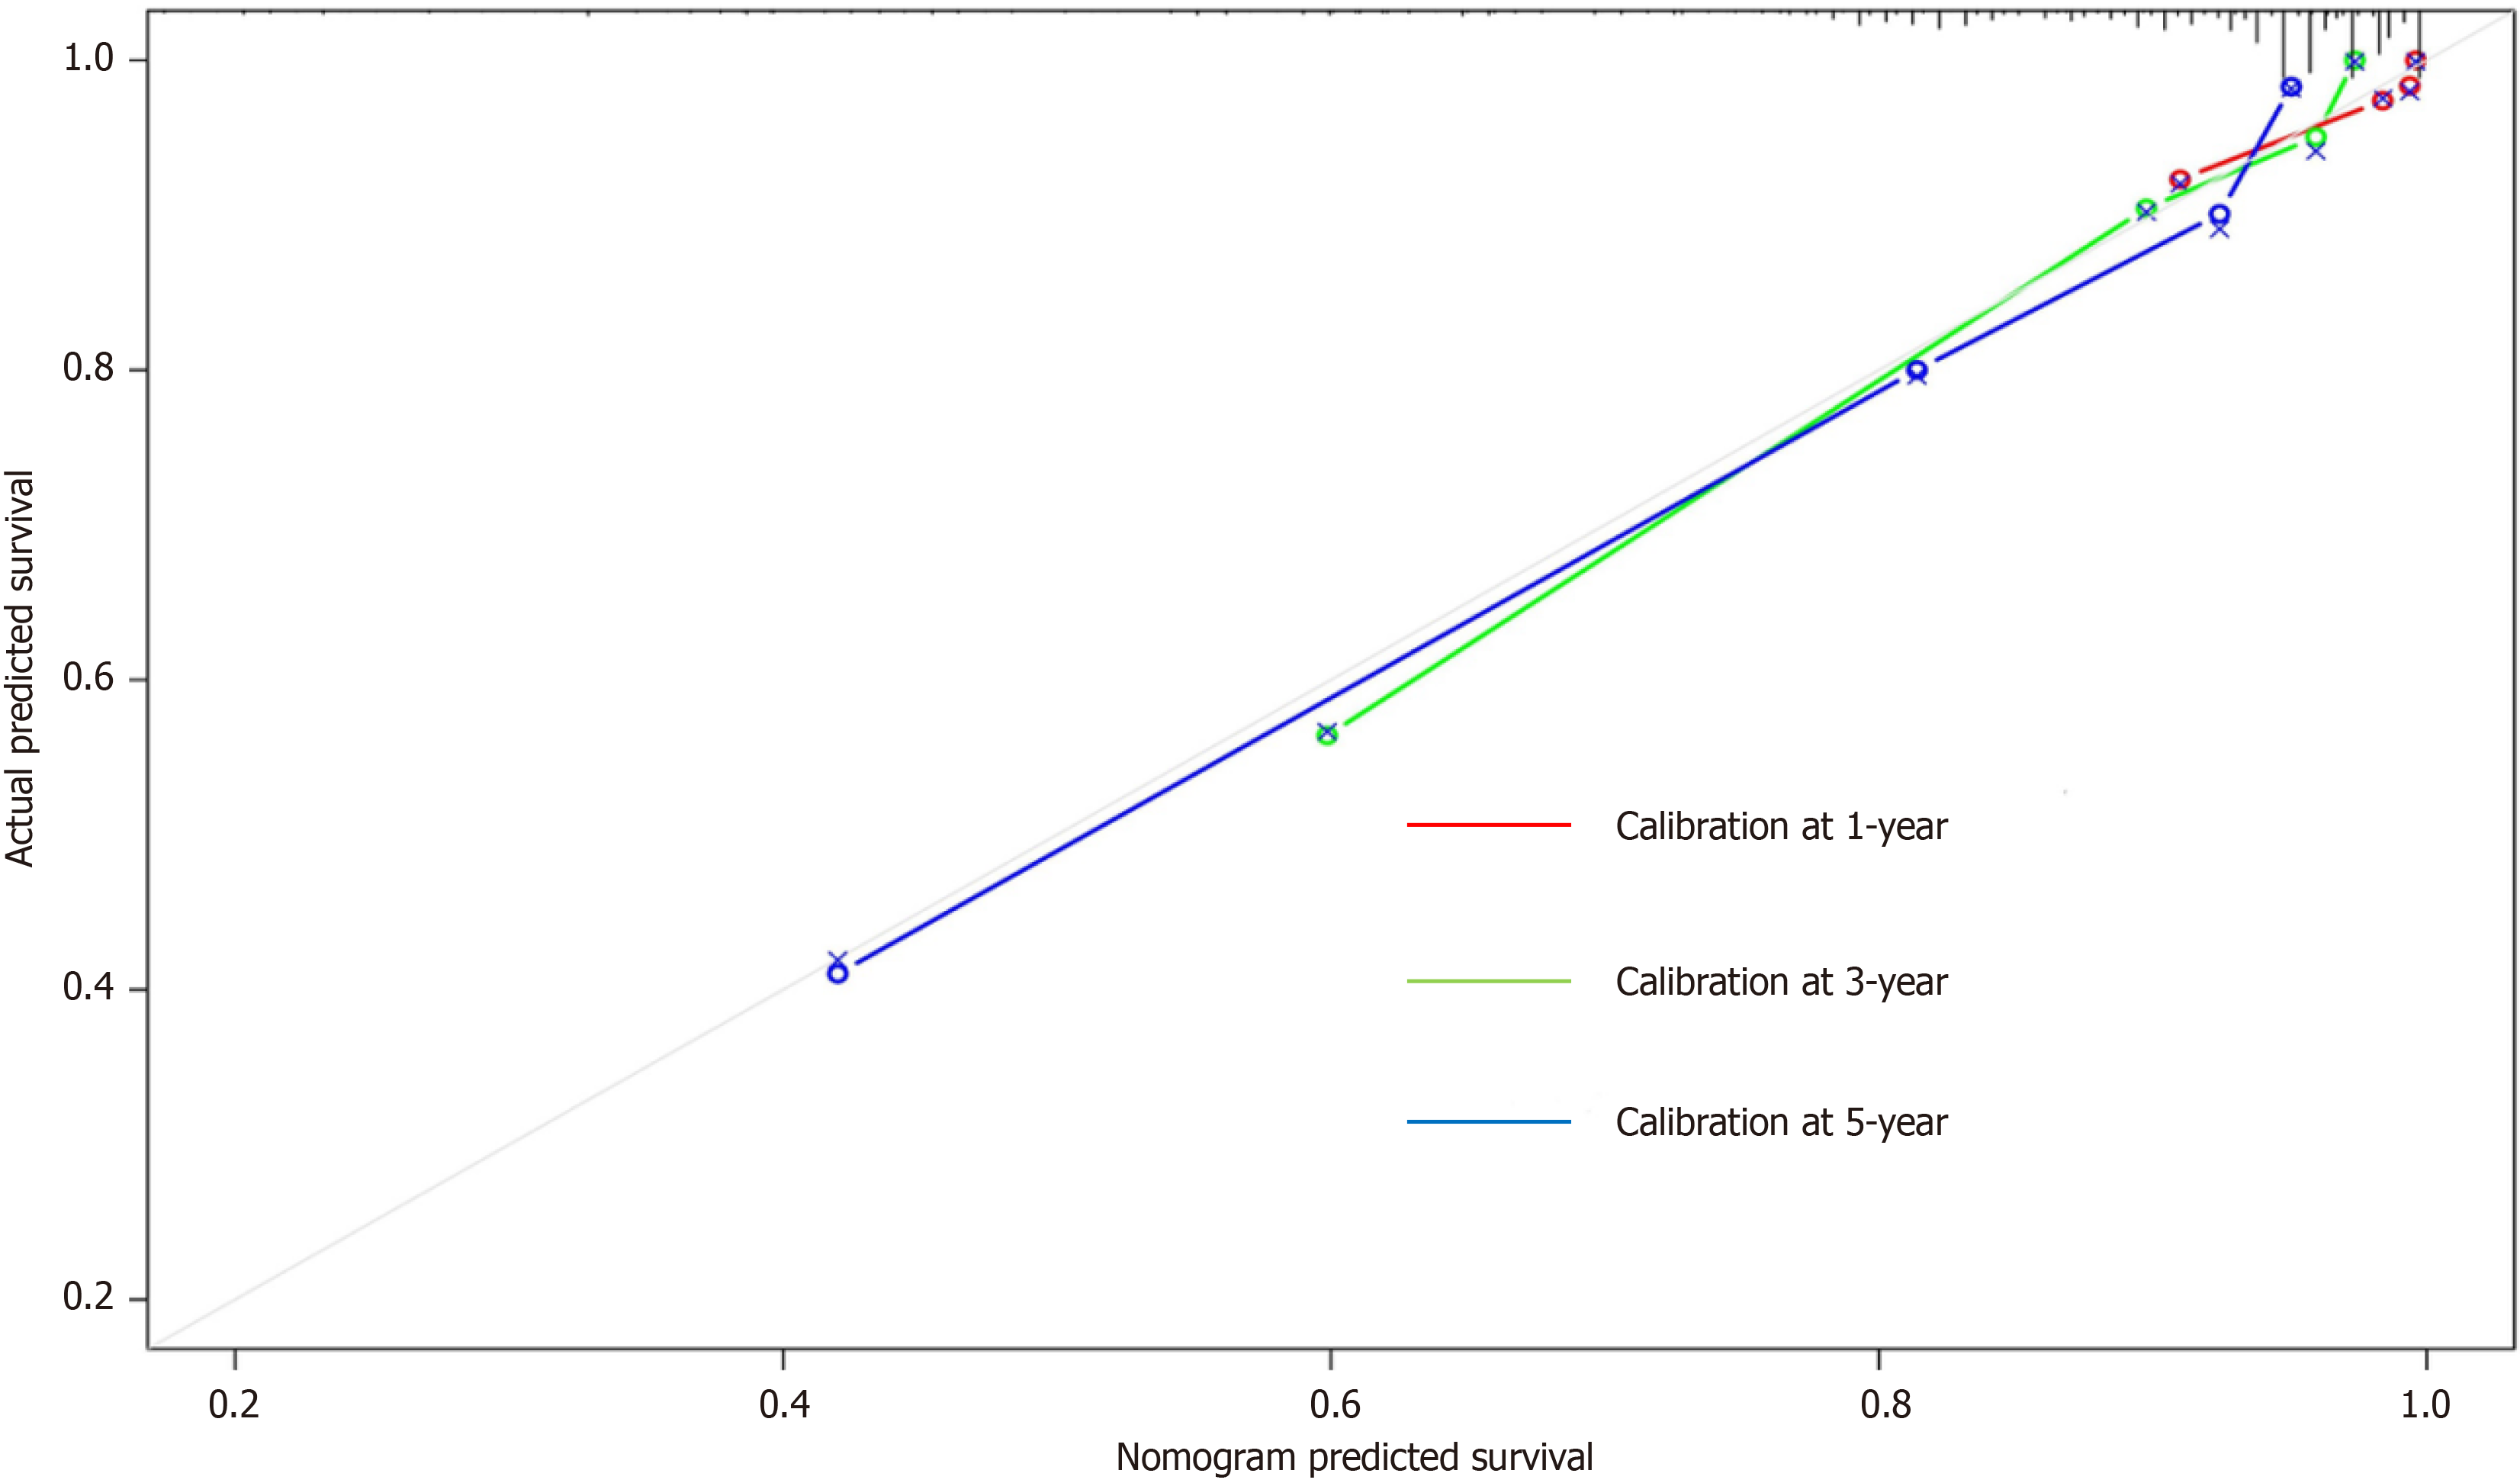
Figure 5
Calibration curves to predict 1-year, 3-year, and 5-year overall survival.
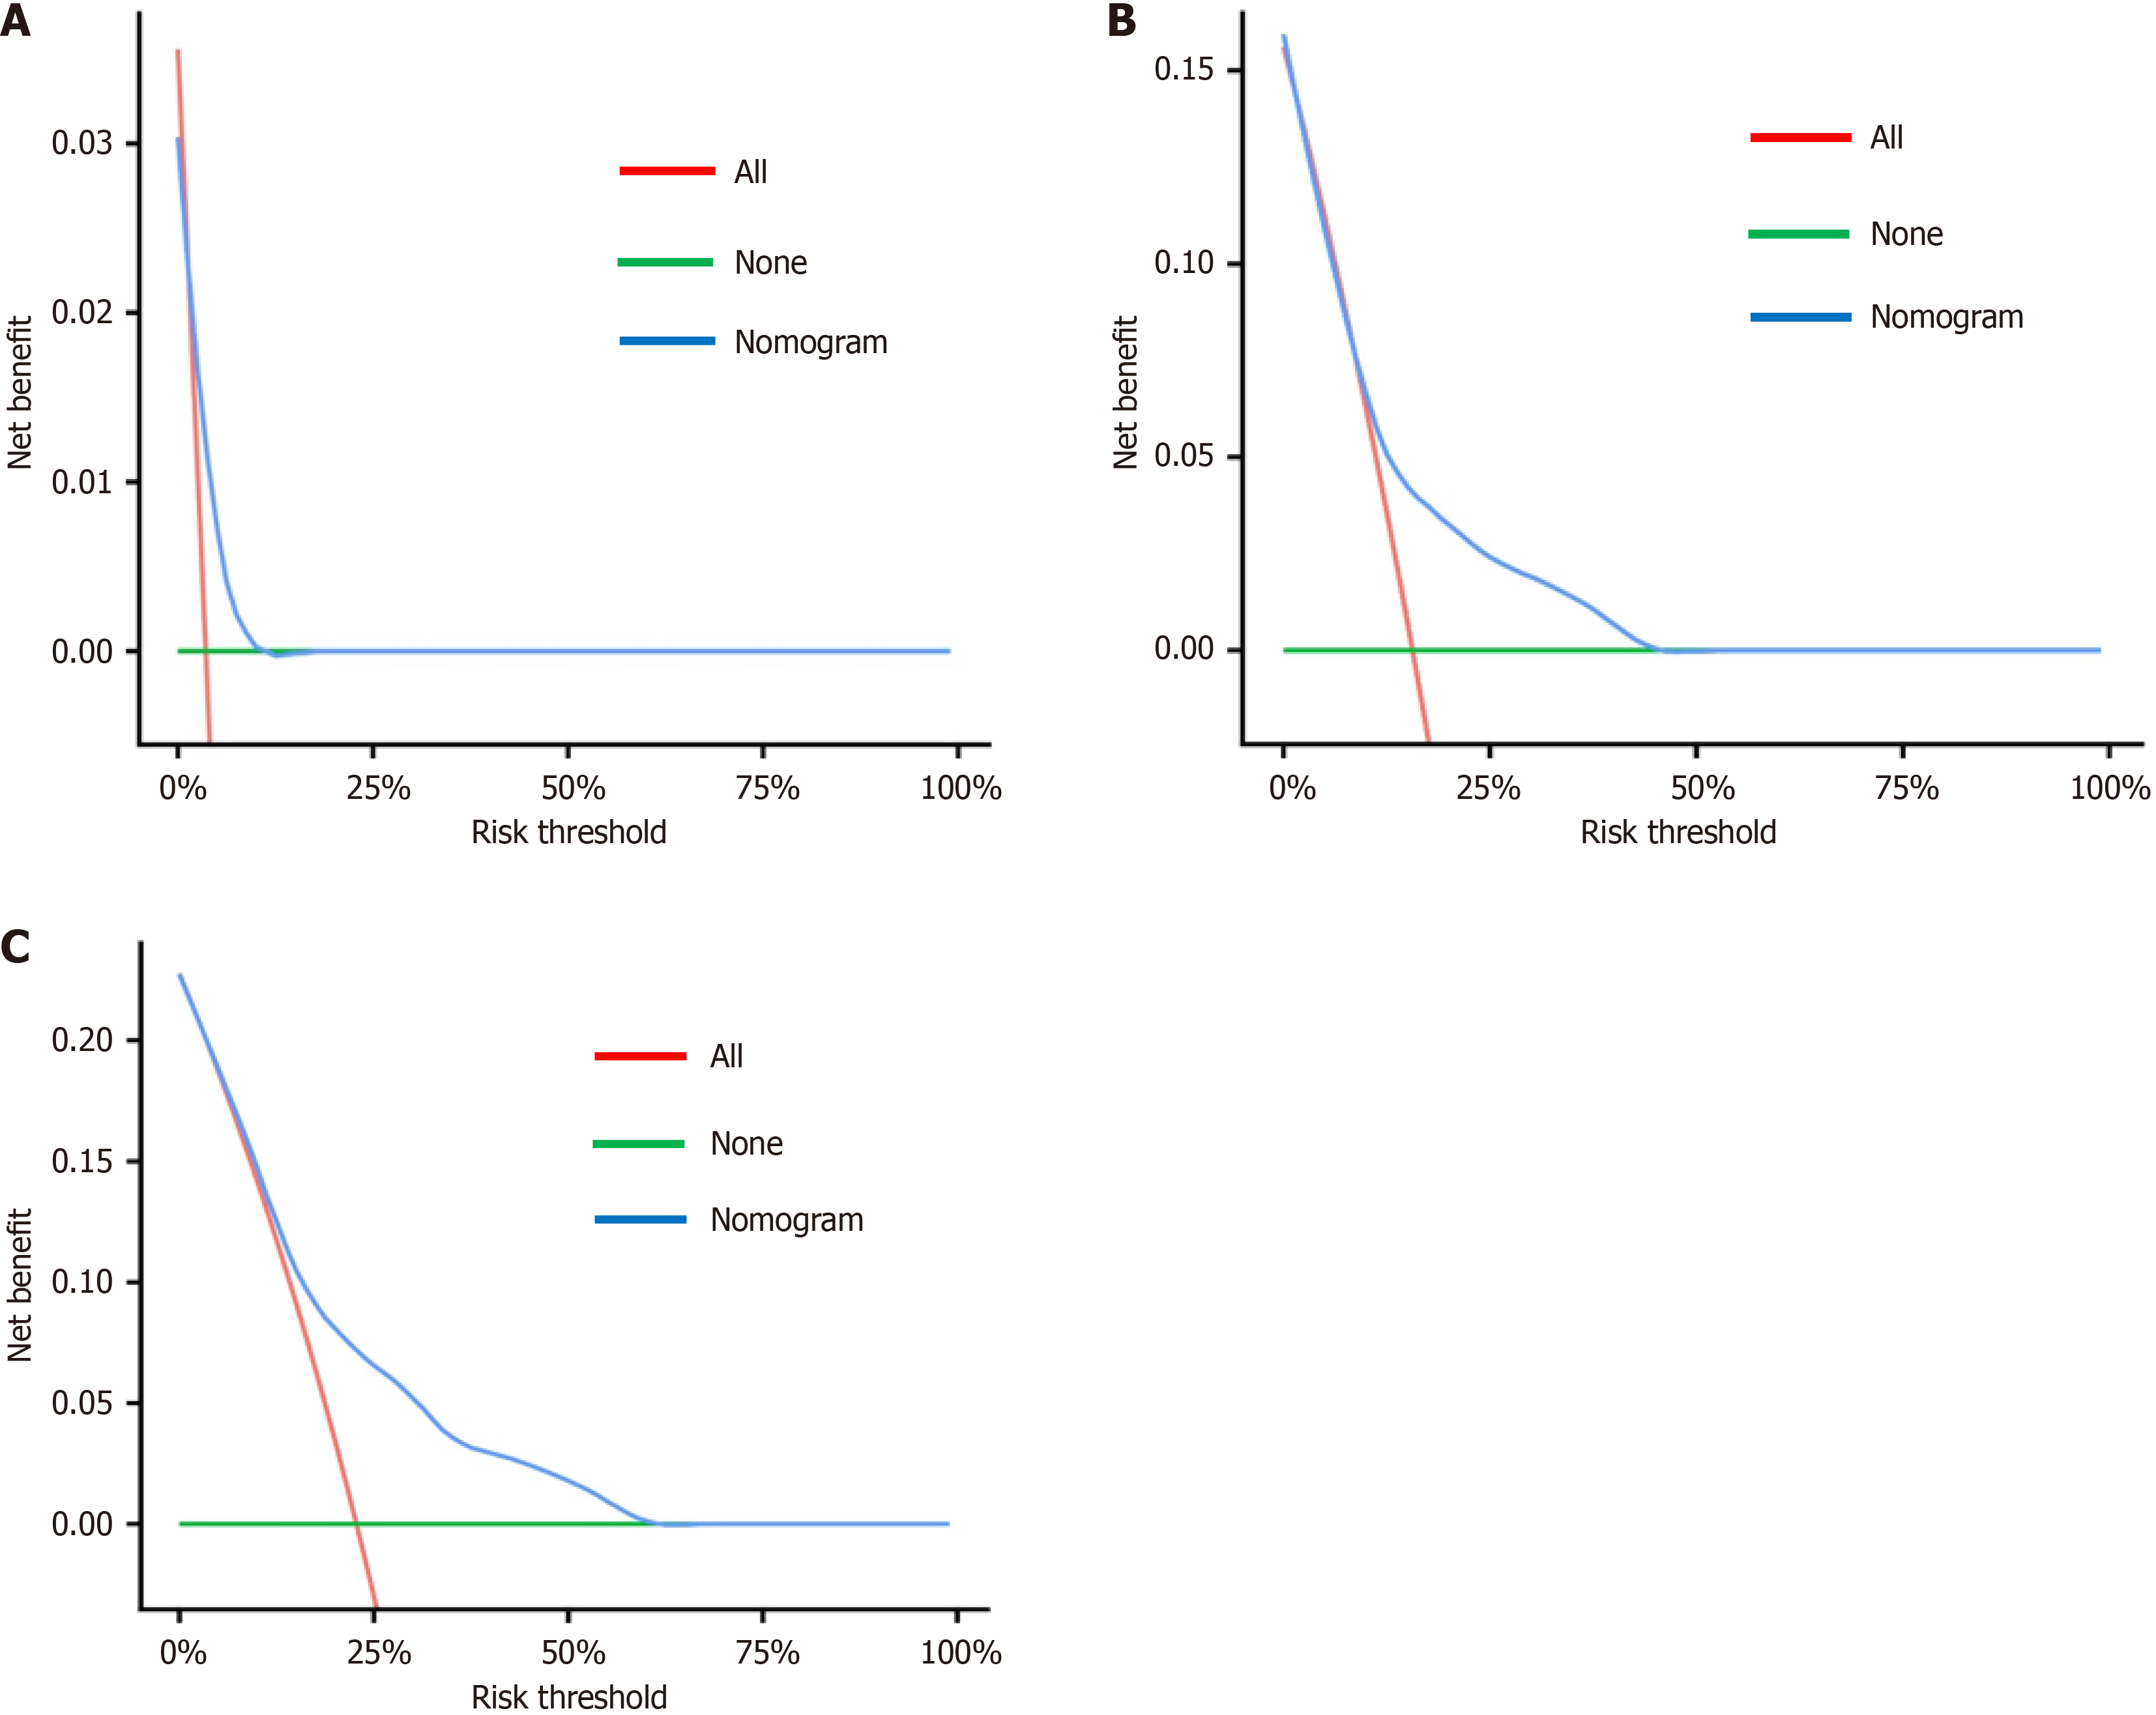
Figure 6 Decision curve analyses with clinical net benefits of the nomogram at 1 year, 3 years, and 5 years.
A: Decision curve analyses with clinical net benefits of the nomogram at 1 year; B: Decision curve analyses with clinical net benefits of the nomogram at 3 years; C: Decision curve analyses with clinical net benefits of the nomogram at 5 years.
- Citation: Shu Y, Li KJ, Sulayman S, Zhang ZY, Ababaike S, Wang K, Zeng XY, Chen Y, Zhao ZL. Predictive value of serum calcium ion level in patients with colorectal cancer: A retrospective cohort study. World J Gastrointest Surg 2025; 17(3): 102638
- URL: https://www.wjgnet.com/1948-9366/full/v17/i3/102638.htm
- DOI: https://dx.doi.org/10.4240/wjgs.v17.i3.102638


