Copyright
©The Author(s) 2025.
World J Gastrointest Surg. Mar 27, 2025; 17(3): 101609
Published online Mar 27, 2025. doi: 10.4240/wjgs.v17.i3.101609
Published online Mar 27, 2025. doi: 10.4240/wjgs.v17.i3.101609
Figure 1 Surgical indicators in both groups.
aP < 0.05.
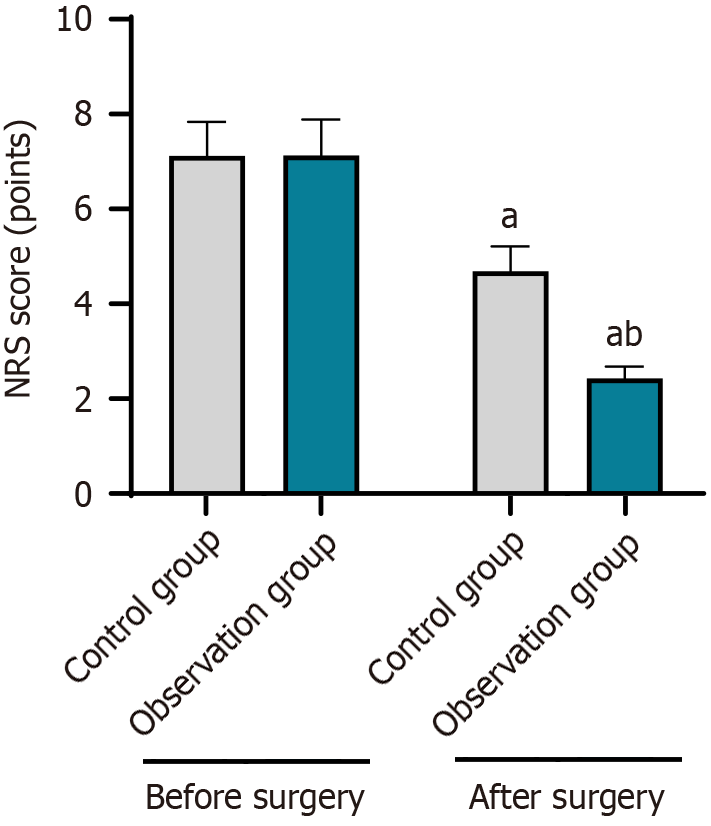
Figure 2 Degree of pain in both groups.
aP < 0.05 vs before surgery; bP < 0.05 vs control group. NRS: Numerical rating scale.
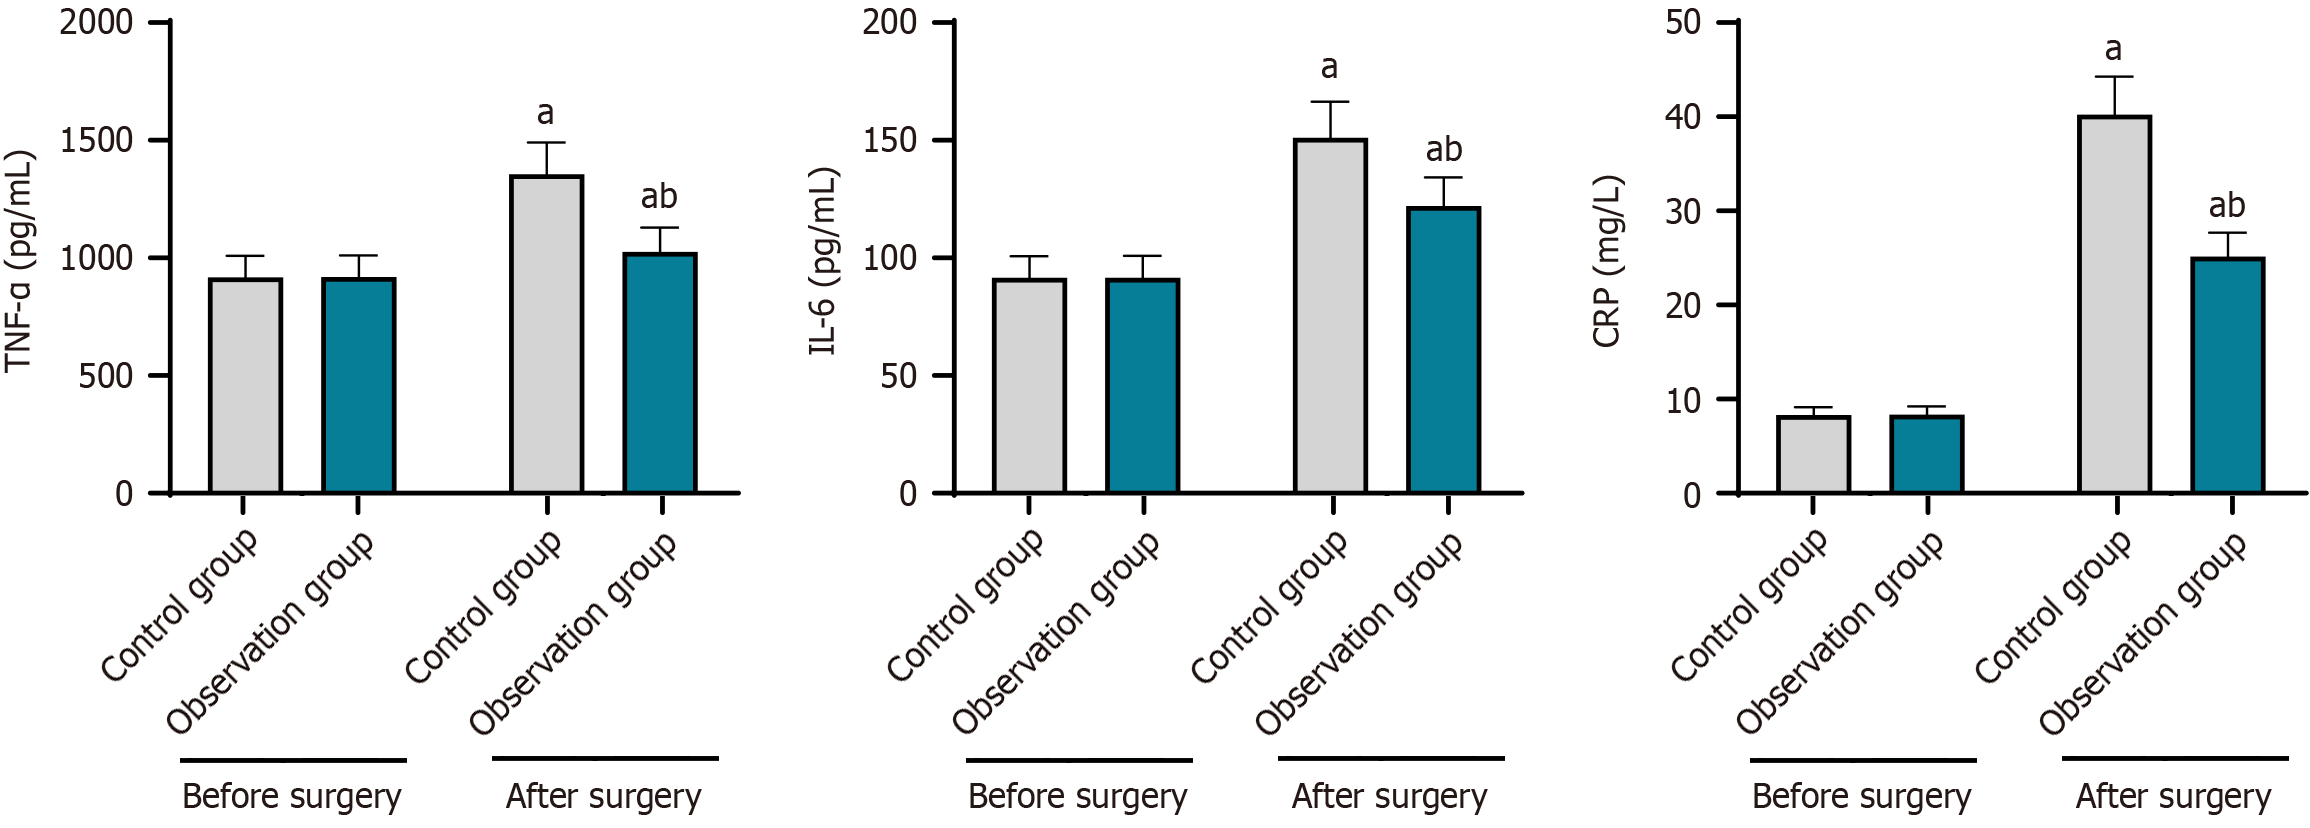
Figure 3 Inflammatory response in both groups.
aP < 0.05 vs before surgery; bP < 0.05 vs control group. TNF-α: Tumor necrosis factor-alpha; IL-6: Interleukin-6; CRP: C-reactive protein.
Figure 4 Quality of life in both groups.
aP < 0.05.
- Citation: Wu PH, Ta ZQ. Clinical effect and prognosis of laparoscopic surgery on colon cancer complicated with intestinal obstruction patients. World J Gastrointest Surg 2025; 17(3): 101609
- URL: https://www.wjgnet.com/1948-9366/full/v17/i3/101609.htm
- DOI: https://dx.doi.org/10.4240/wjgs.v17.i3.101609


