Copyright
©The Author(s) 2025.
World J Gastrointest Surg. Oct 27, 2025; 17(10): 111454
Published online Oct 27, 2025. doi: 10.4240/wjgs.v17.i10.111454
Published online Oct 27, 2025. doi: 10.4240/wjgs.v17.i10.111454
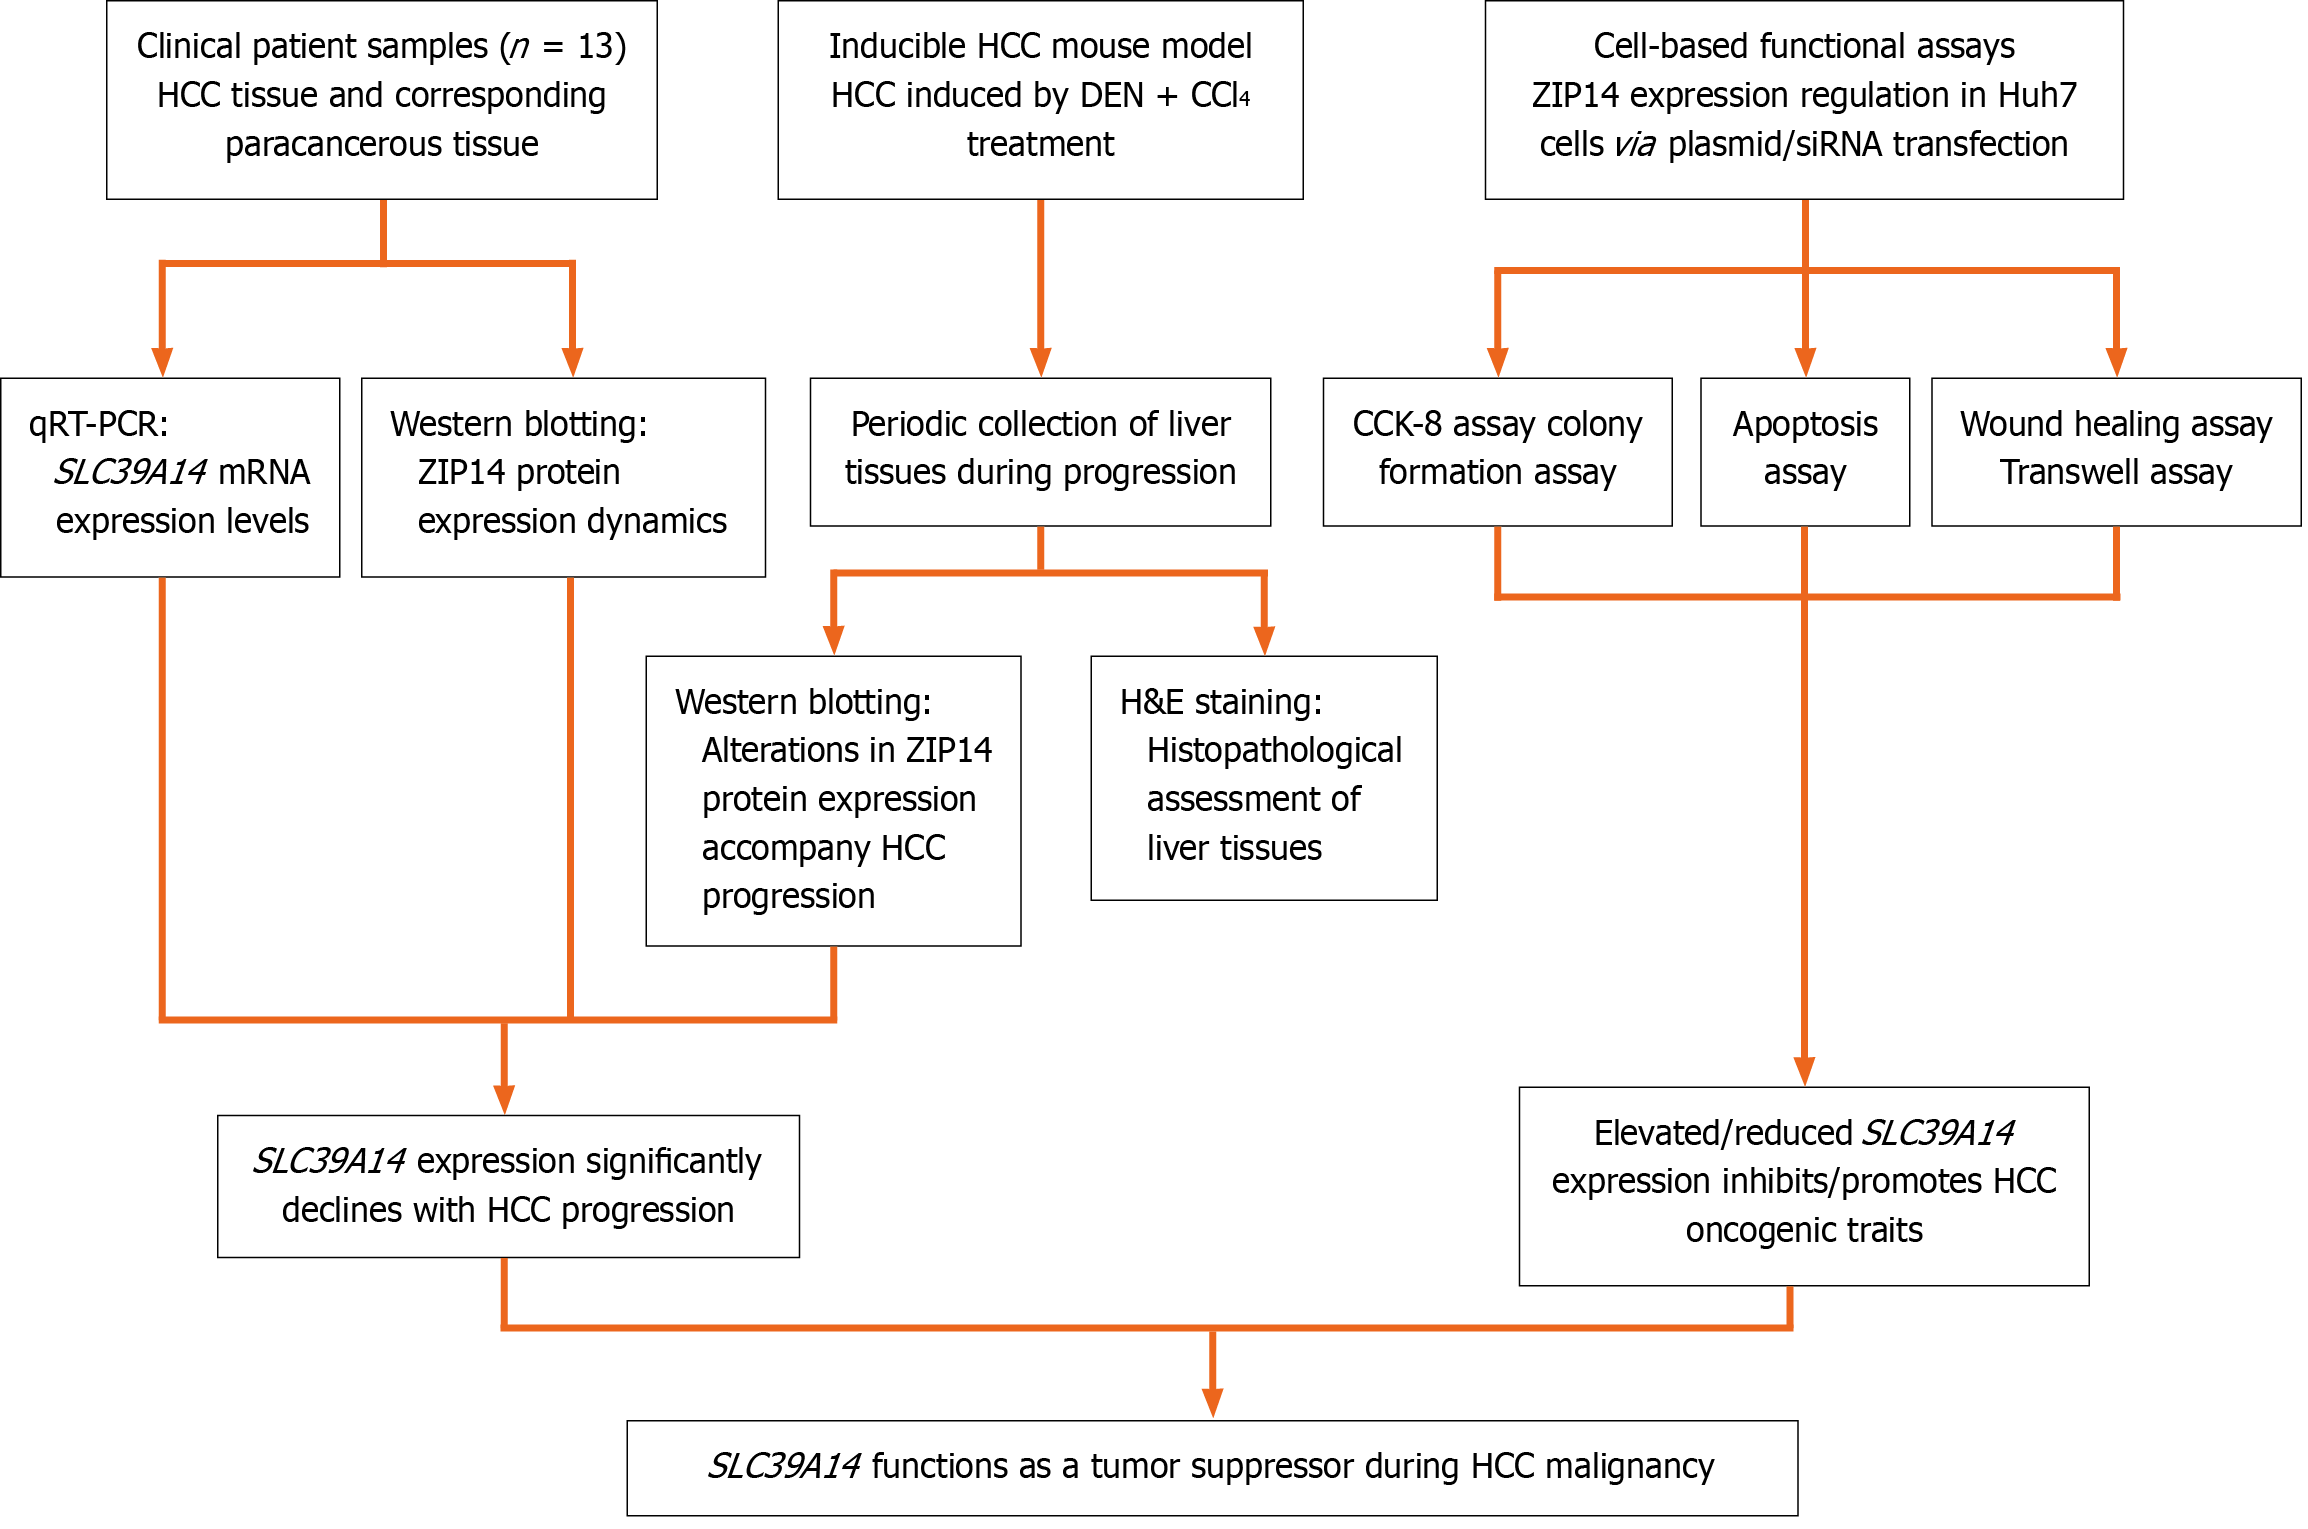
Figure 1 Schematic representation of the study protocol.
HCC: Hepatocellular carcinoma; DEN: Diethylnitrosamine; CCl4: Carbon tetrachloride; qRT-PCR: Quantitative reverse transcriptase PCR; CCK-8: Cell counting kit-8; H&E: Hematoxylin and eosin.
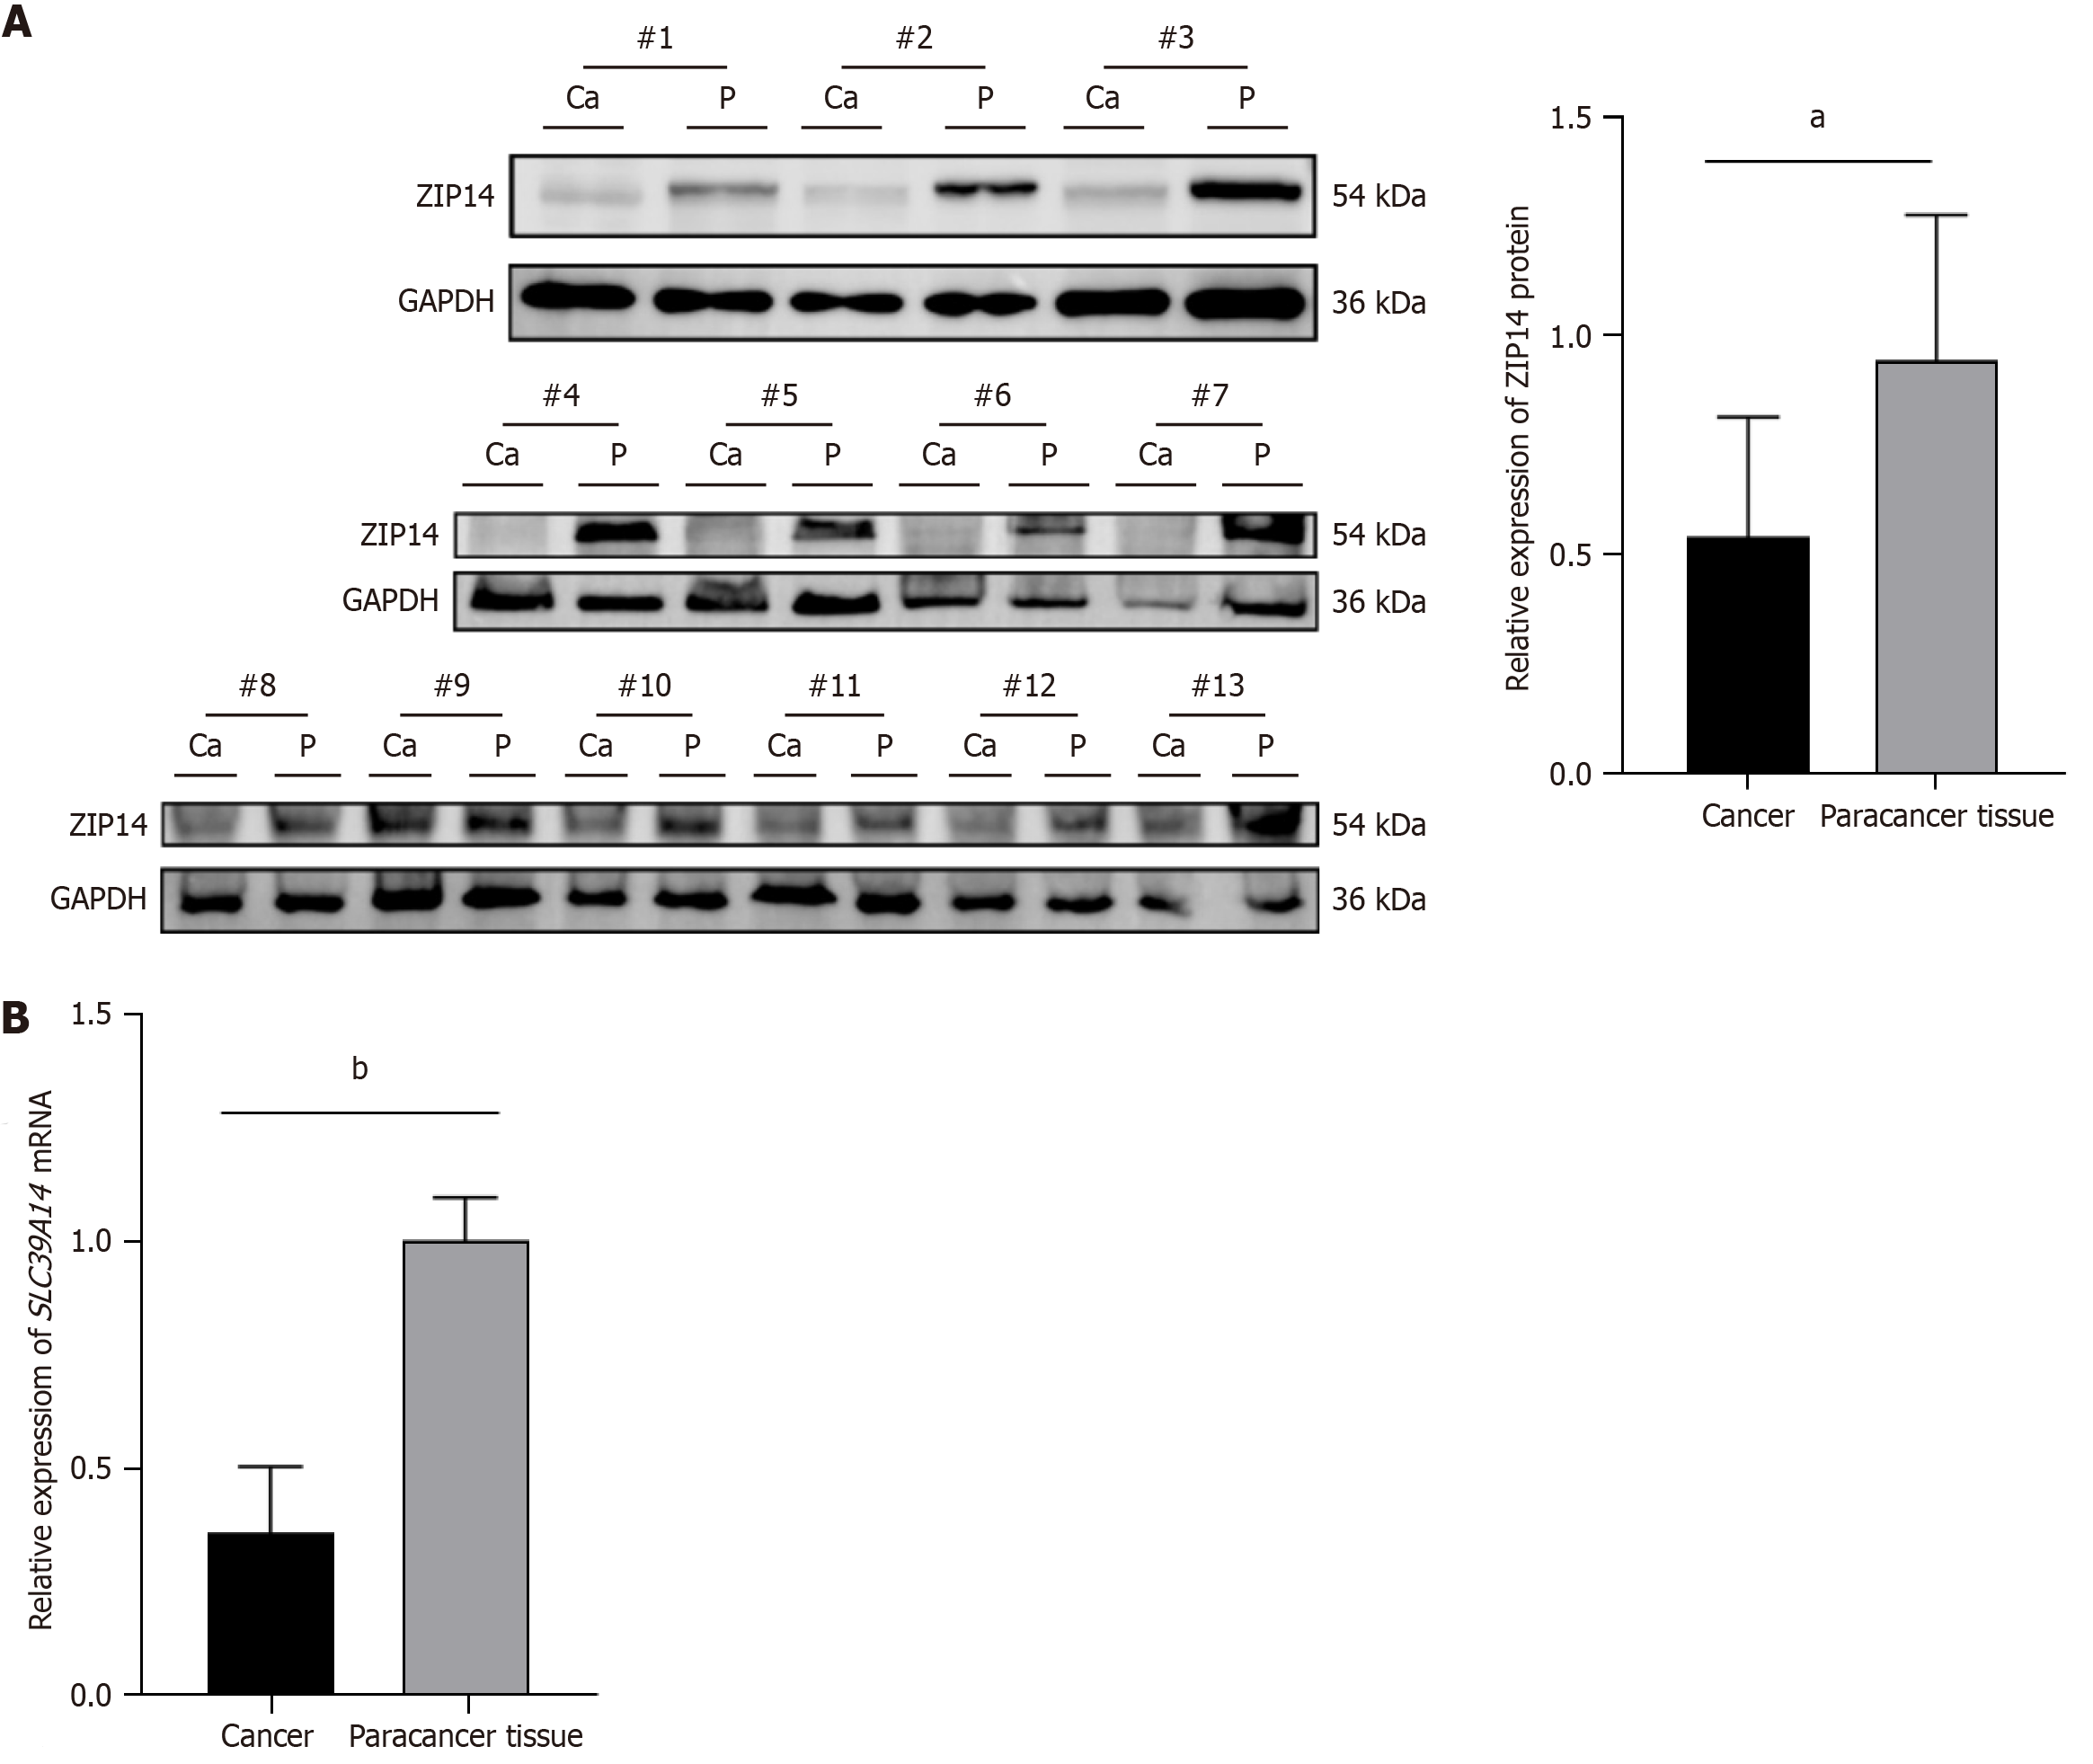
Figure 2 SLC39A14 expression in clinical hepatocellular carcinoma samples.
A: Differences in SLC39A14 expression between cancer tissues and paracancerous tissues from hepatocellular carcinoma (HCC) patients were detected by western blotting (n = 13); B: Differences in SLC39A14 mRNA expression in the cancerous and paracancerous tissues of HCC patients were detected by quantitative reverse transcriptase PCR (n = 3). aP < 0.01. bP < 0.0001.
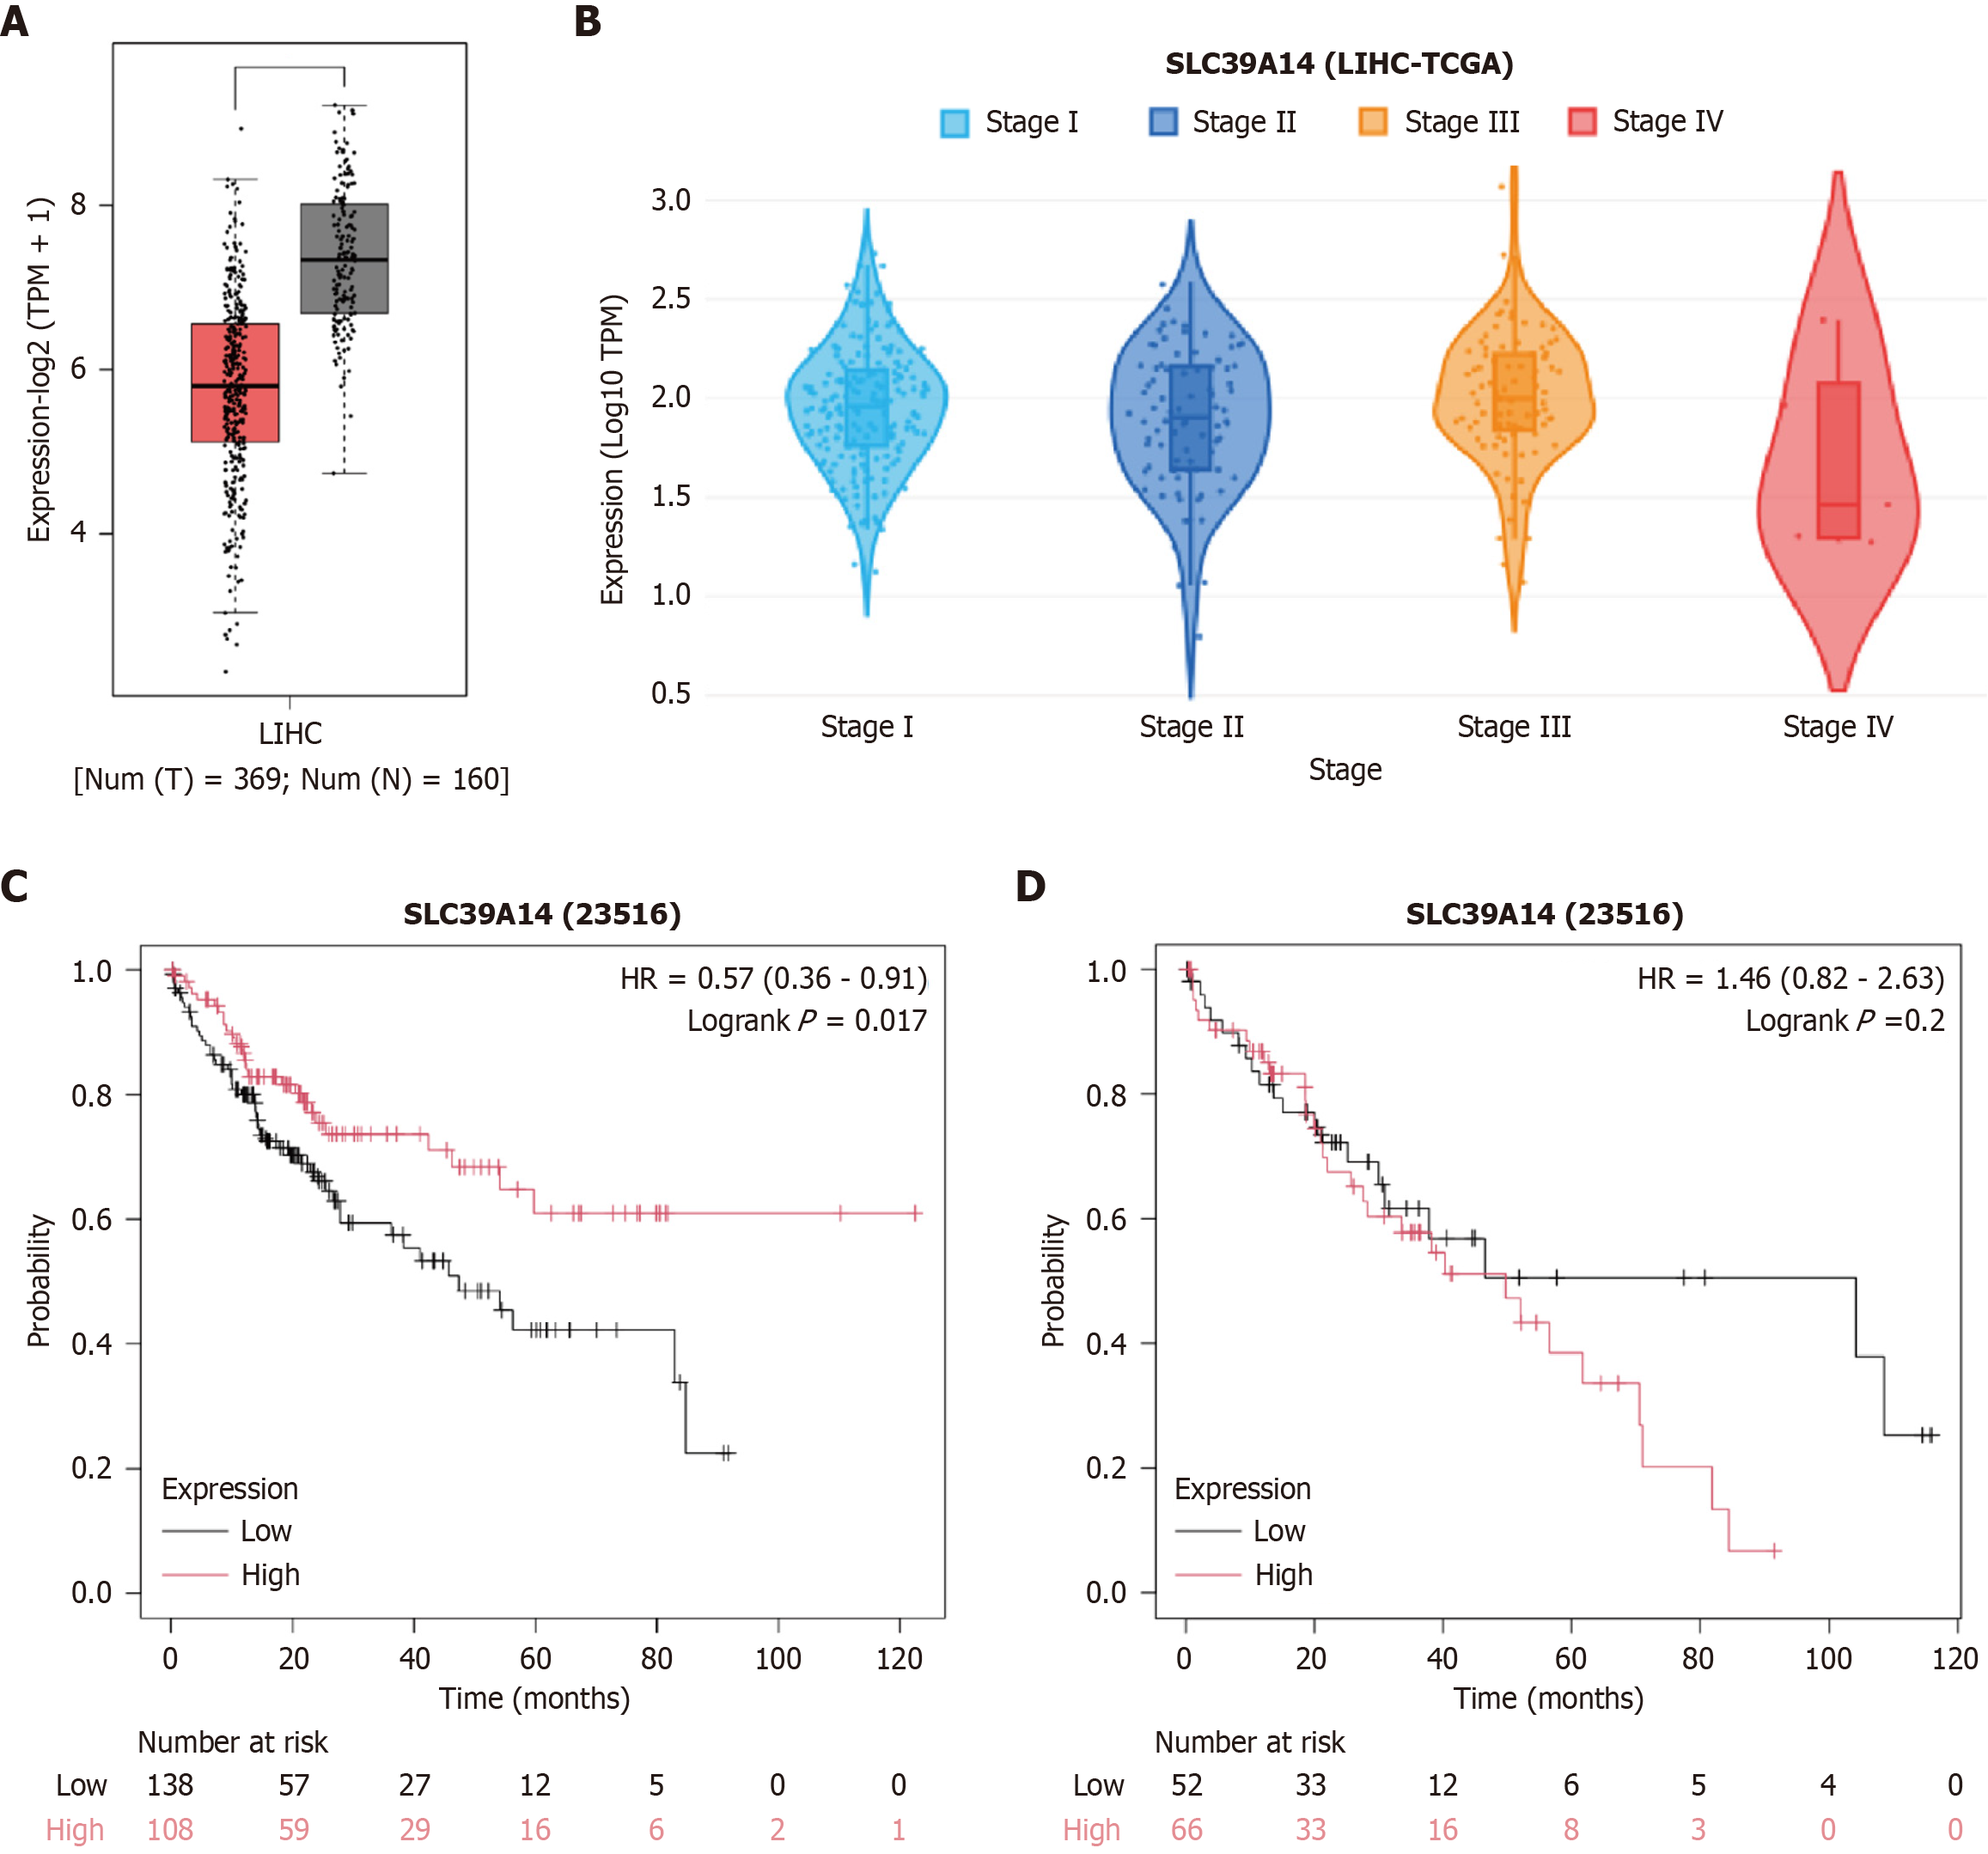
Figure 3 SLC39A14 expression and survival analysis in The Cancer Genome Atlas cohorting.
A: SLC39A14 expression in cancer patients (T) and normal individuals (N) (P < 0.05); B: Changes in SLC39A14 expression across cancer stages; C: Overall survival in male patients with high and low SLC39A14 expression (P = 0.017); D: Overall survival in female patients with high and low SLC39A14 expression (P = 0.2).
Figure 4 In vivo experimental workflow.
Diethylnitrosamine and carbon tetrachloride-induced hepatocellular carcinoma in C57BL/6J mice. DEN: Diethylnitrosamine; CCl4: Carbon tetrachloride.
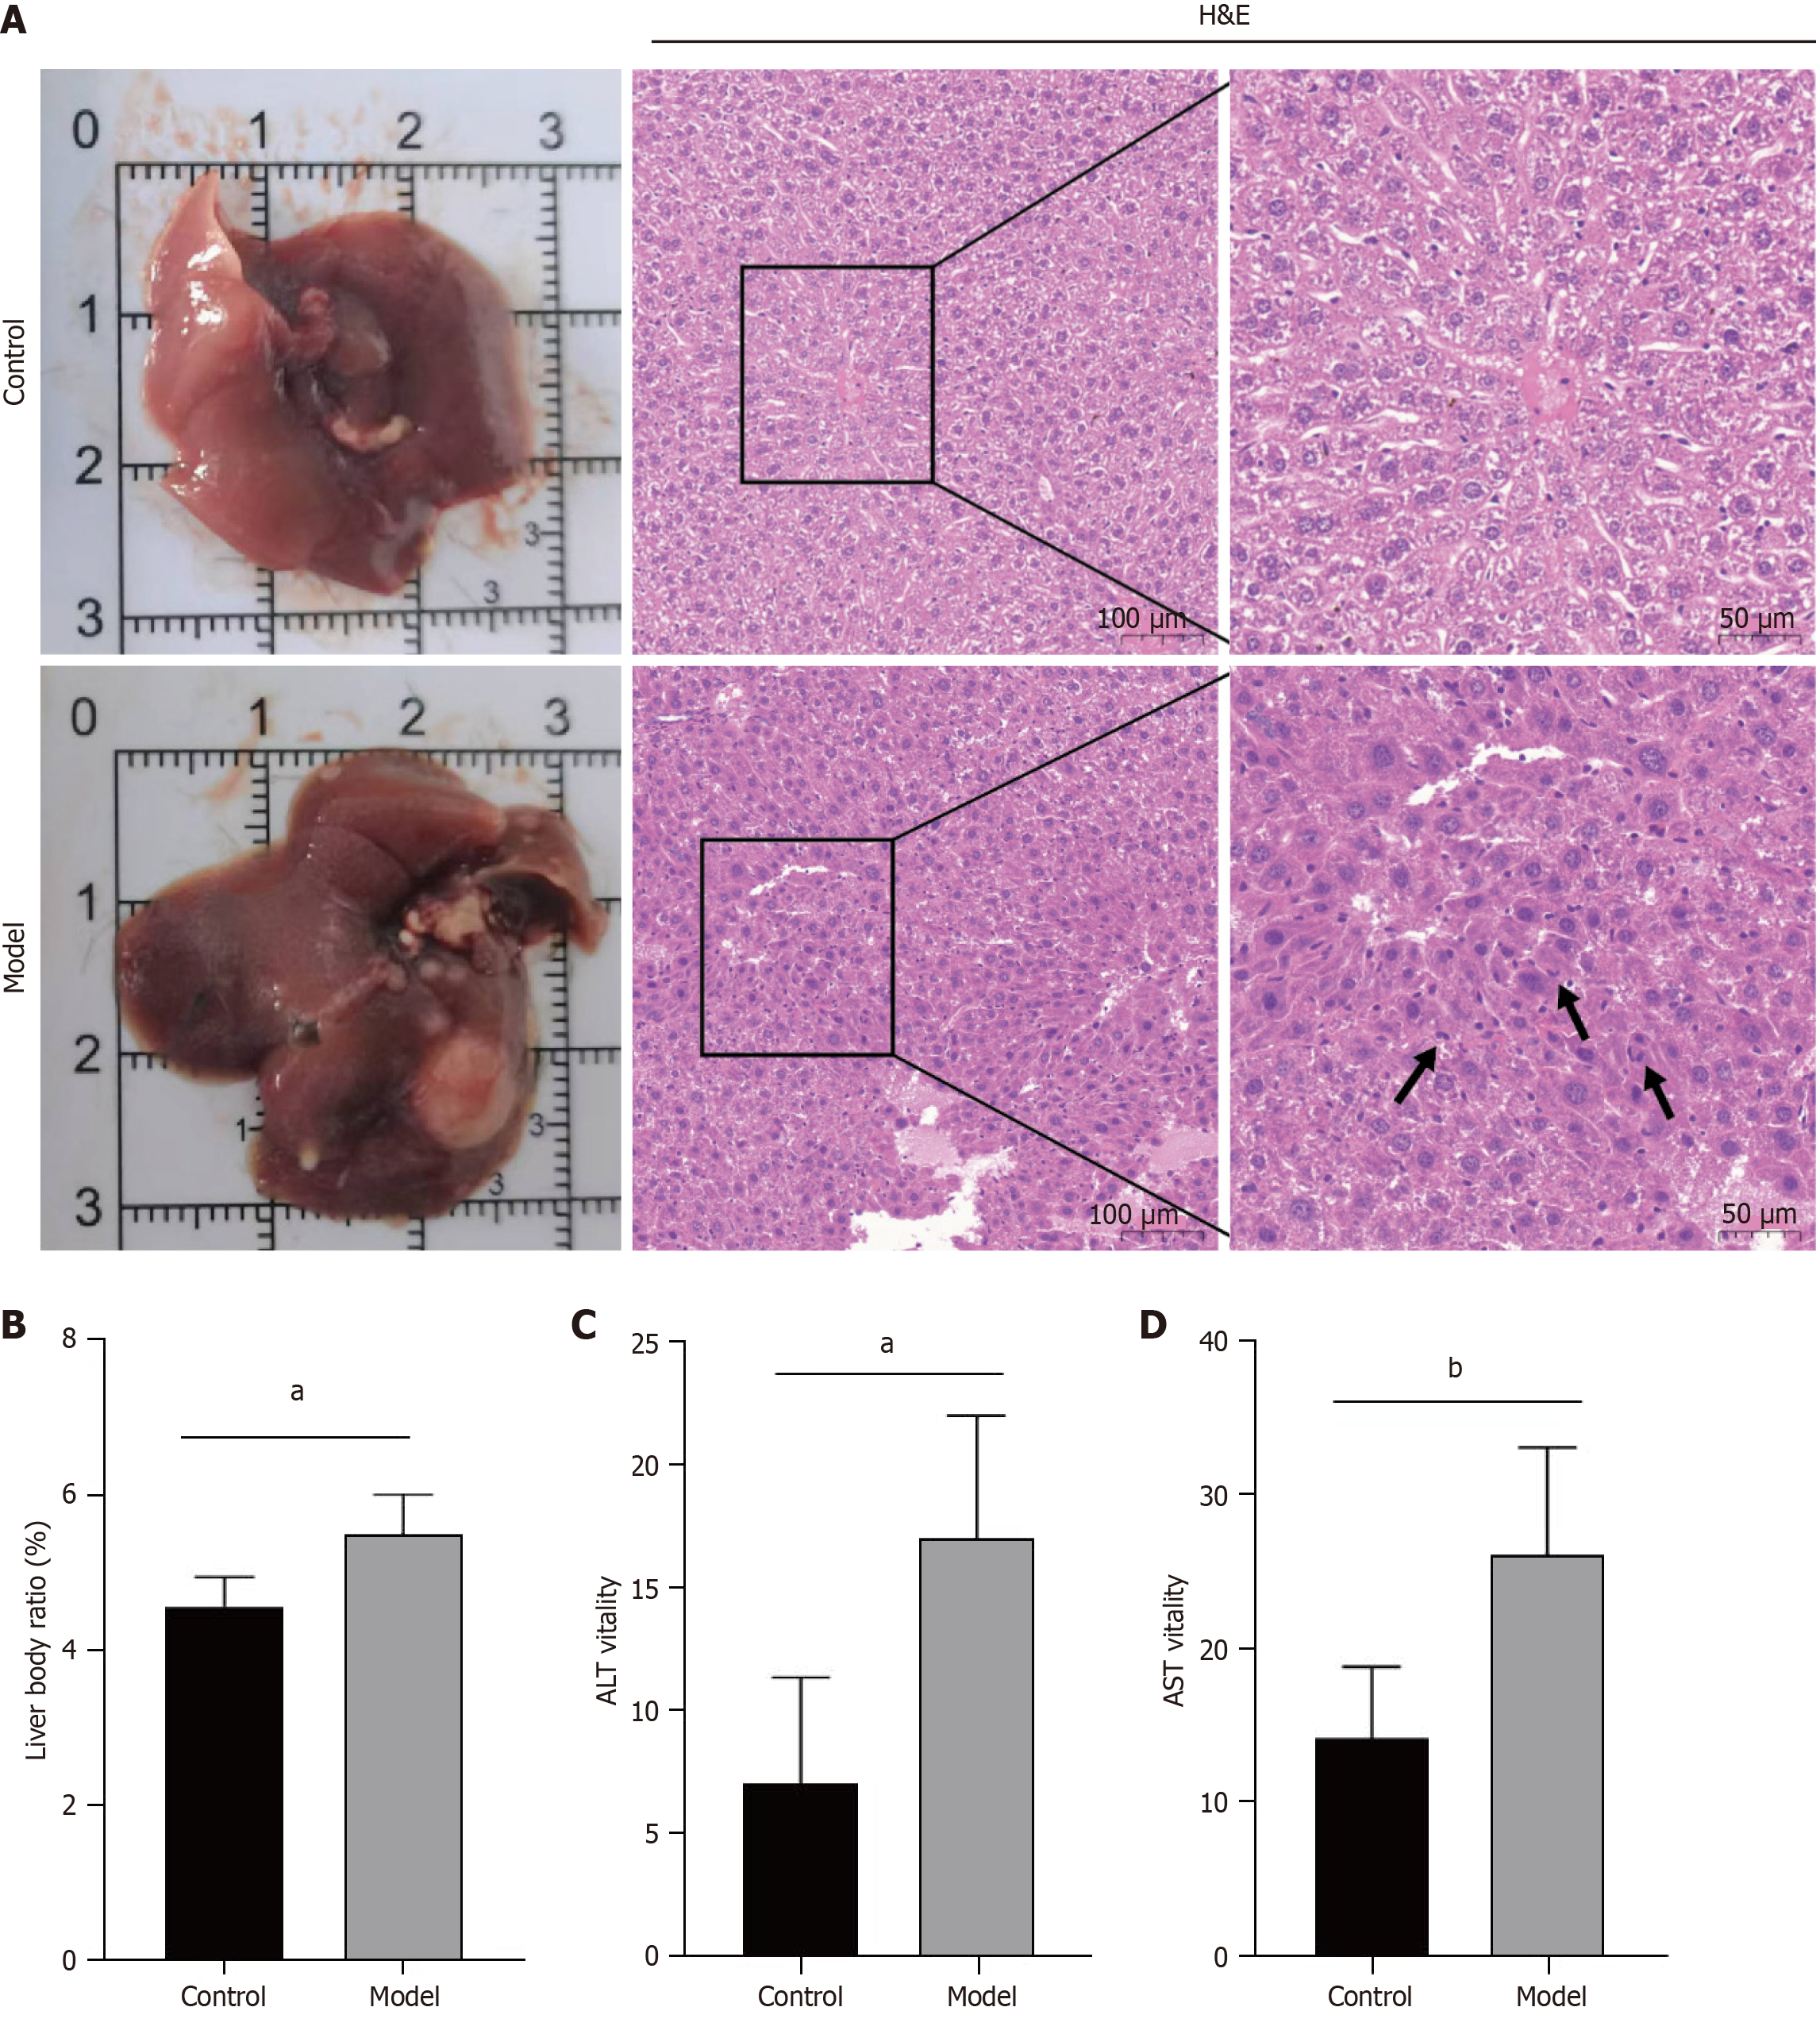
Figure 5 Evaluation of hepatocellular carcinoma model induction efficacy.
A: Appearance and hemotoxylin and eosin staining of liver lobules in the control and model groups. Abnormal mitosis of hepatocellular carcinoma cells is indicated by black arrows; magnification, 200 ×; B: Liver body ratios for the control and model mice; C: Alanine aminotransferase for the control and model mice; D: Aspartate aminotransferase for the control and model mice. H&E: Hemotoxylin and eosin; ALT: Alanine aminotransferase; AST: Aspartate aminotransferase. aP < 0.001, bP < 0.01.
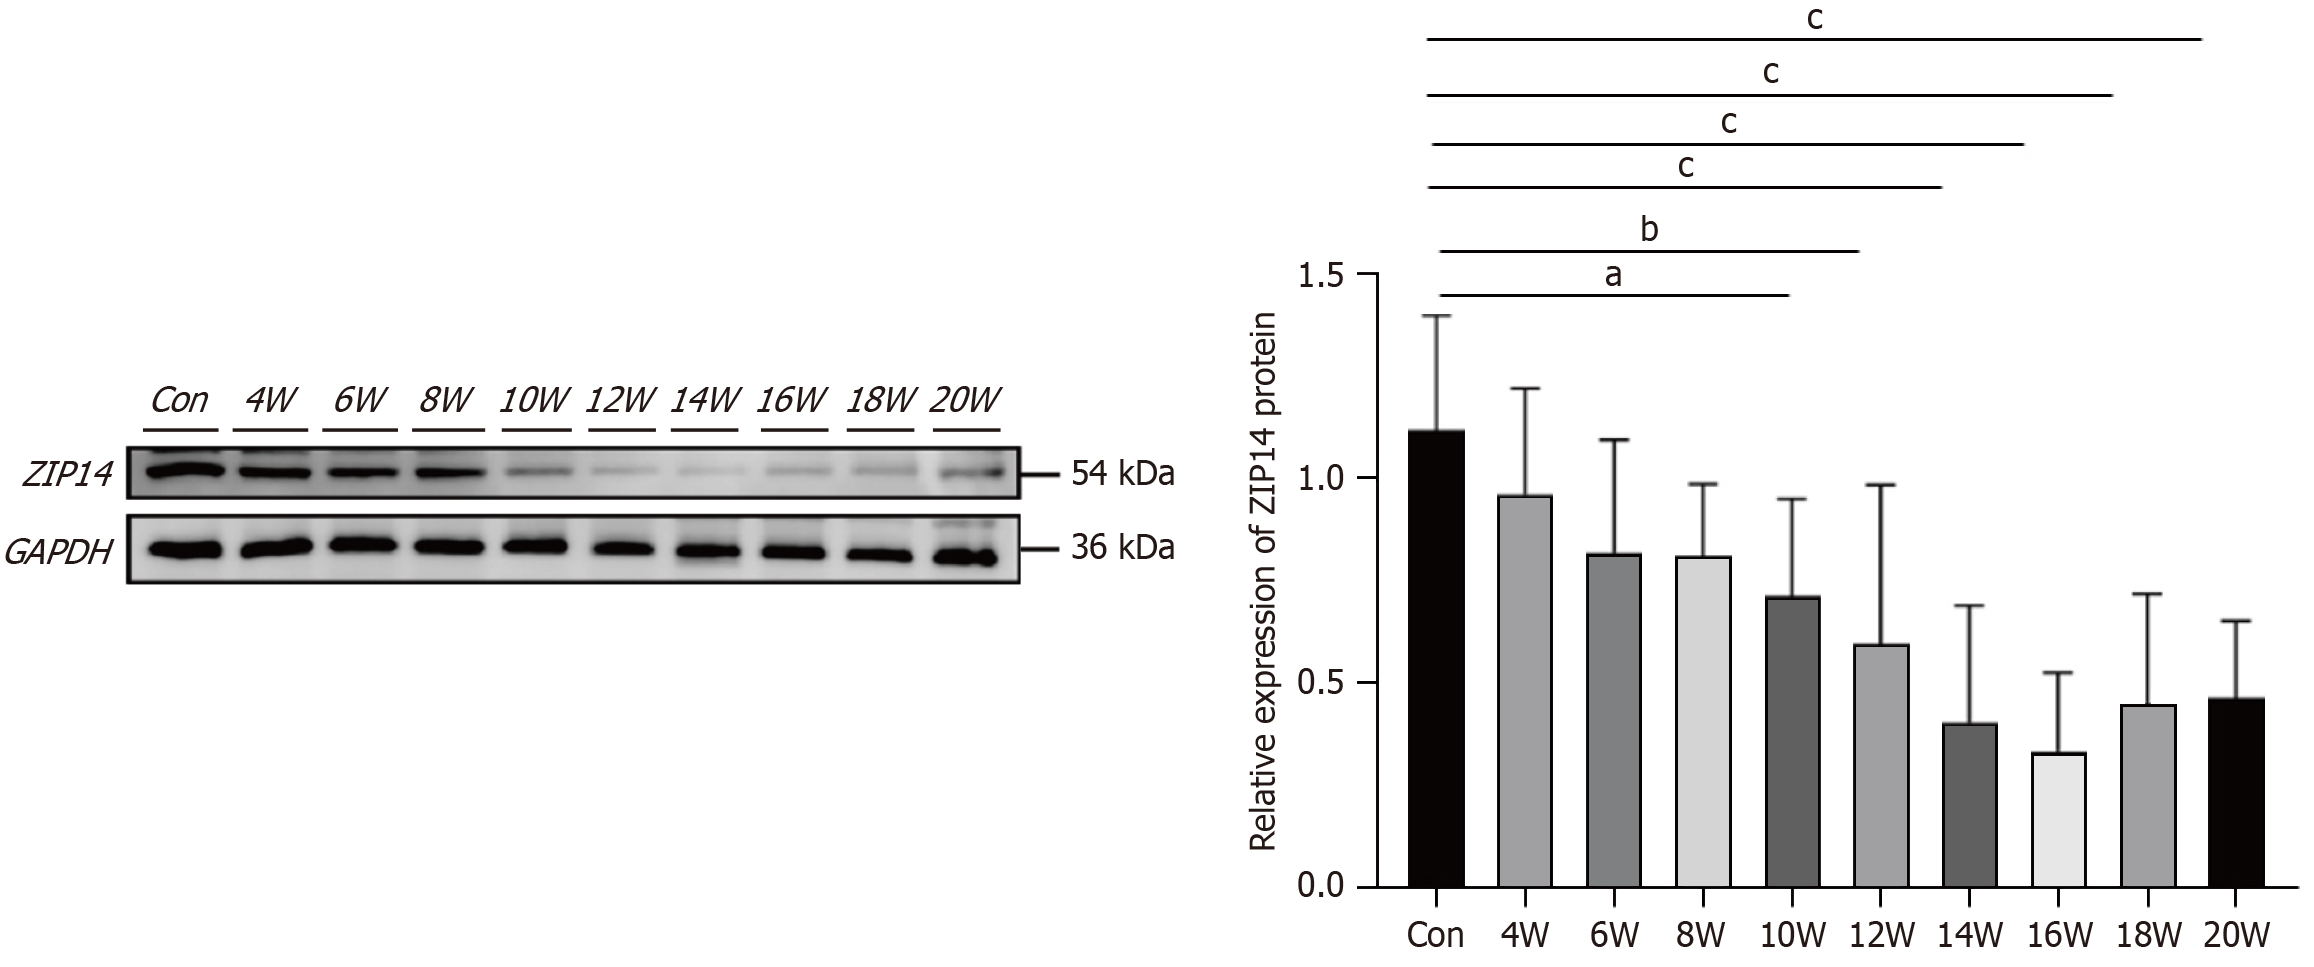
Figure 6 Changes in SLC39A14 expression during hepatocellular carcinoma progression.
A batch of mice was collected every 2 weeks during the induction process, and western blotting was performed to detect the changes in ZIP14 protein expression during the development of hepatocellular carcinoma (n = 8). aP < 0.05, bP < 0.01, cP < 0.0001.
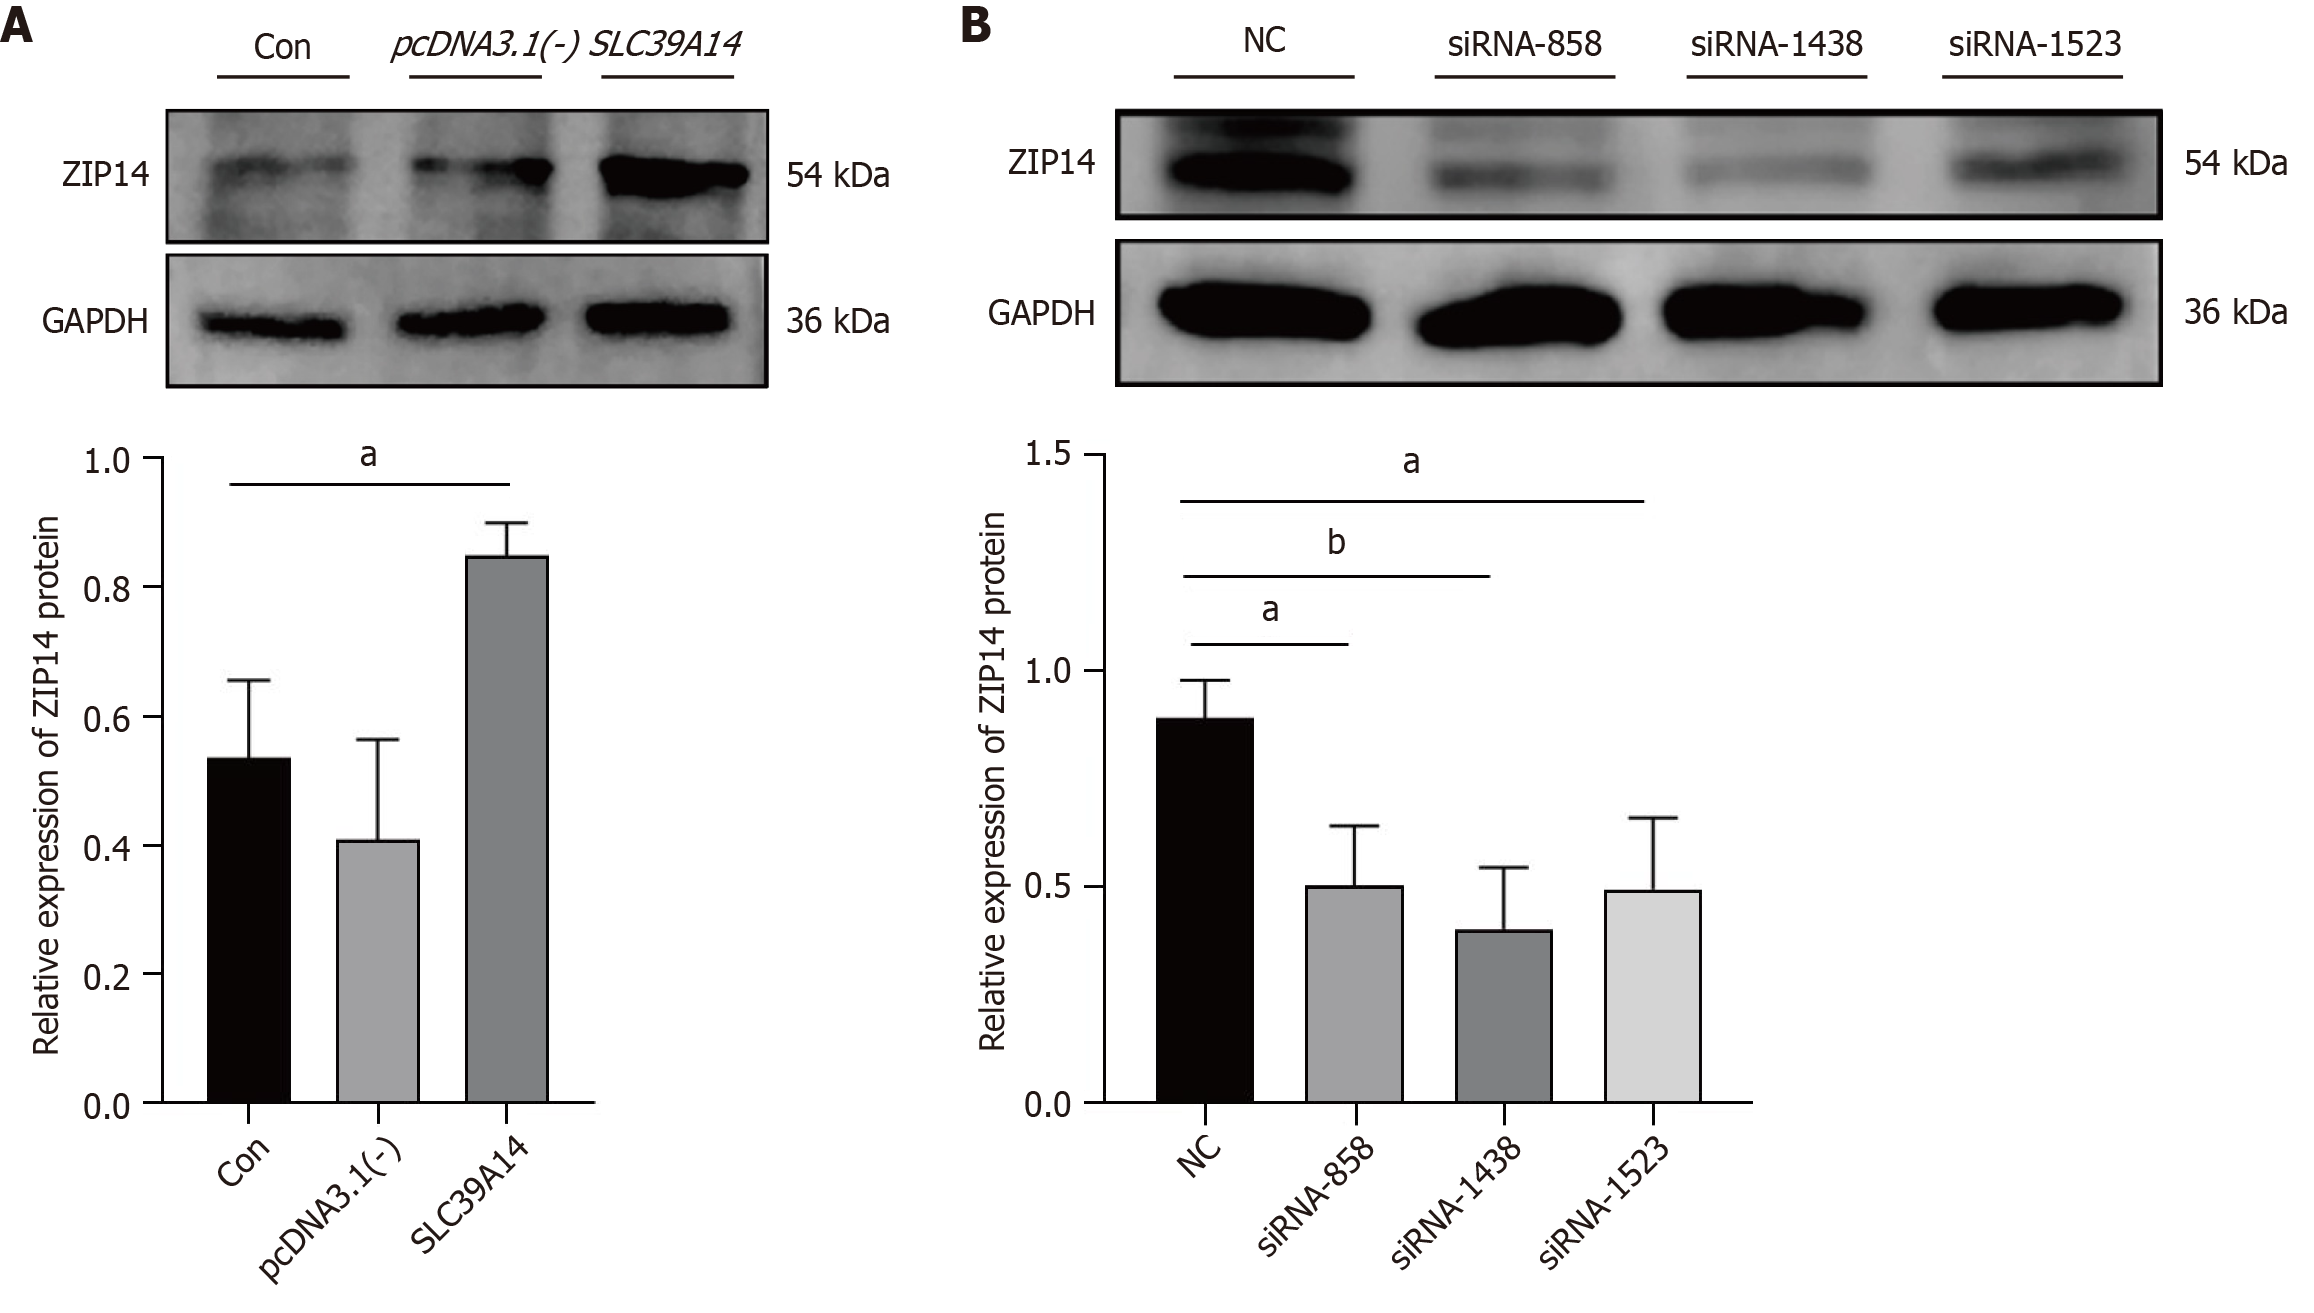
Figure 7 Checking transfection efficiency in Huh7 cells.
A: ZIP14 expression after overexpression plasmid transfection; B: ZIP14 expression after siRNA transfection. aP < 0.05, bP <0.01.
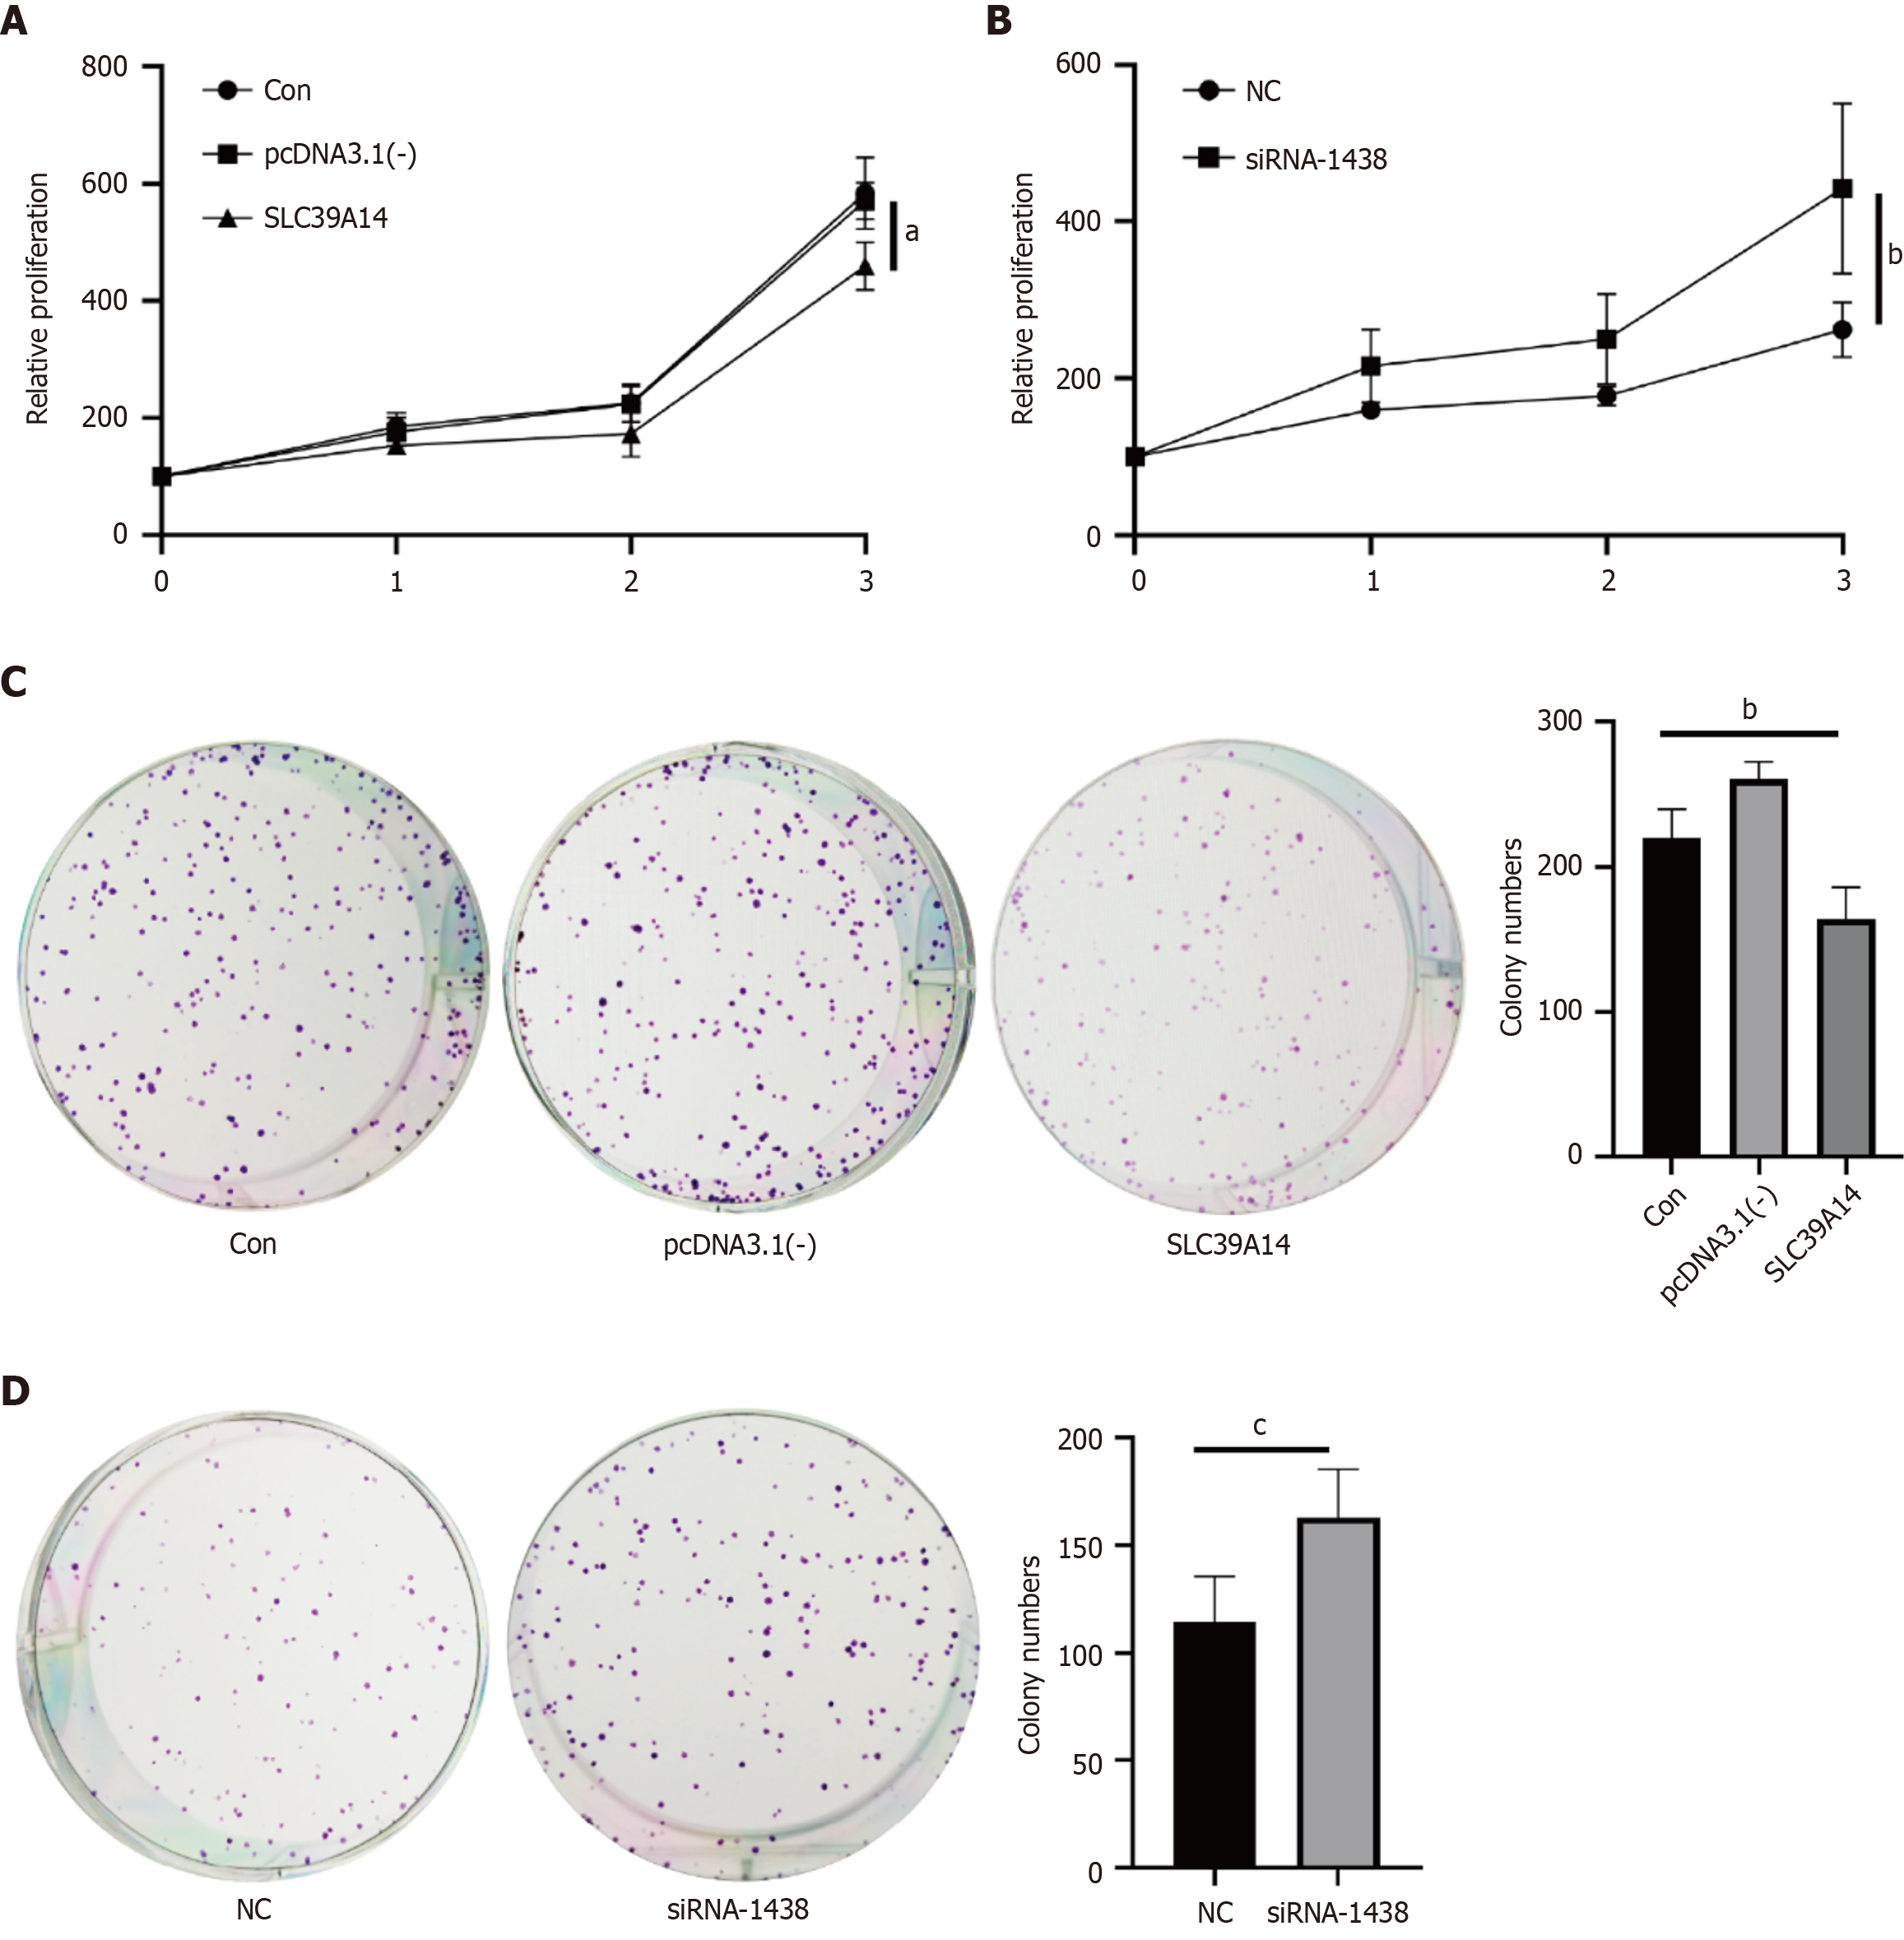
Figure 8 SLC39A14 in cell proliferation.
A: Cell counting kit-8 (CCK-8) assay in Huh7 cells after SLC39A14 overexpression; B: CCK-8 assay in Huh7 cells after SLC39A14 knockdown; C: Colony formation experiment in Huh7 cells after SLC39A14 overexpression; D: Colony formation experiment in Huh7 cells after SLC39A14 knockdown. aP < 0.05, bP < 0.01, cP < 0.001.
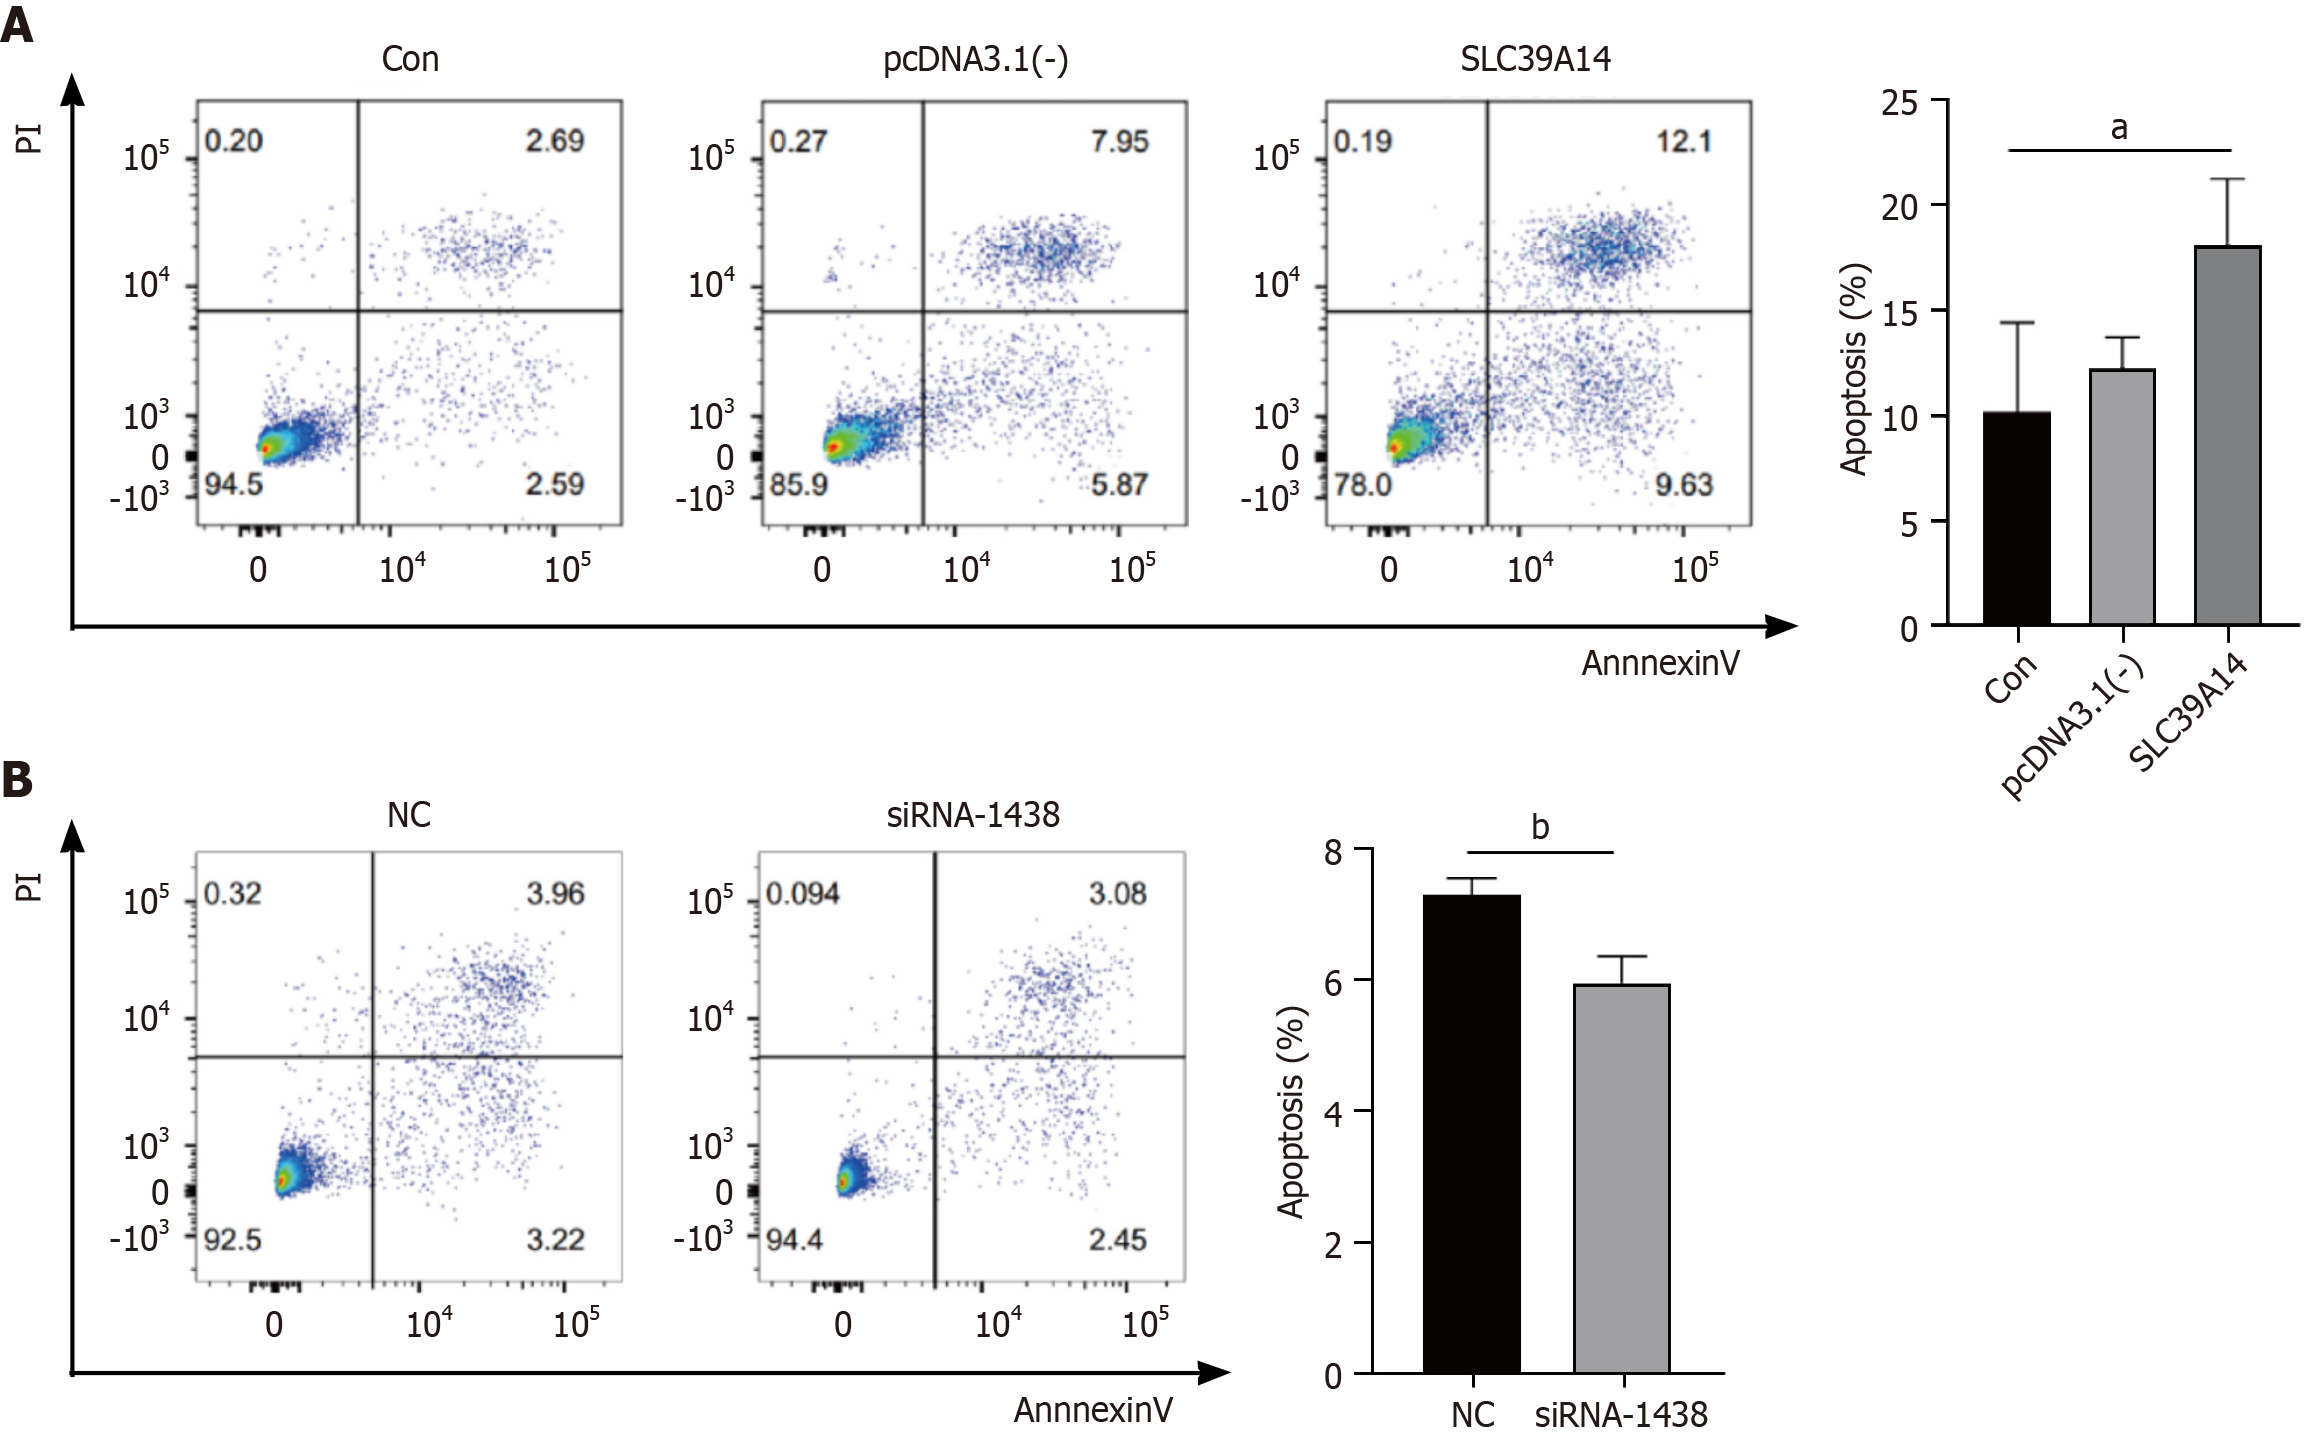
Figure 9 SLC39A14 in cell apoptosis.
A: Apoptosis detection by flow cytometry after SLC39A14 overexpression; B: Apoptosis detection by flow cytometry after SLC39A14 knockdown. aP < 0.05, bP < 0.01.
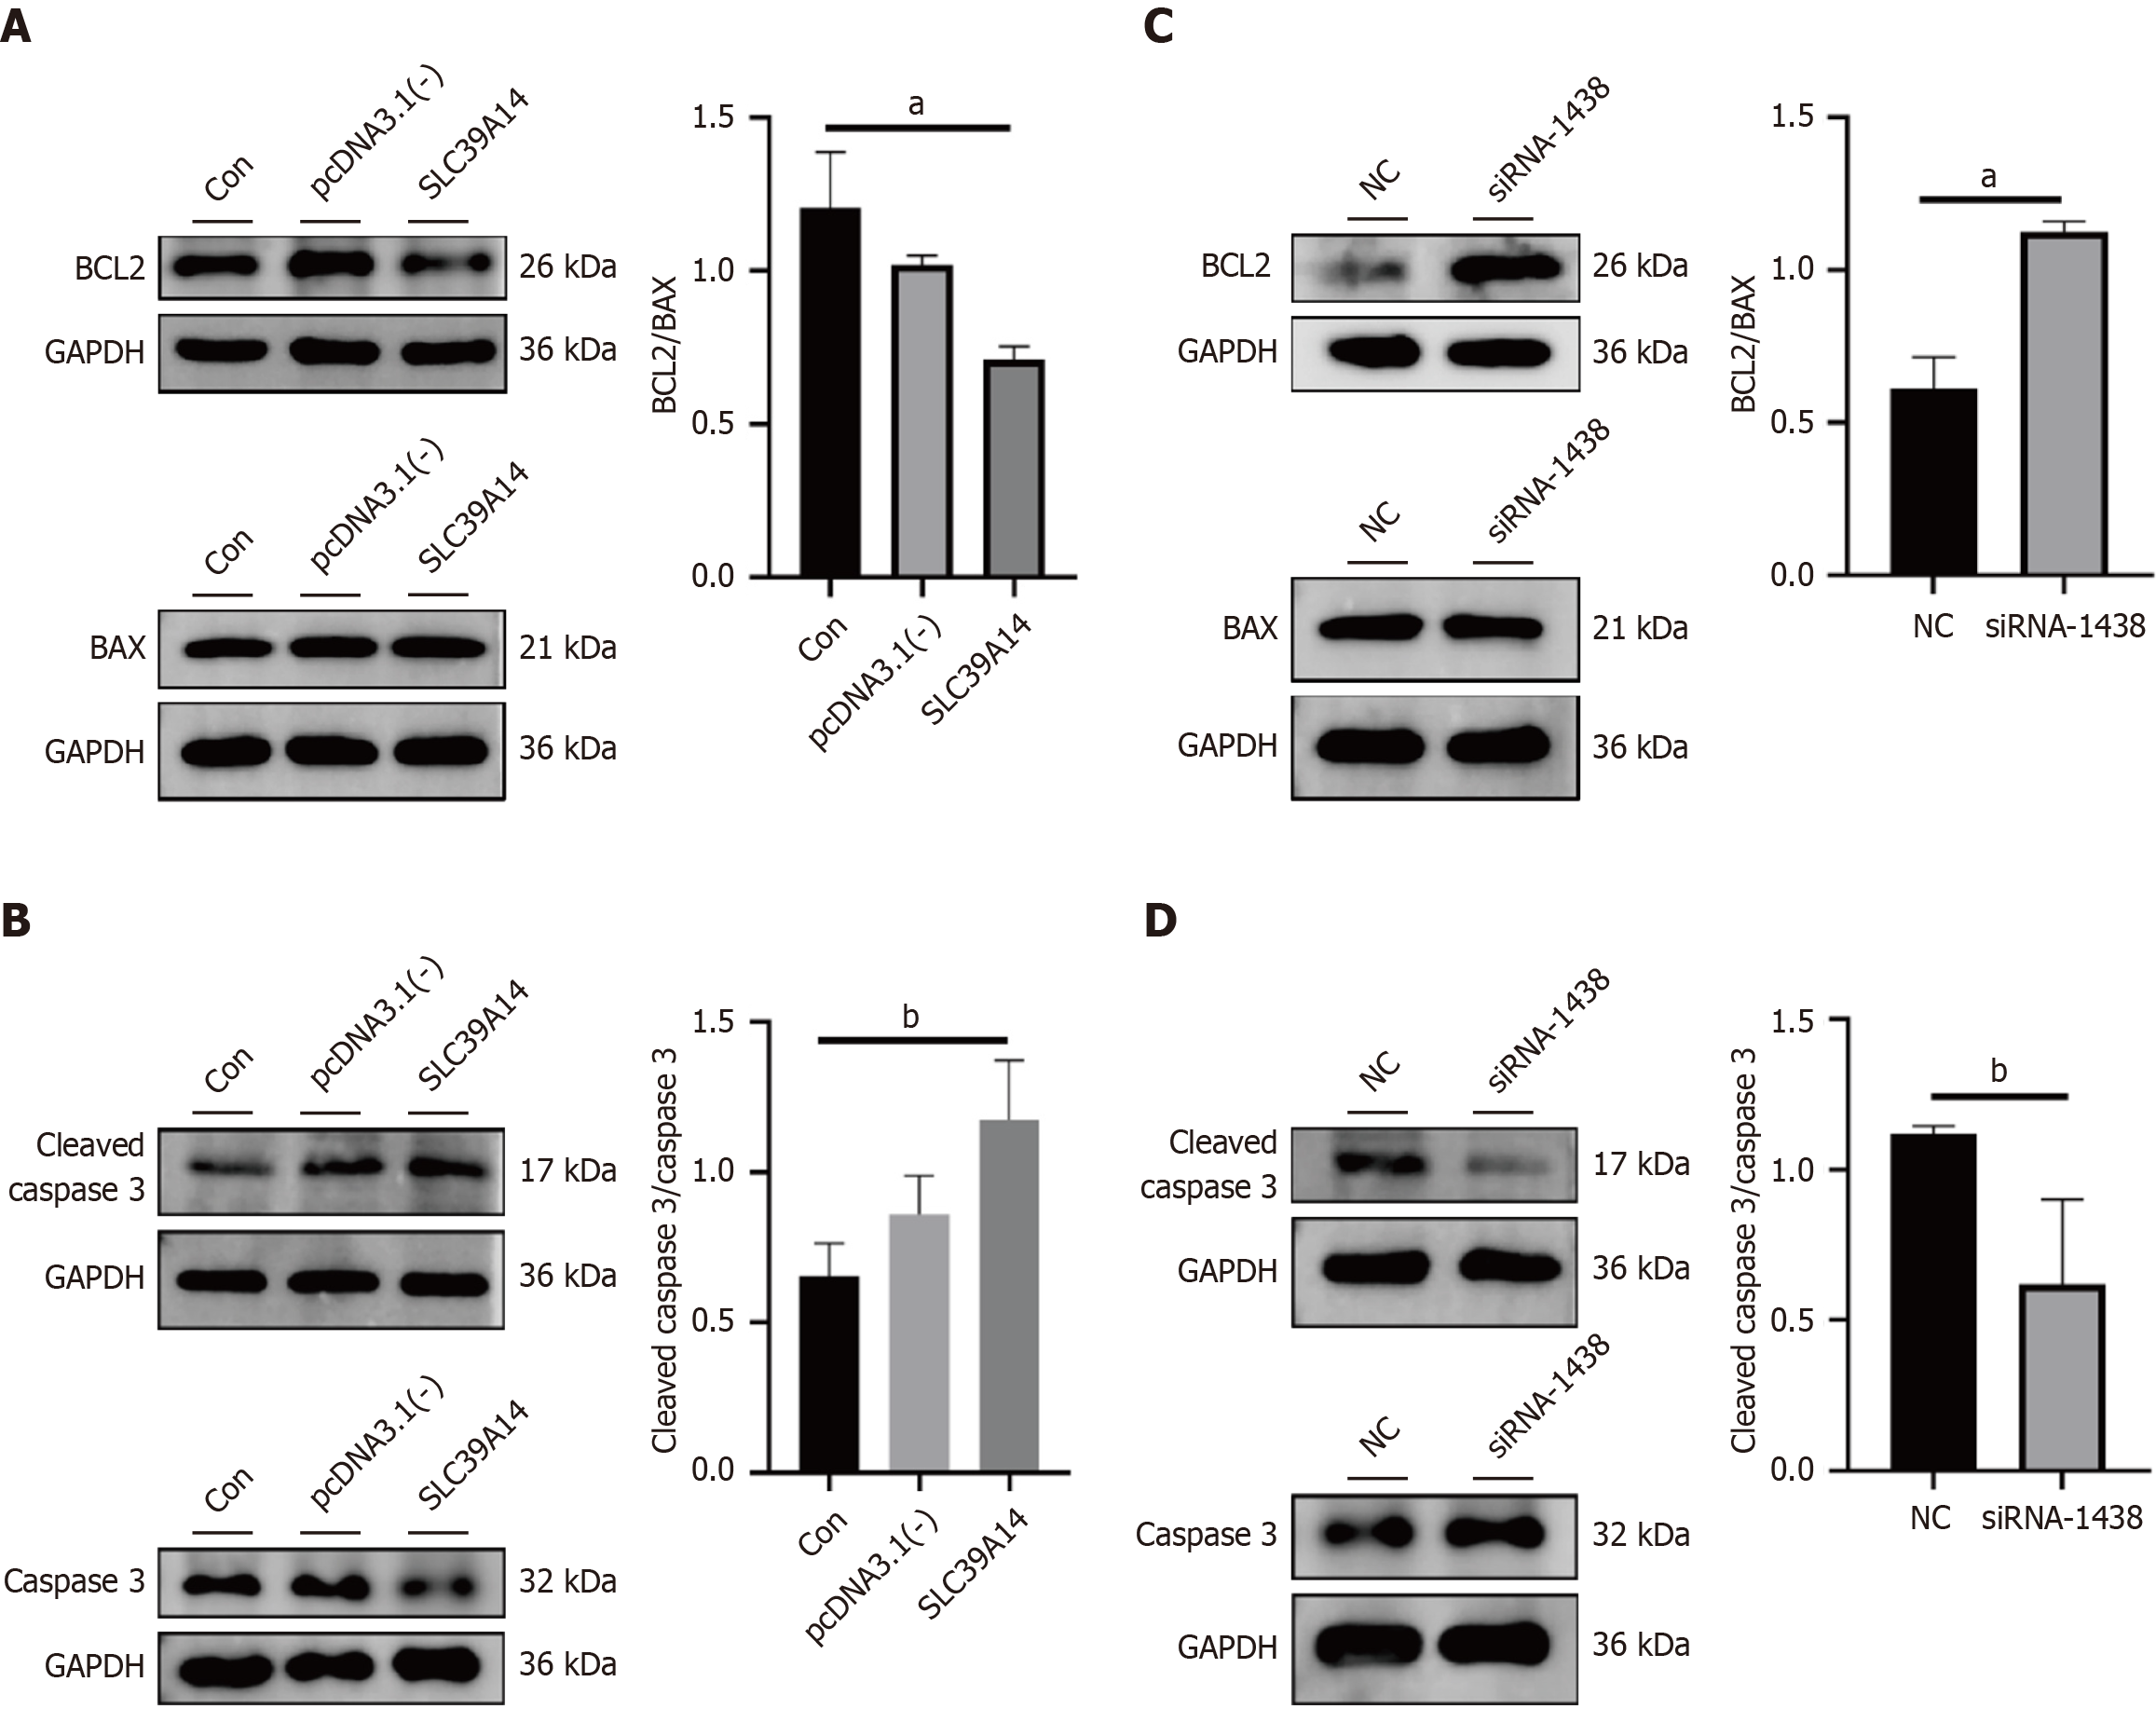
Figure 10 Alterations in the BCL-2/BAX/caspase-3 pathway.
A: Pathway proteins BCL2/BAX expression after overexpression plasmid transfection; B: Pathway proteins cleaved caspase 3/caspase 3 expression after overexpression plasmid transfection; C: BCL2/BAX expression after siRNA transfection; D: Cleaved caspase 3/caspase 3 expression after siRNA transfection. aP < 0.01, bP < 0.05.
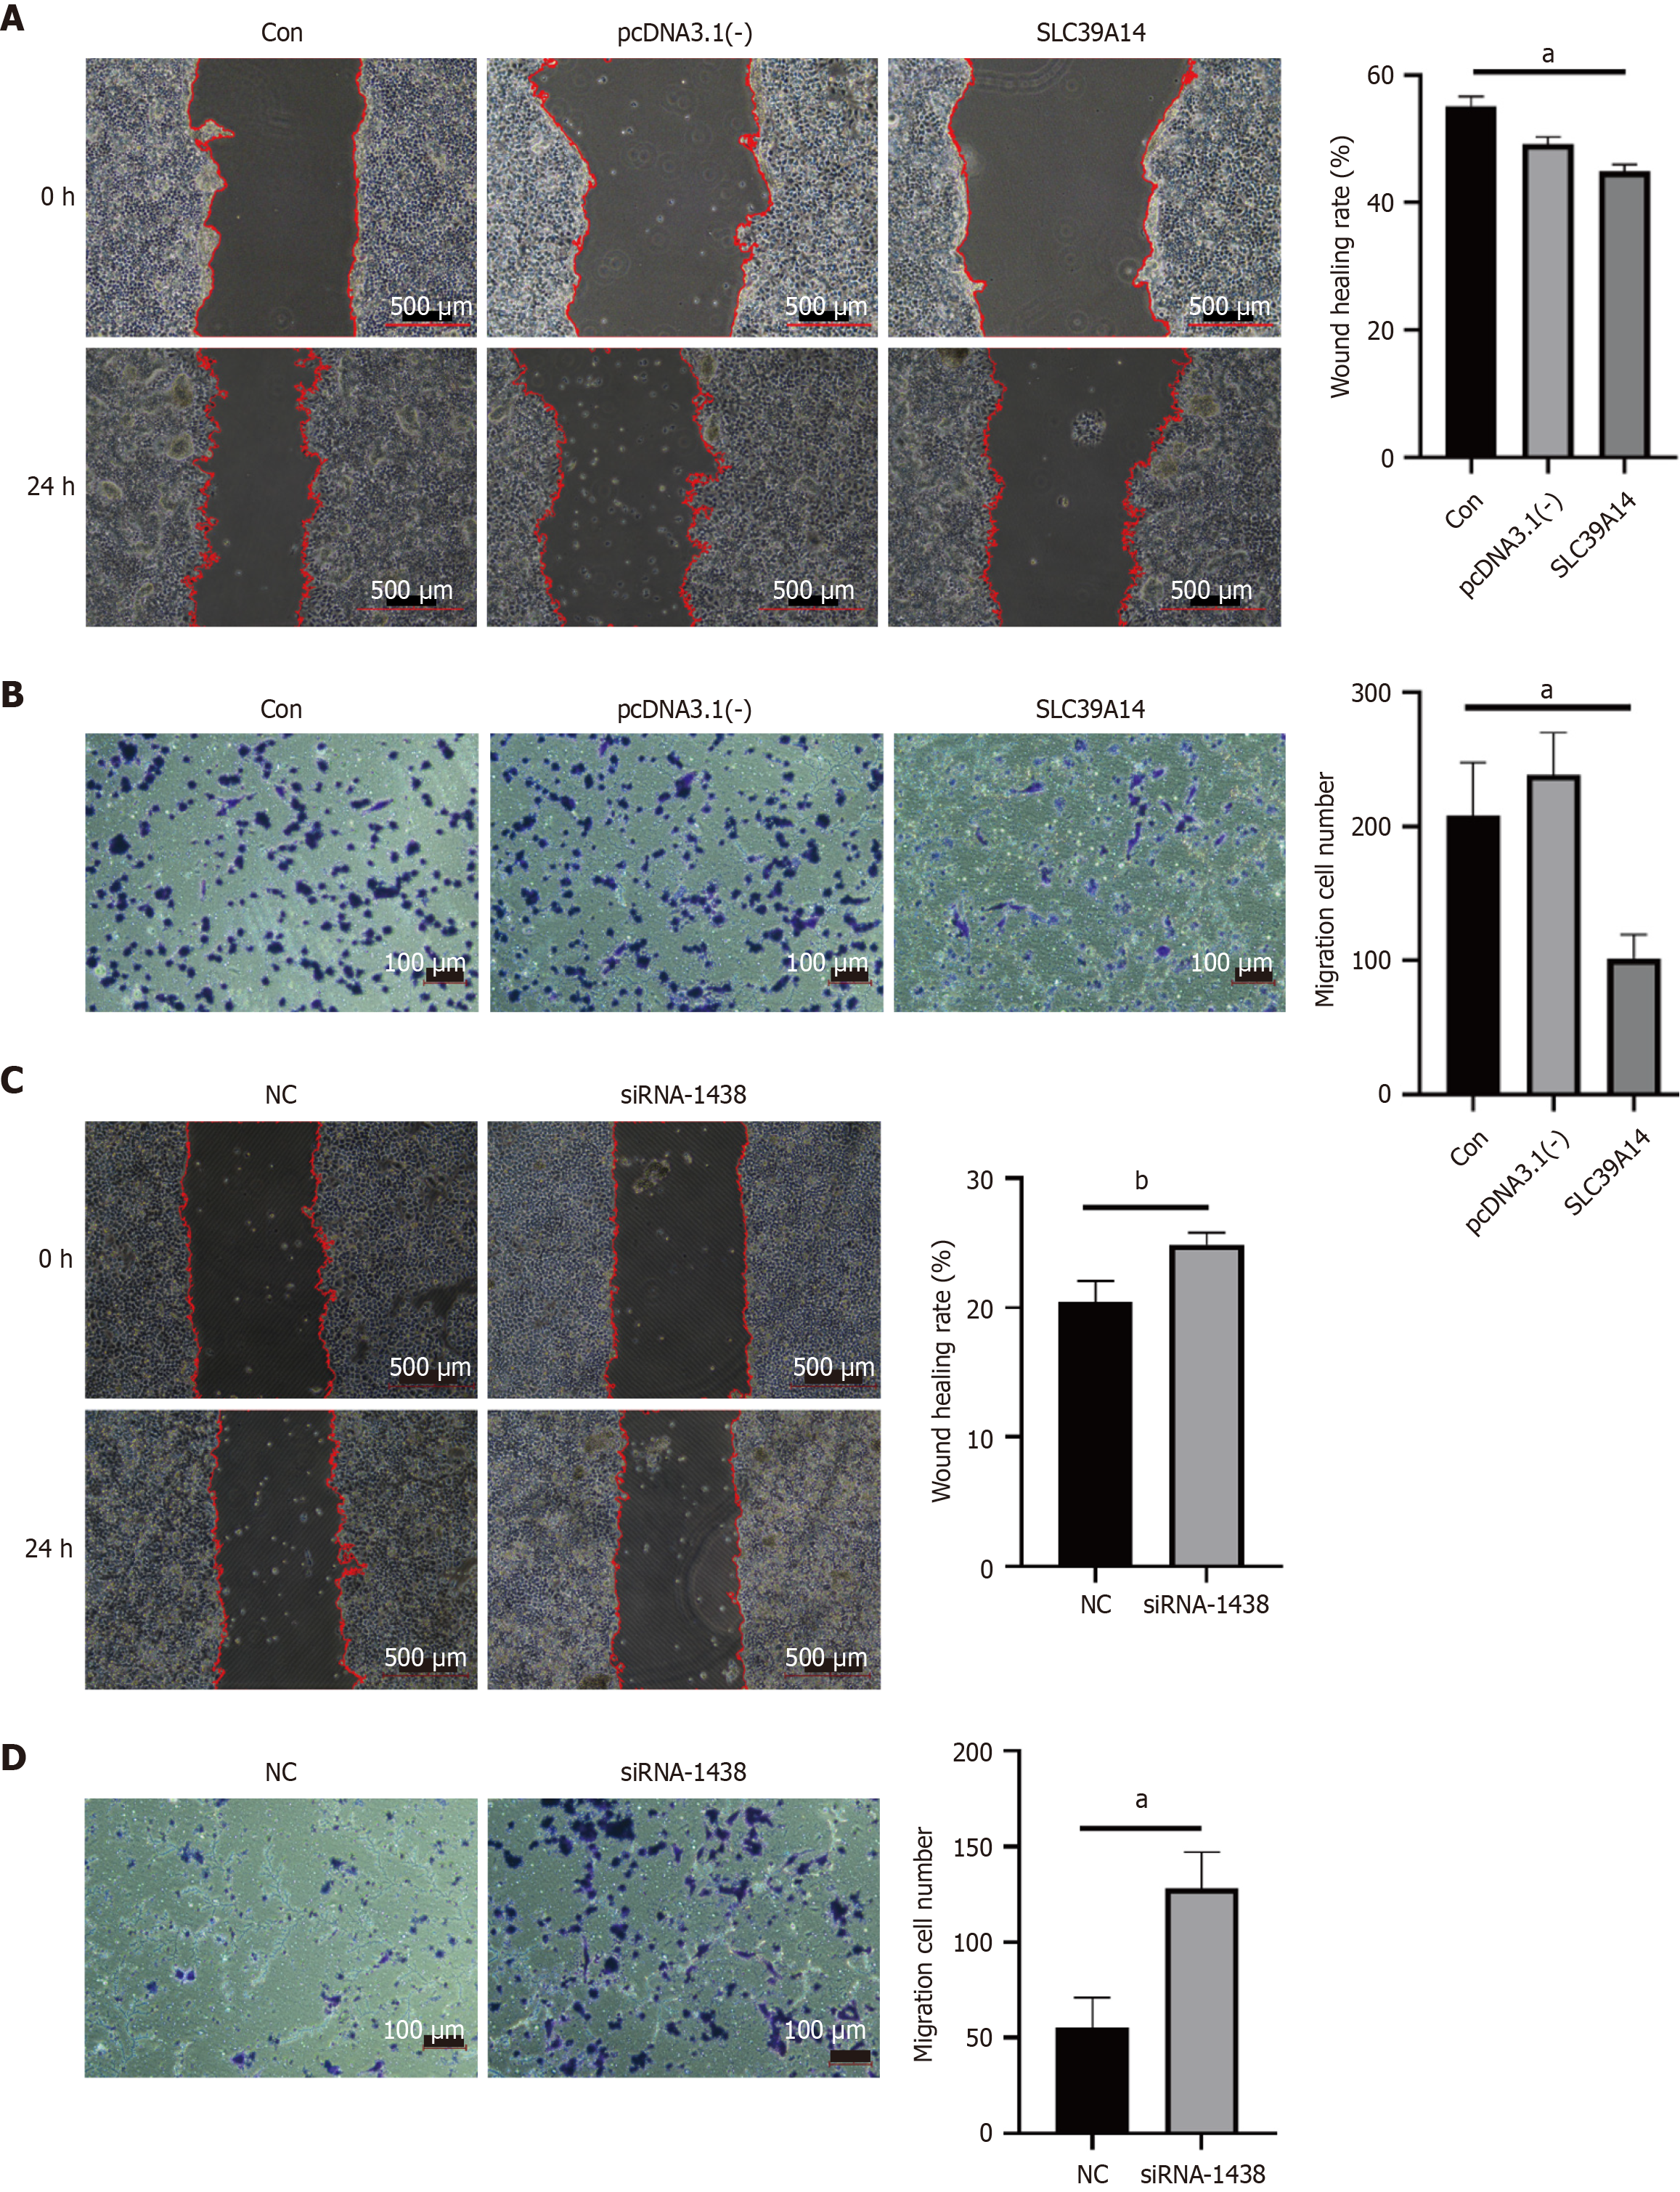
Figure 11 SLC39A14 in cell metastasis.
A: Cell metastasis detection by scratch assay after SLC39A14 overexpression; B: Cell metastasis detection by Transwell assay after SLC39A14 overexpression; C: Cell metastasis detection by scratch assay after SLC39A14 knockdown; D: Cell metastasis detection by Transwell assay after SLC39A14 knockdown. aP < 0.05, bP < 0.01.
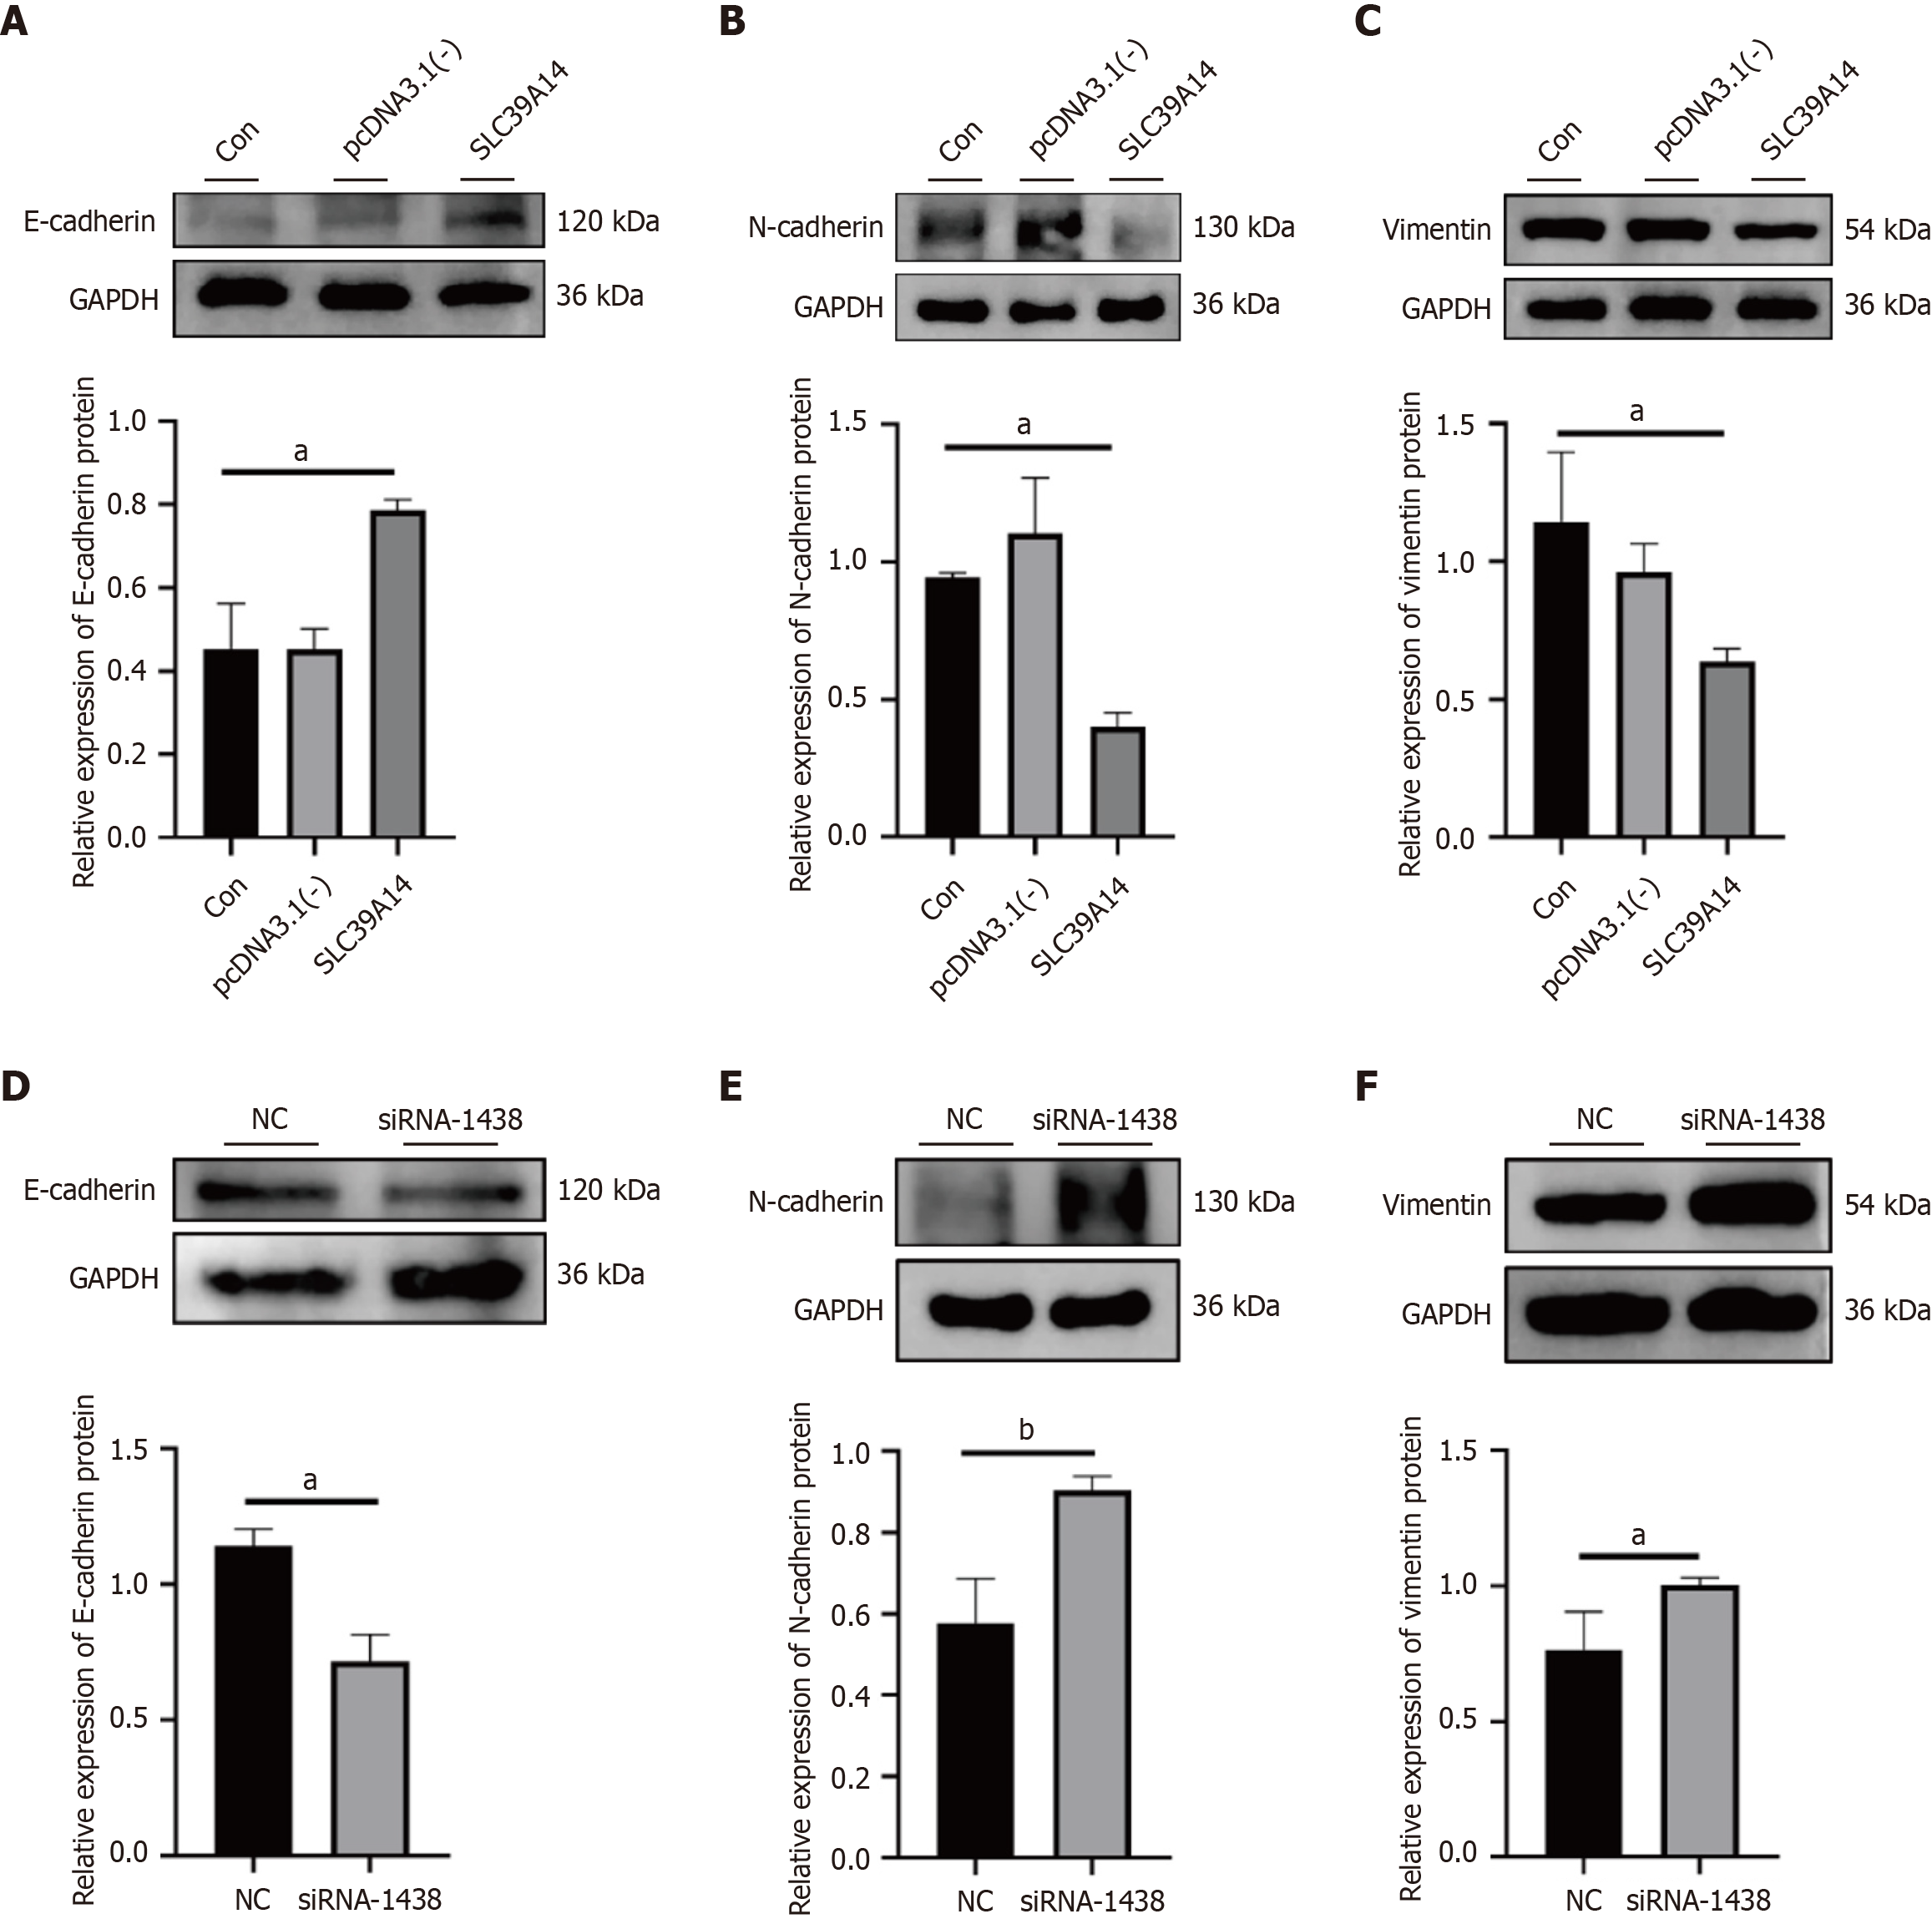
Figure 12 Alterations in epithelial-mesenchymal transition.
A: Epithelial–mesenchymal transition (EMT)-related protein E-cadherin expression after overexpression plasmid transfection; B: EMT-related protein N-cadherin expression after overexpression plasmid transfection; C: EMT-related protein vimentin expression after overexpression plasmid transfection; D: E-cadherin expression after siRNA transfection; E: N-cadherin expression after siRNA transfection; F: Vimentin expression after siRNA transfection. EMT: Epithelial–mesenchymal transition. aP < 0.05, bP < 0.01.
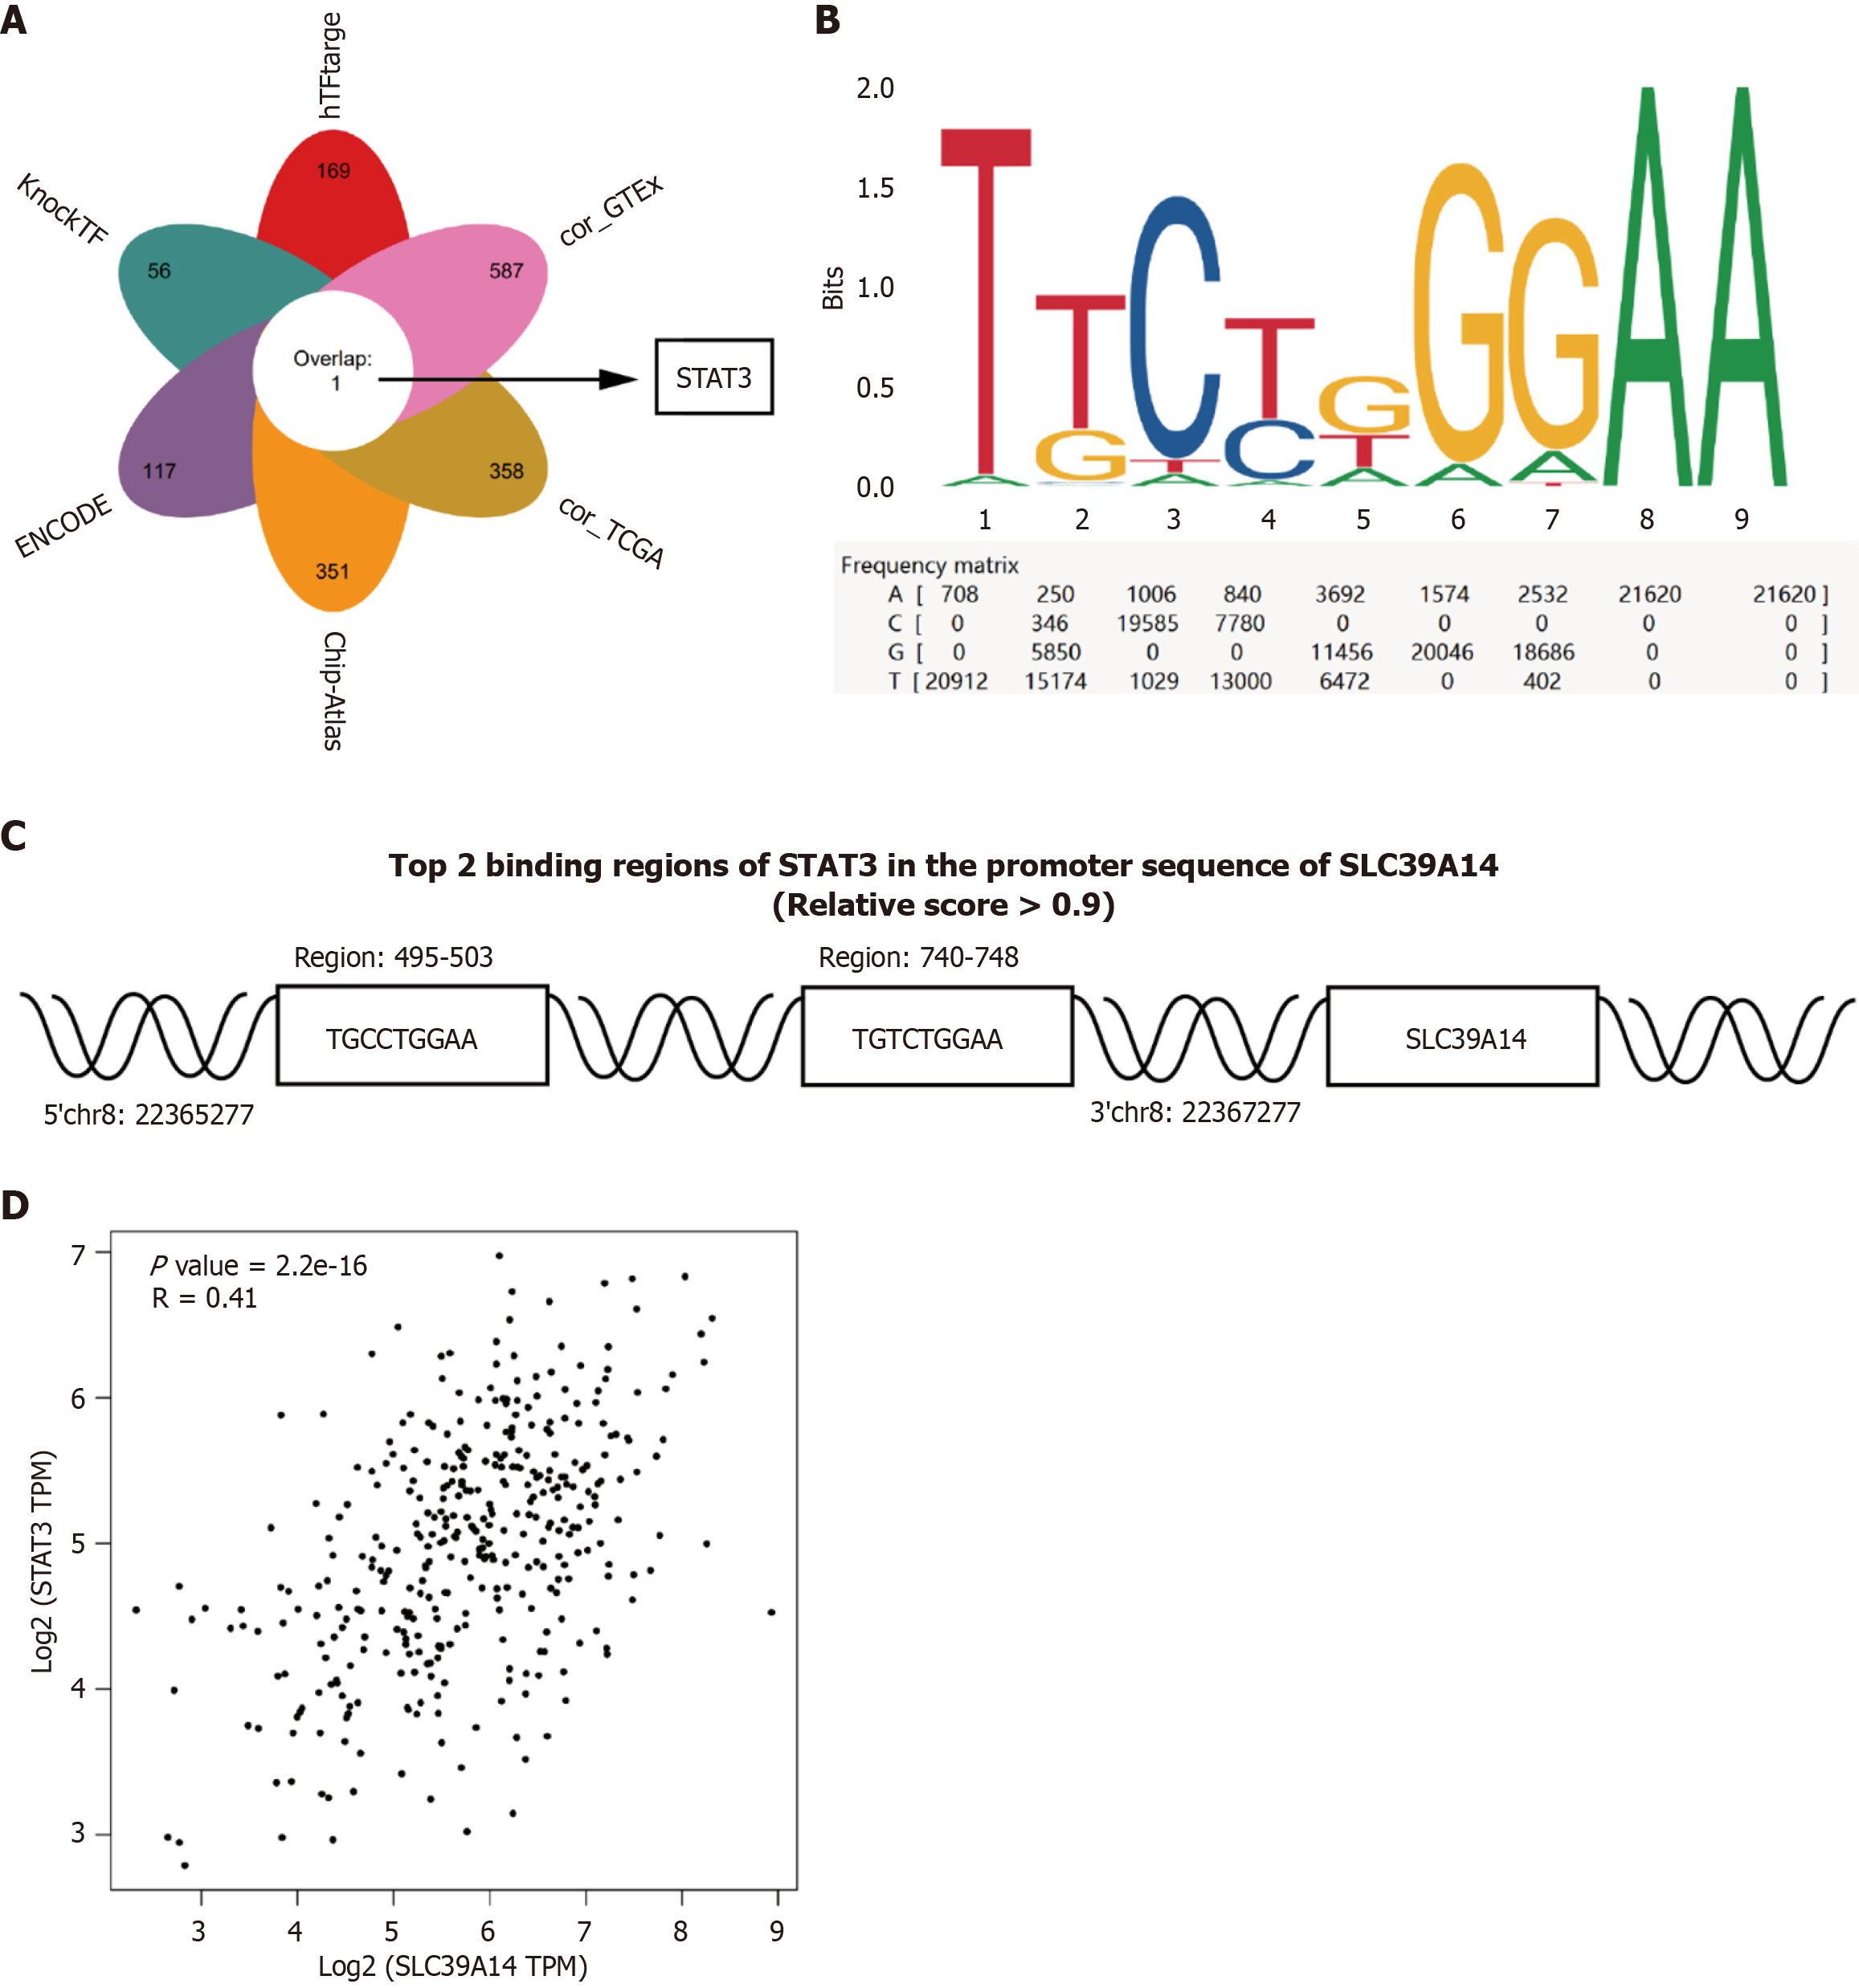
Figure 13 SLC39A14 is regulated by the transcription factor STAT3.
A: Bioinformatics analysis identified STAT3 as one of potential transcription factor driving SLC39A14 expression; B and C: Binding sites for STAT3 in the promoter region of SLC39A14 were identified according to the JASPAR website; D: Pearson’s correlational analysis was performed to explore the correlation between the mRNA levels of STAT3 and SLC39A14 in hepatocellular carcinoma patients in The Cancer Genome Atlas dataset (r = 0.41, P < 0.0001).
- Citation: Guo W, Wang MX, Mu T, Xu K, Jiang ZD, Wan XH, Li JW, Yi YX. Reduction in the hepatocellular carcinoma antioncogene SLC39A14 during the malignant progression of hepatocellular carcinoma. World J Gastrointest Surg 2025; 17(10): 111454
- URL: https://www.wjgnet.com/1948-9366/full/v17/i10/111454.htm
- DOI: https://dx.doi.org/10.4240/wjgs.v17.i10.111454


