Copyright
©The Author(s) 2024.
World J Gastrointest Surg. Aug 27, 2024; 16(8): 2574-2582
Published online Aug 27, 2024. doi: 10.4240/wjgs.v16.i8.2574
Published online Aug 27, 2024. doi: 10.4240/wjgs.v16.i8.2574
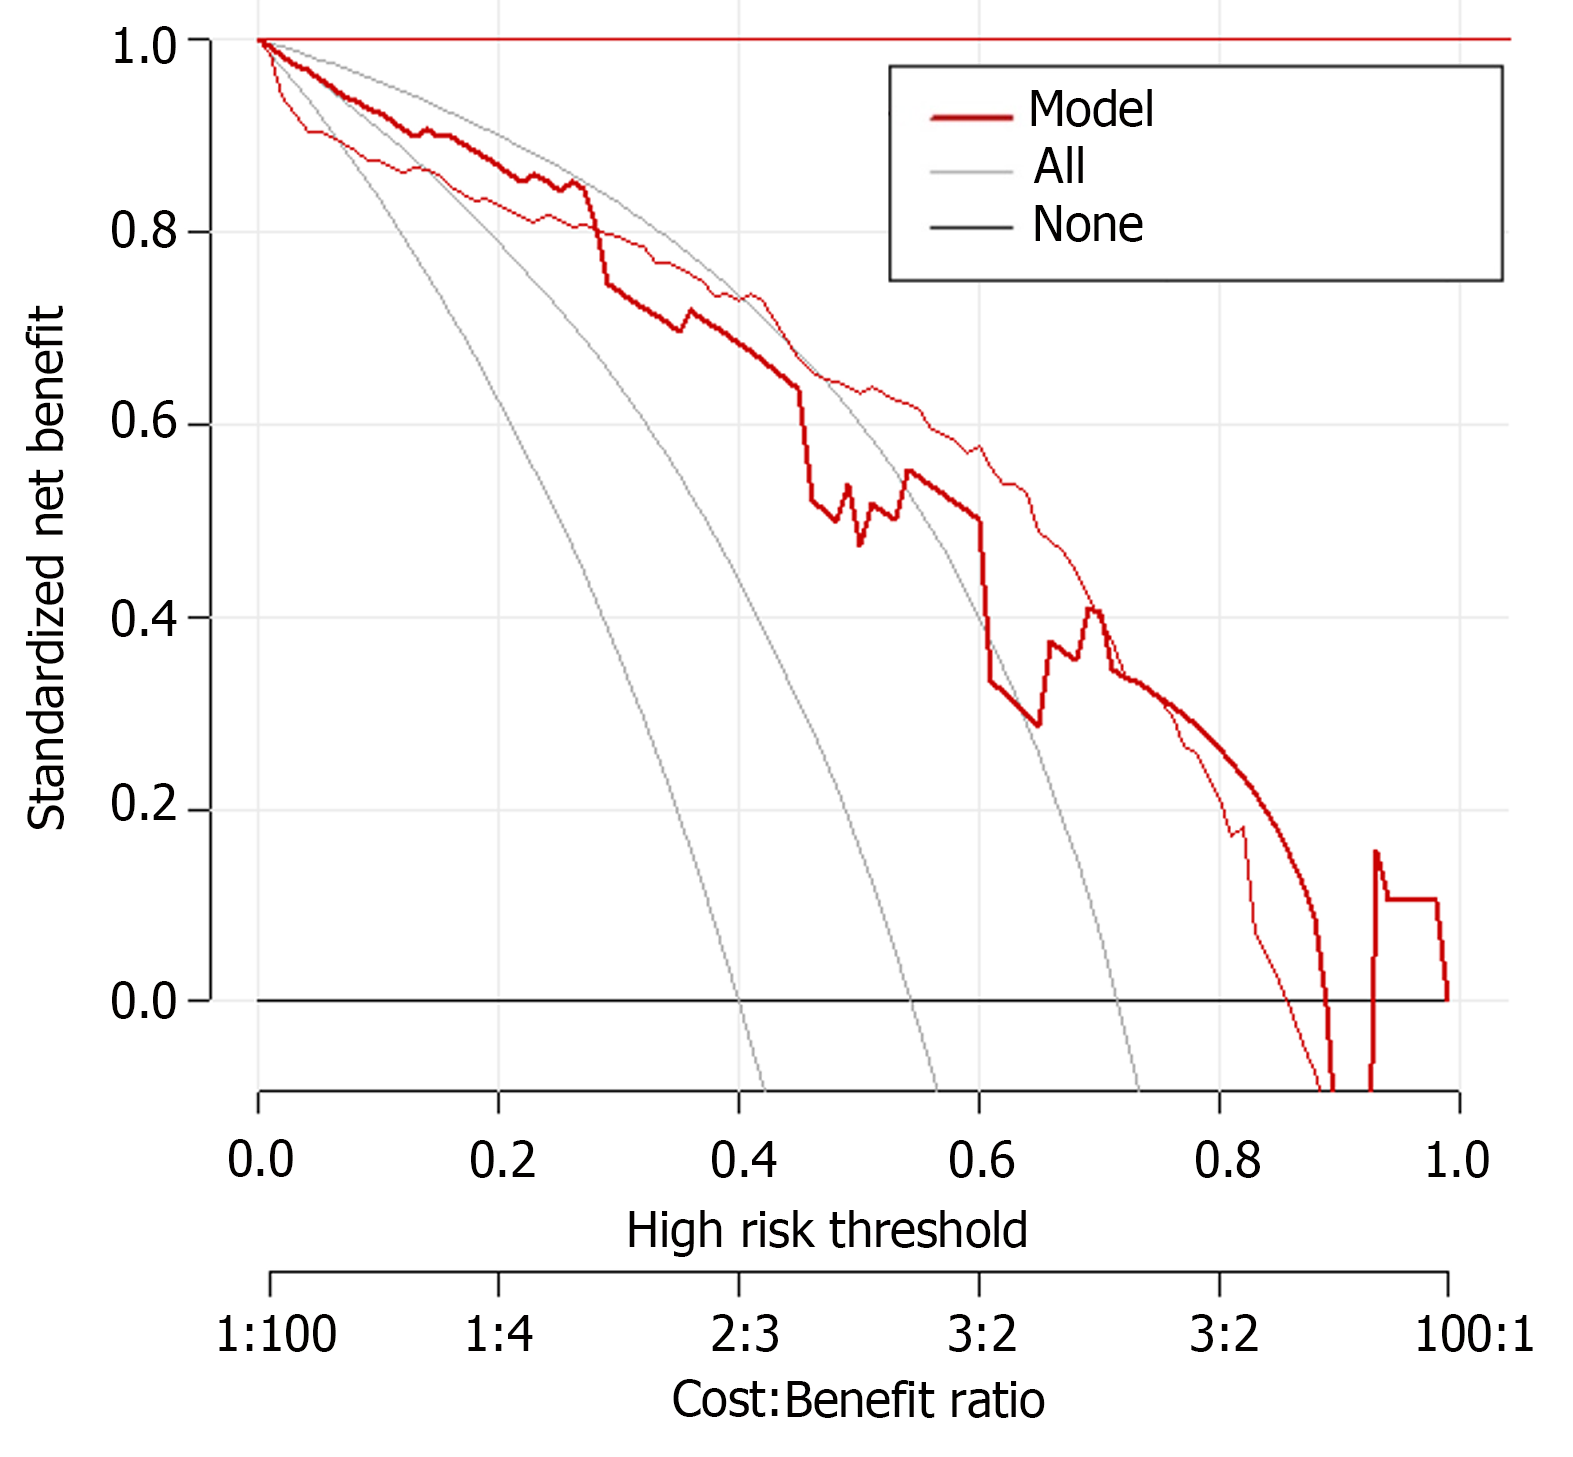
Figure 1
Predictive model for preoperative gastric retention in endoscopic retrograde cholangiopancreatography patients.
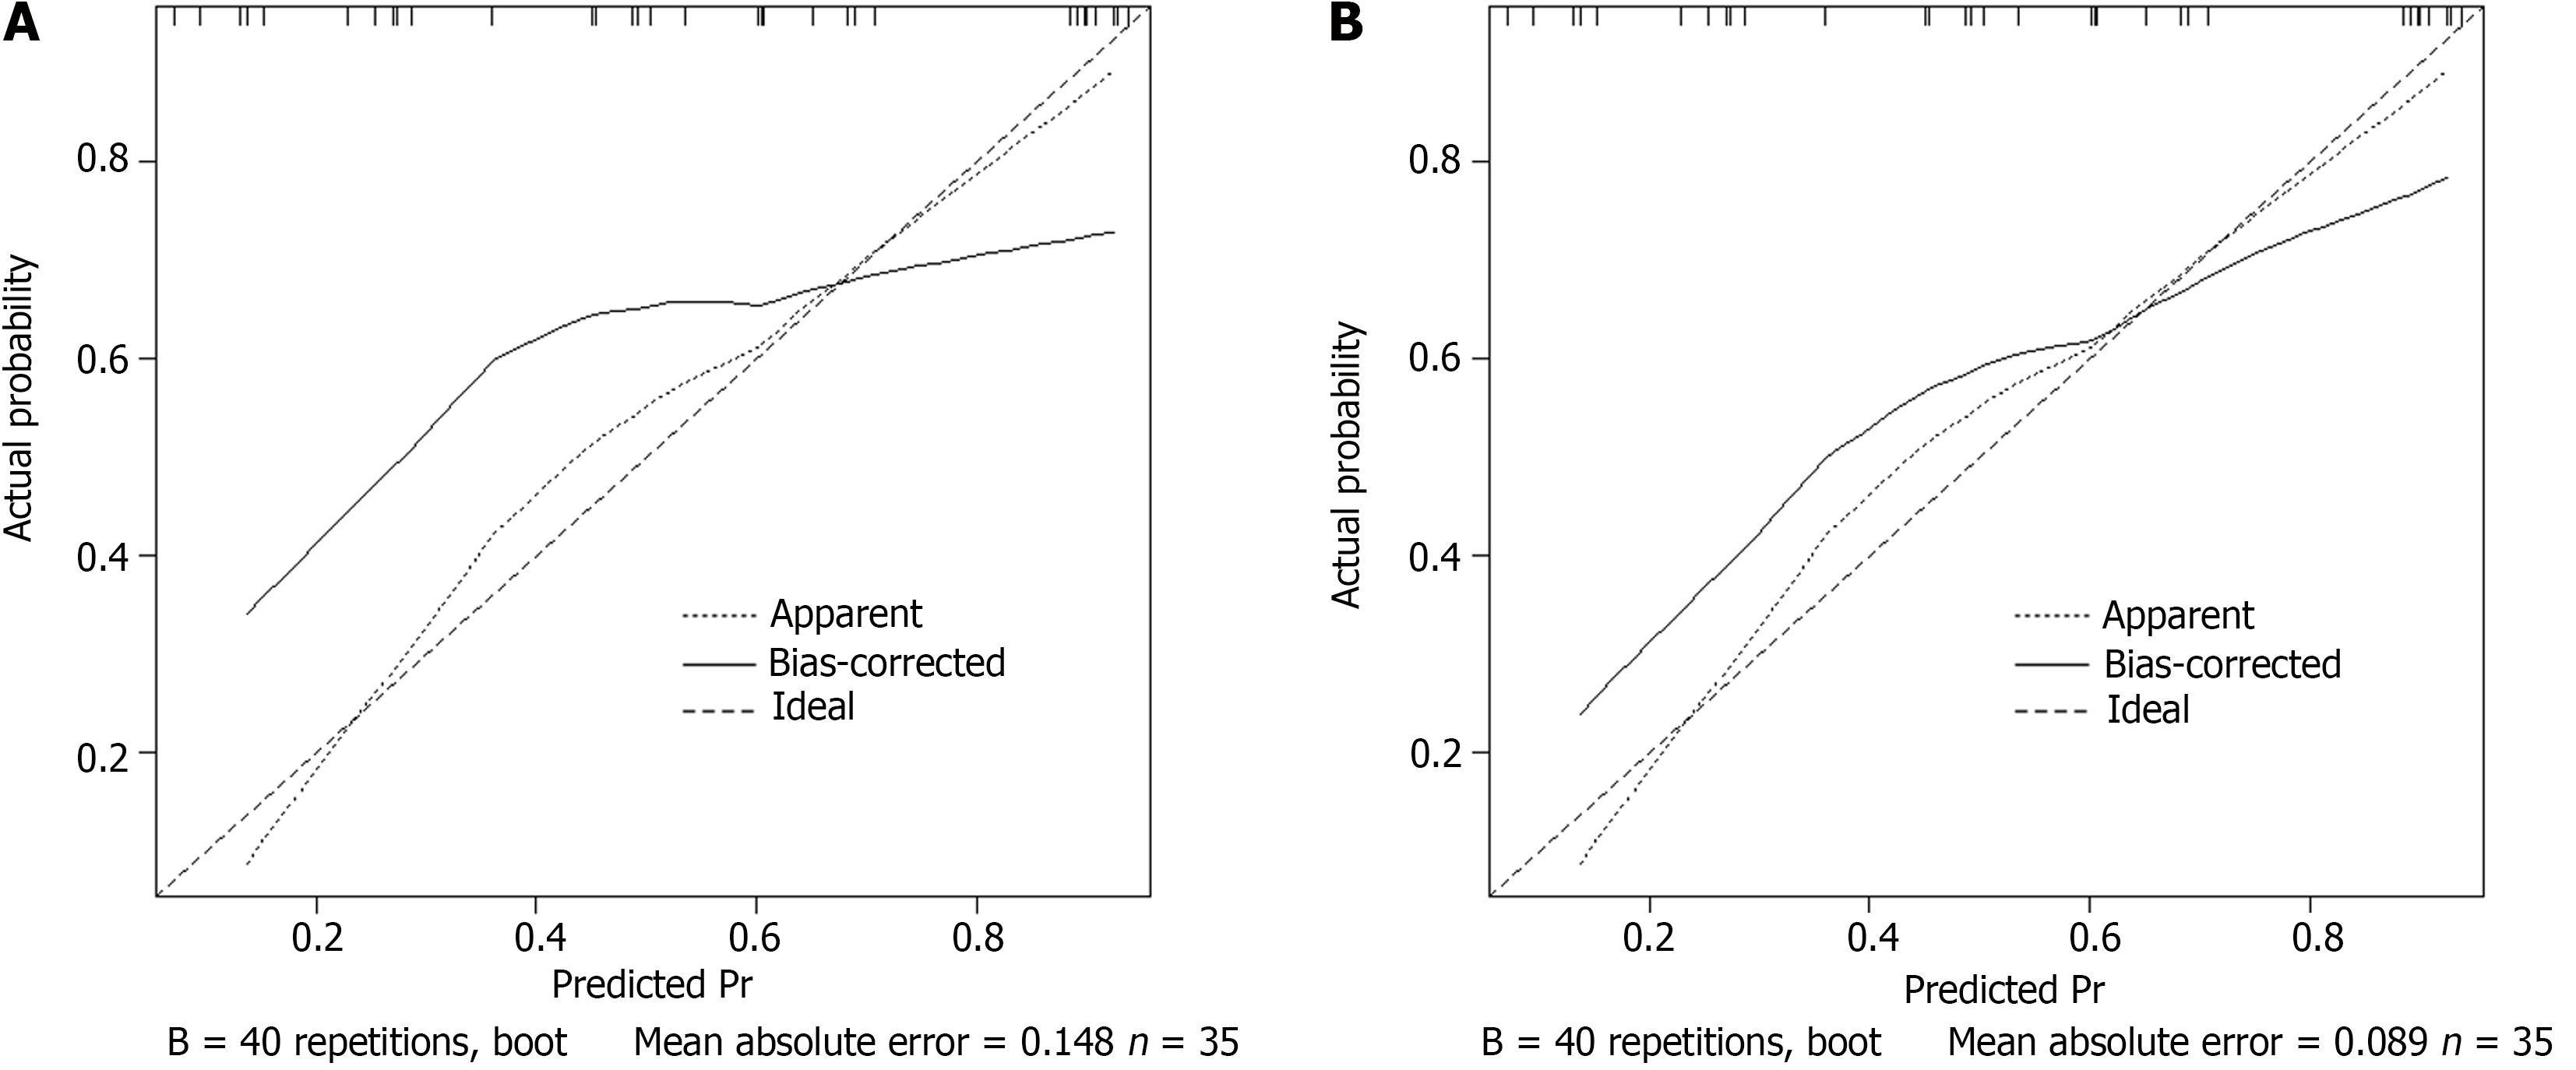
Figure 2 Calibration curve.
A: Raining set; B: Validation set.
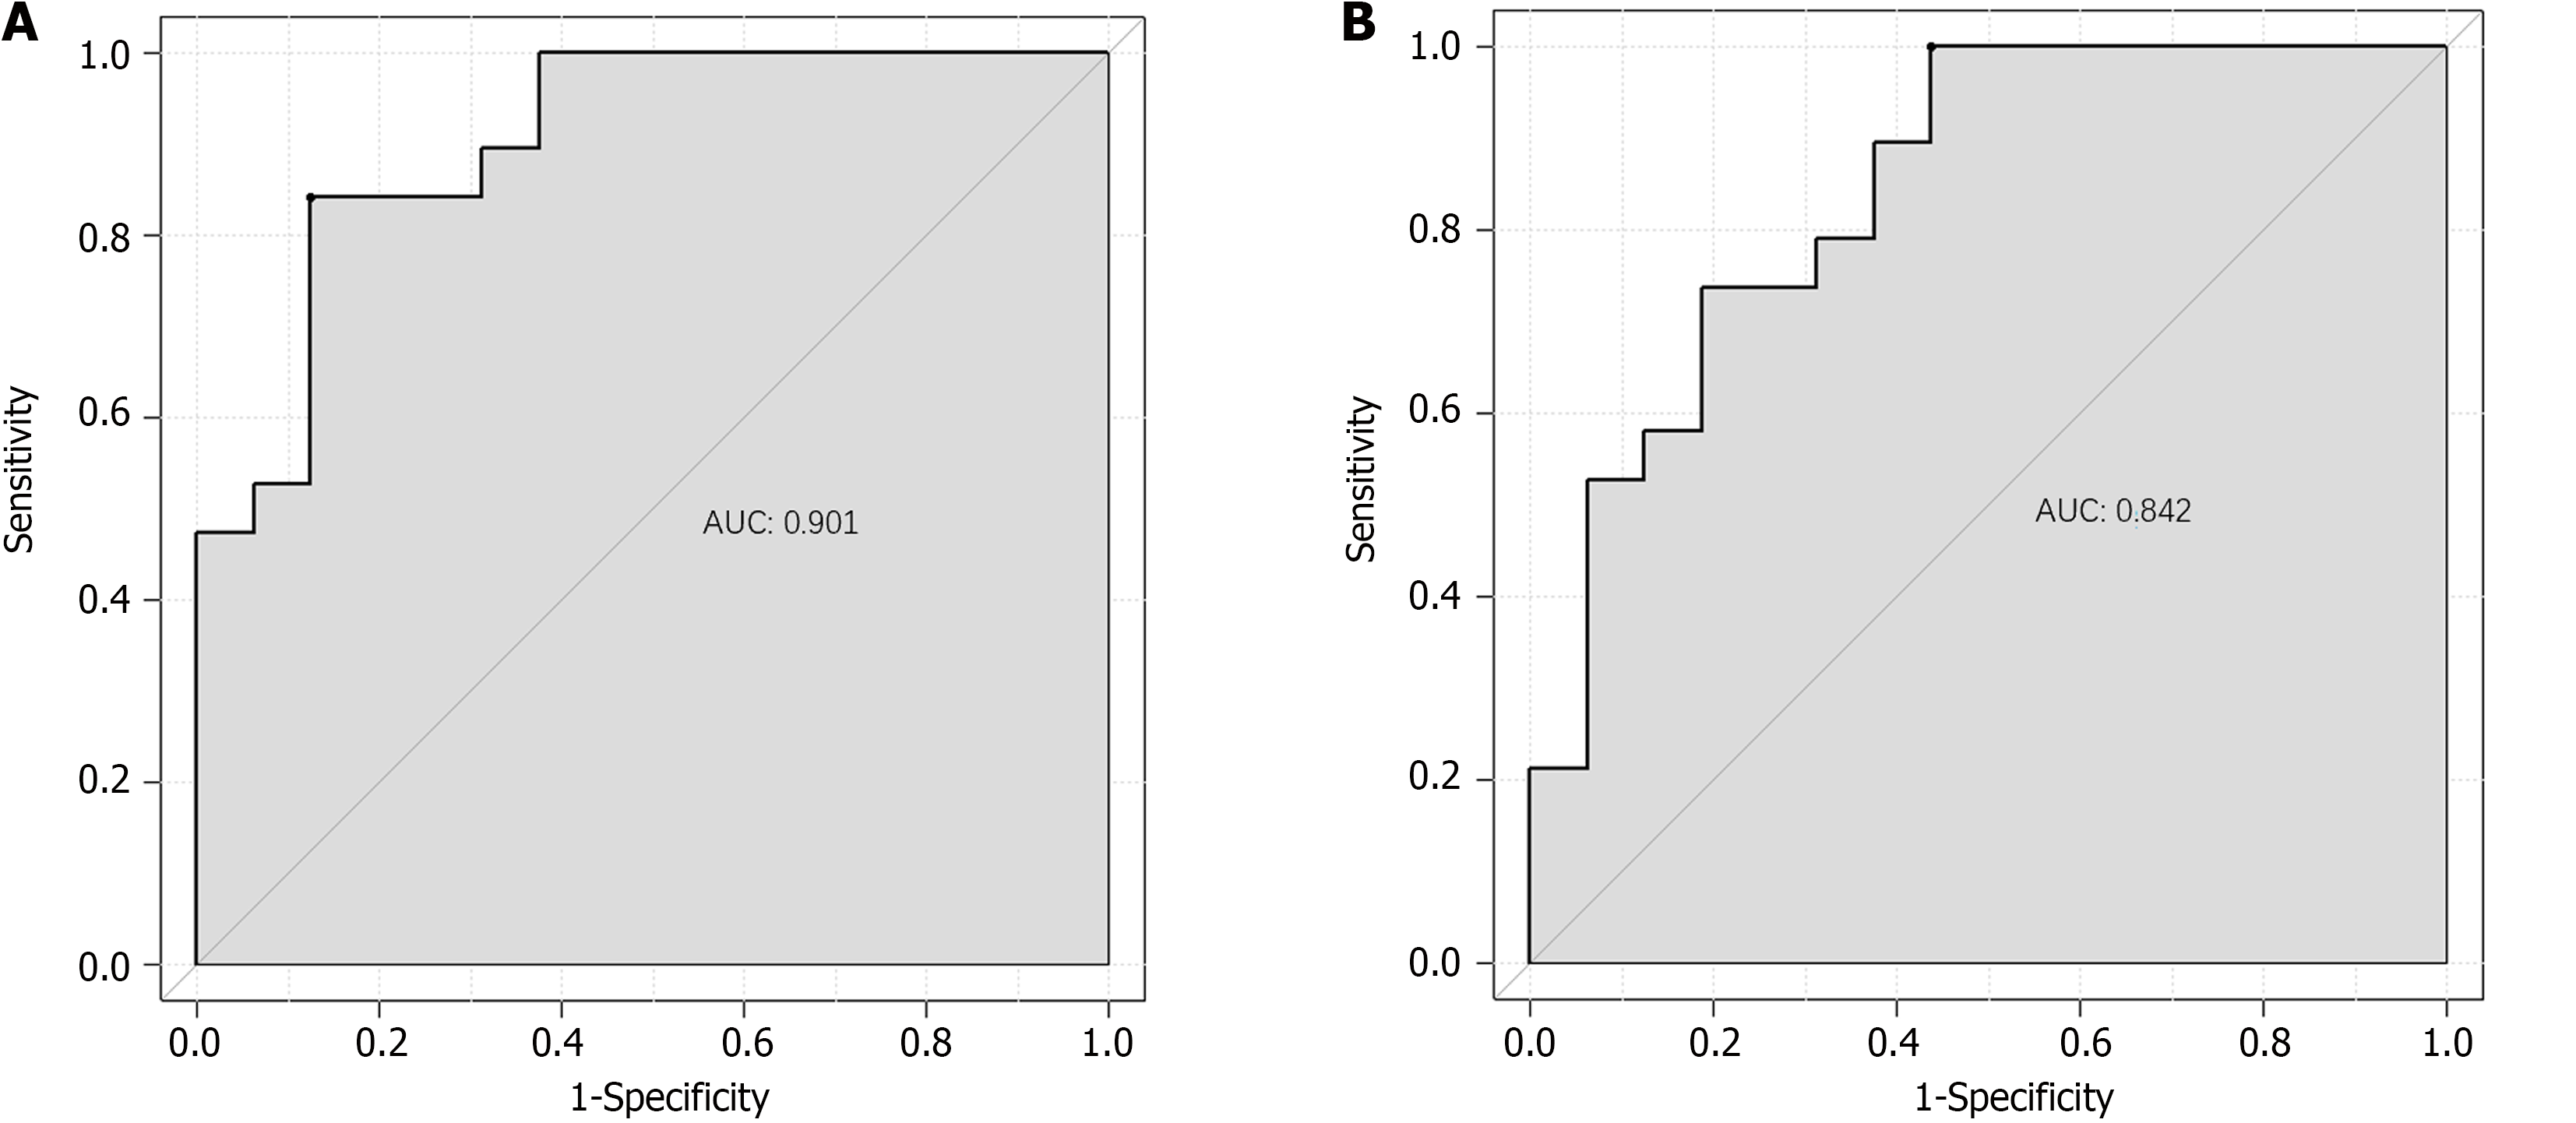
Figure 3 Receiver operating characteristic curve analysis of the model predicting pre-procedural gastric retention in the training set.
A: An area under the curve (AUC) value greater than 0.9 indicates that the prediction value of the prediction model is excellent and can be further analyzed; B: The model in the verification set is 0.7 < AUC < 0.9, indicating that the model has good predictive value and can be further used in clinical practice. AUC: Area under the curve.
- Citation: Jia Y, Wu HJ, Li T, Liu JB, Fang L, Liu ZM. Establishment of predictive models and determinants of preoperative gastric retention in endoscopic retrograde cholangiopancreatography. World J Gastrointest Surg 2024; 16(8): 2574-2582
- URL: https://www.wjgnet.com/1948-9366/full/v16/i8/2574.htm
- DOI: https://dx.doi.org/10.4240/wjgs.v16.i8.2574


