Copyright
©The Author(s) 2024.
World J Gastrointest Surg. Aug 27, 2024; 16(8): 2436-2450
Published online Aug 27, 2024. doi: 10.4240/wjgs.v16.i8.2436
Published online Aug 27, 2024. doi: 10.4240/wjgs.v16.i8.2436
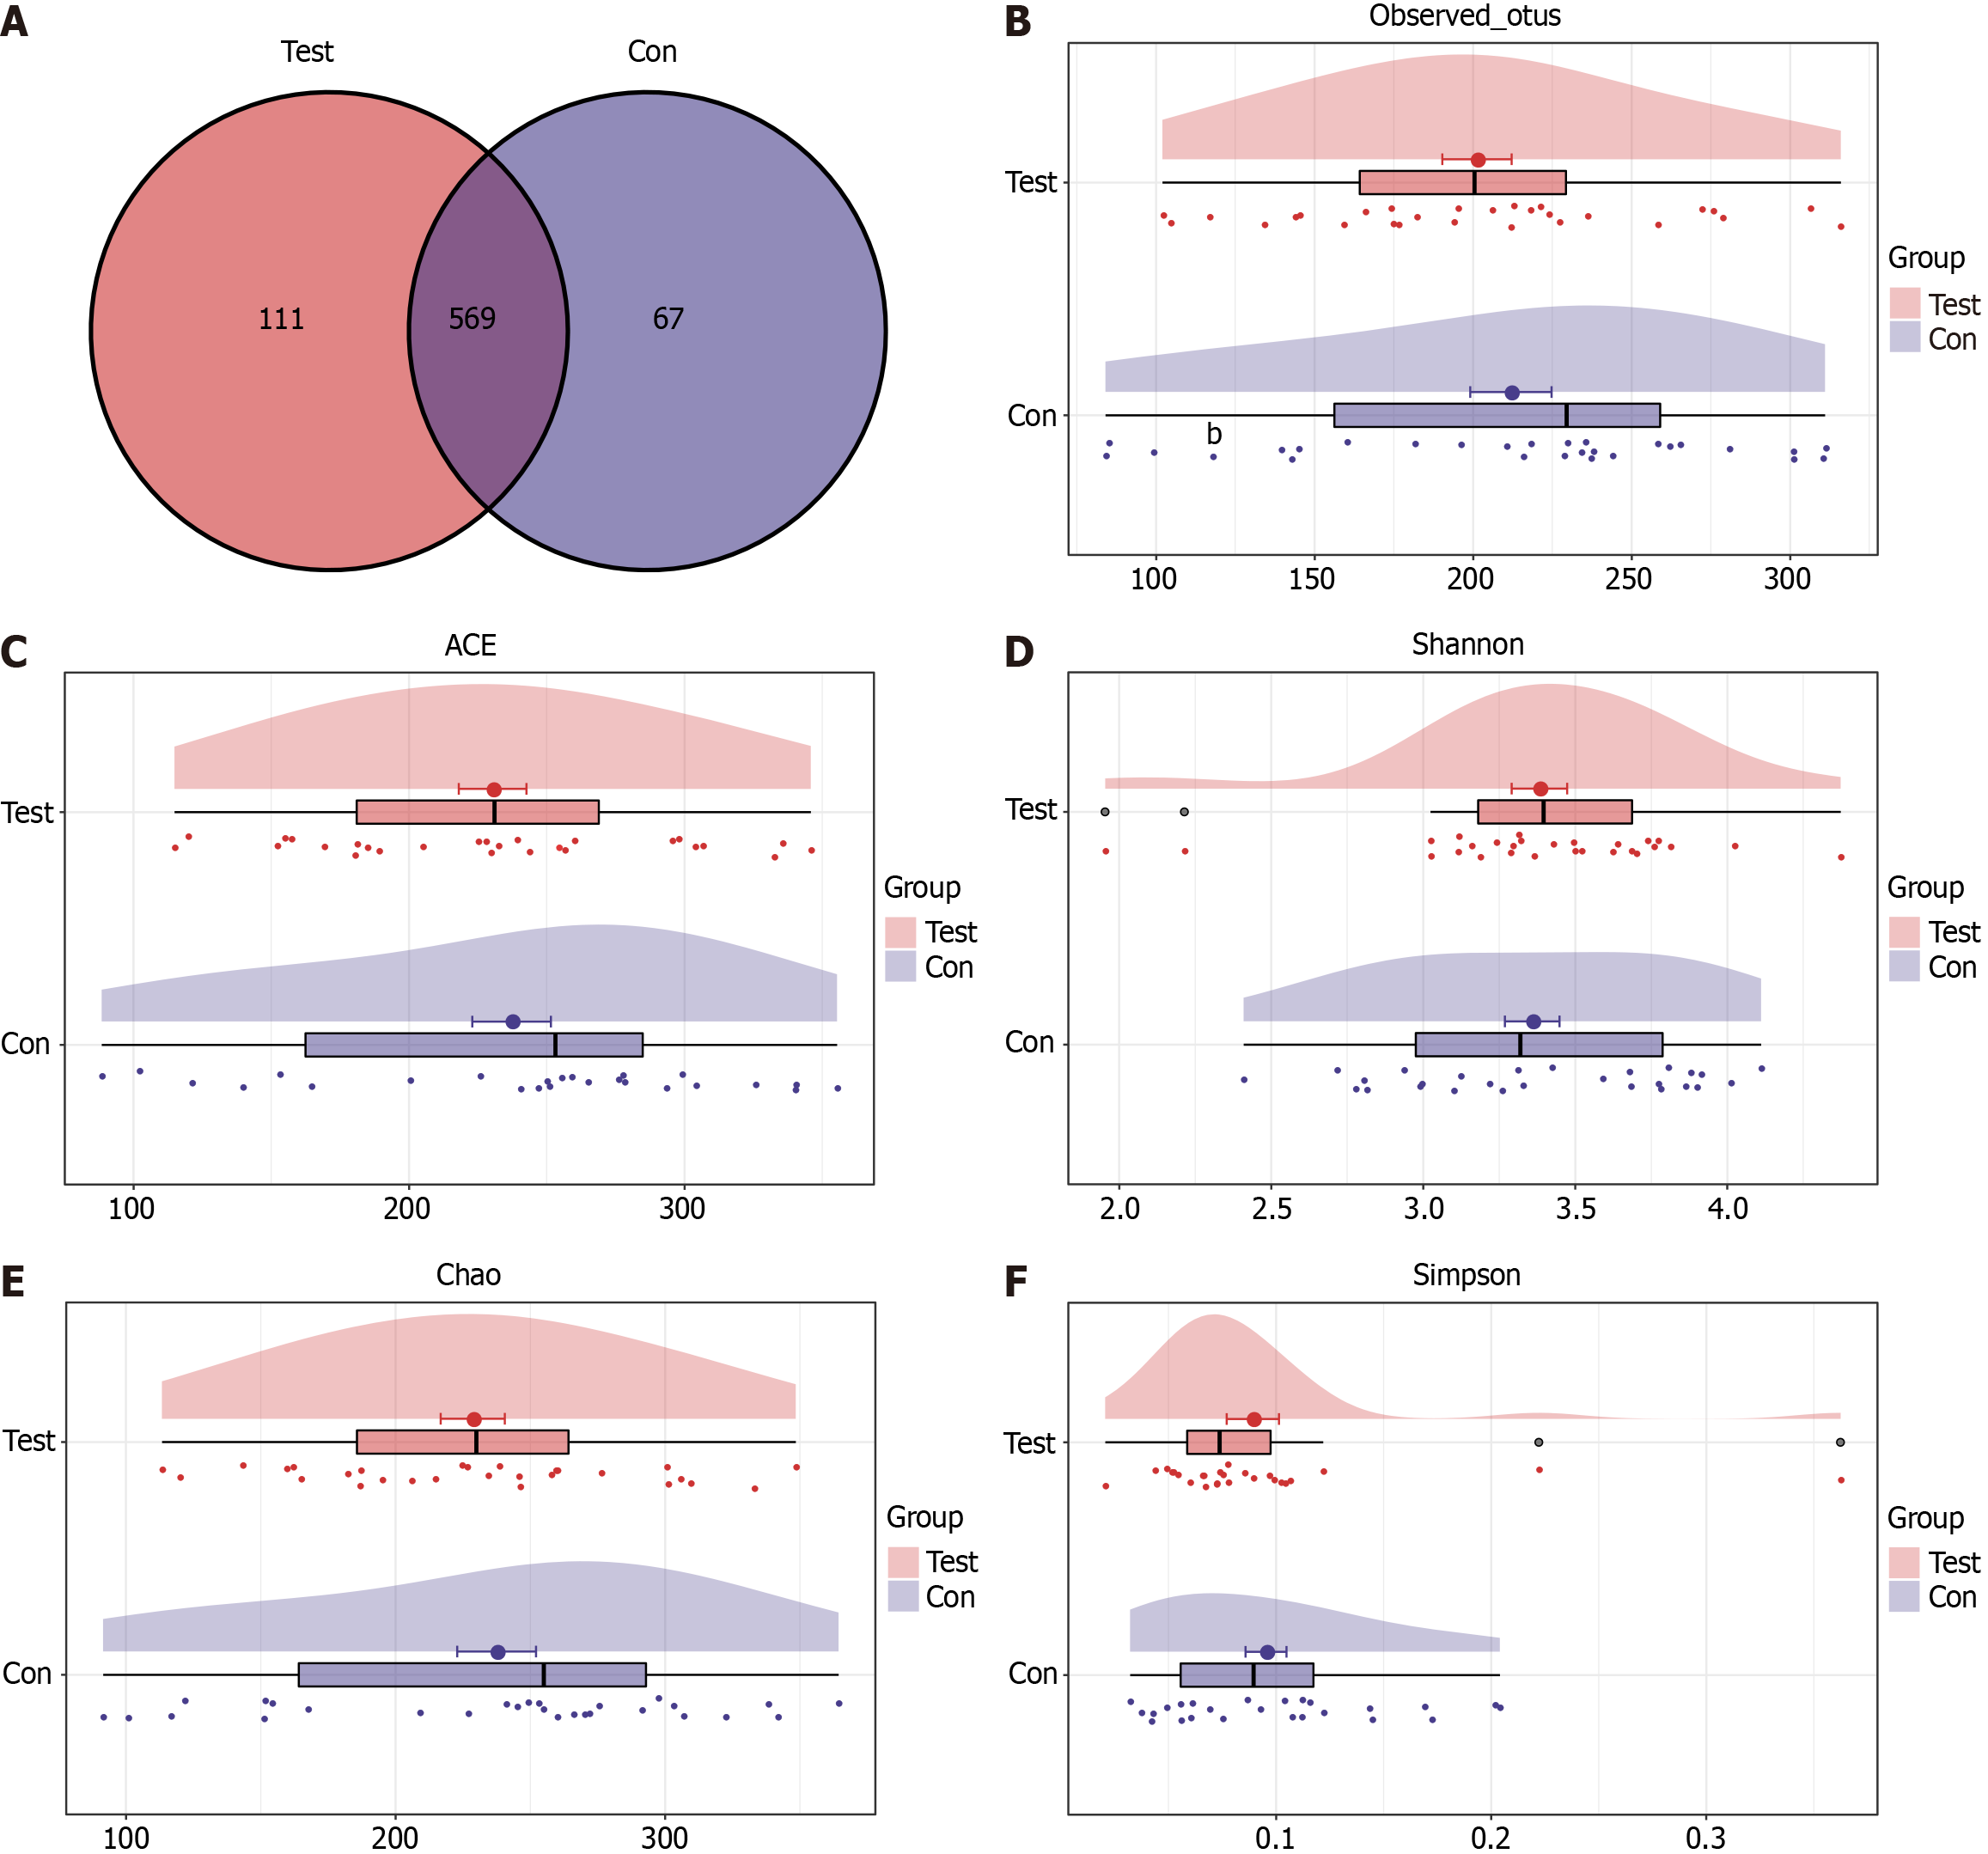
Figure 1 Clustering of operational taxonomic units and alpha diversity study of mucosal intestinal microflora in the test group and the control group.
A: A Venn image showing the common and unique operational taxonomic units (OTUs) between the test and control groups; B: The OTUs that were found in a single sample from each group; C: Abundance-based coverage estimator of the test group and the control group; D: Chao index of the test group and the control group; E: Shannon-Wiener diversity index of the test group and the control group; F: Simpson diversity index of the test group and the control group.
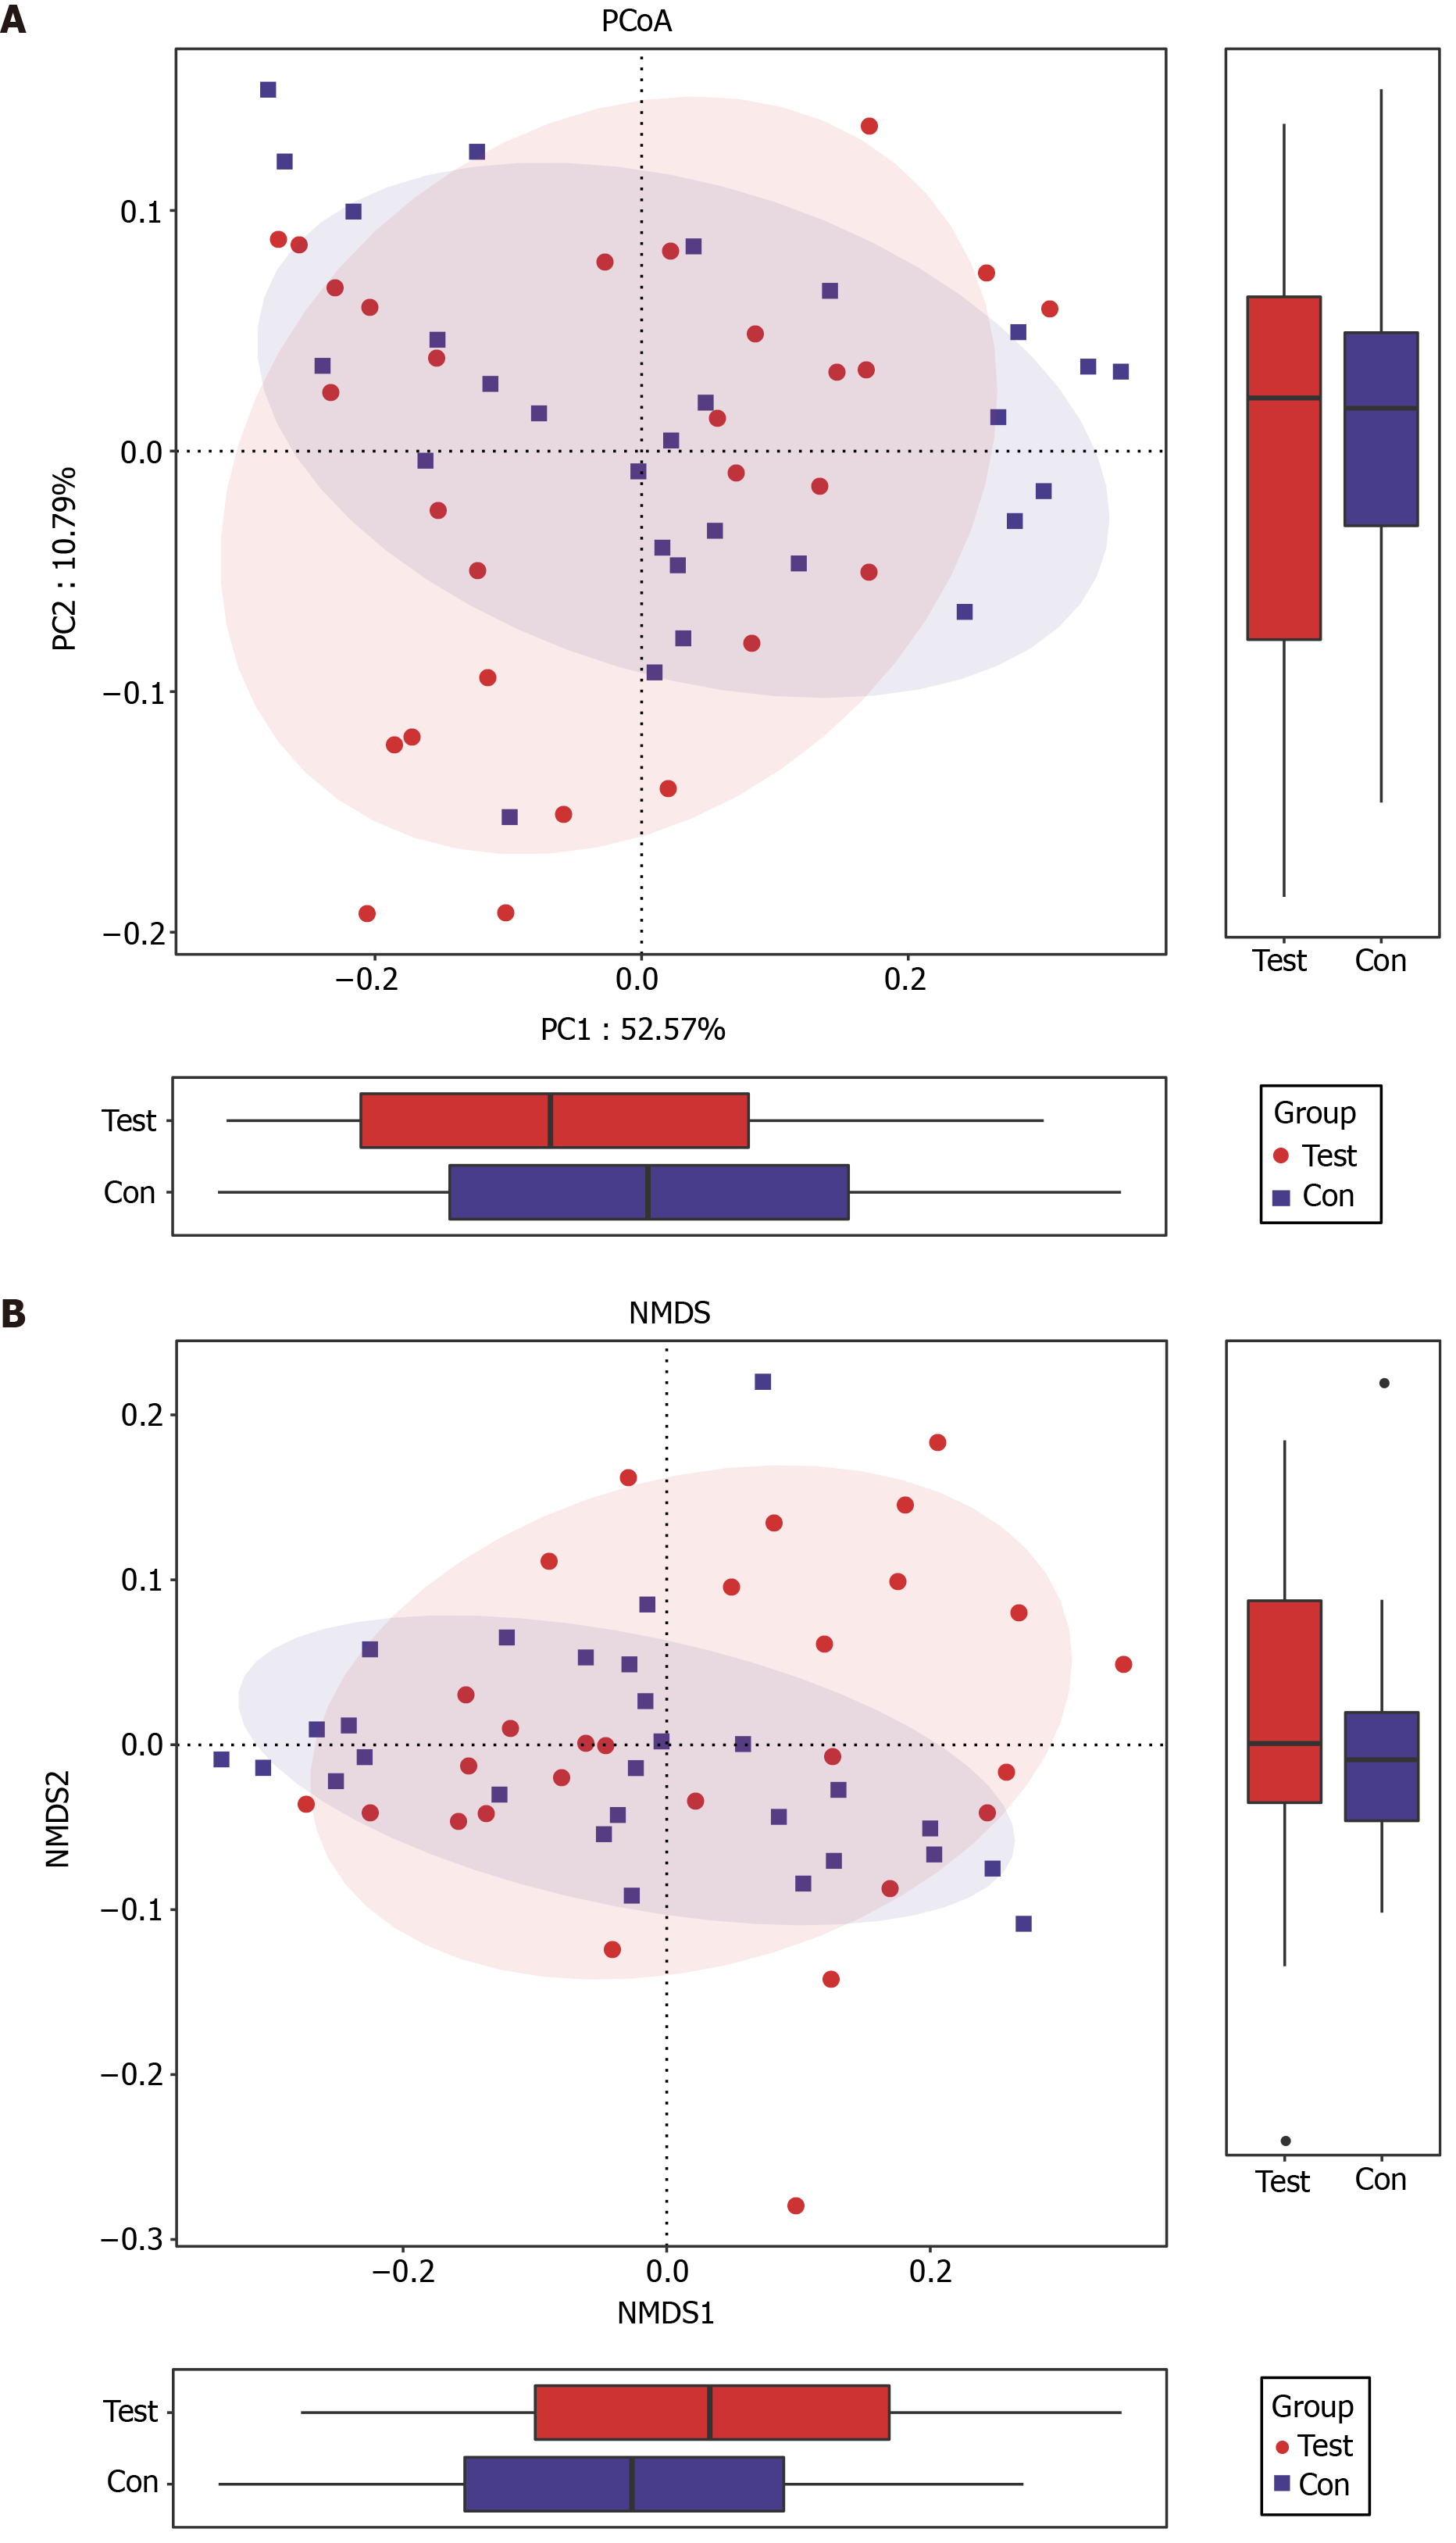
Figure 2 Examination of beta diversity using operational taxonomic units levels within the test and control groups.
A: Analysis of principal coordinates analysis plots using Weighted UniFrac distances; B: Analysis of nonmetric multidimensional scaling using Weighted UniFrac distances. One sample is represented by each symbol. PCoA: Principal coordinate analysis.
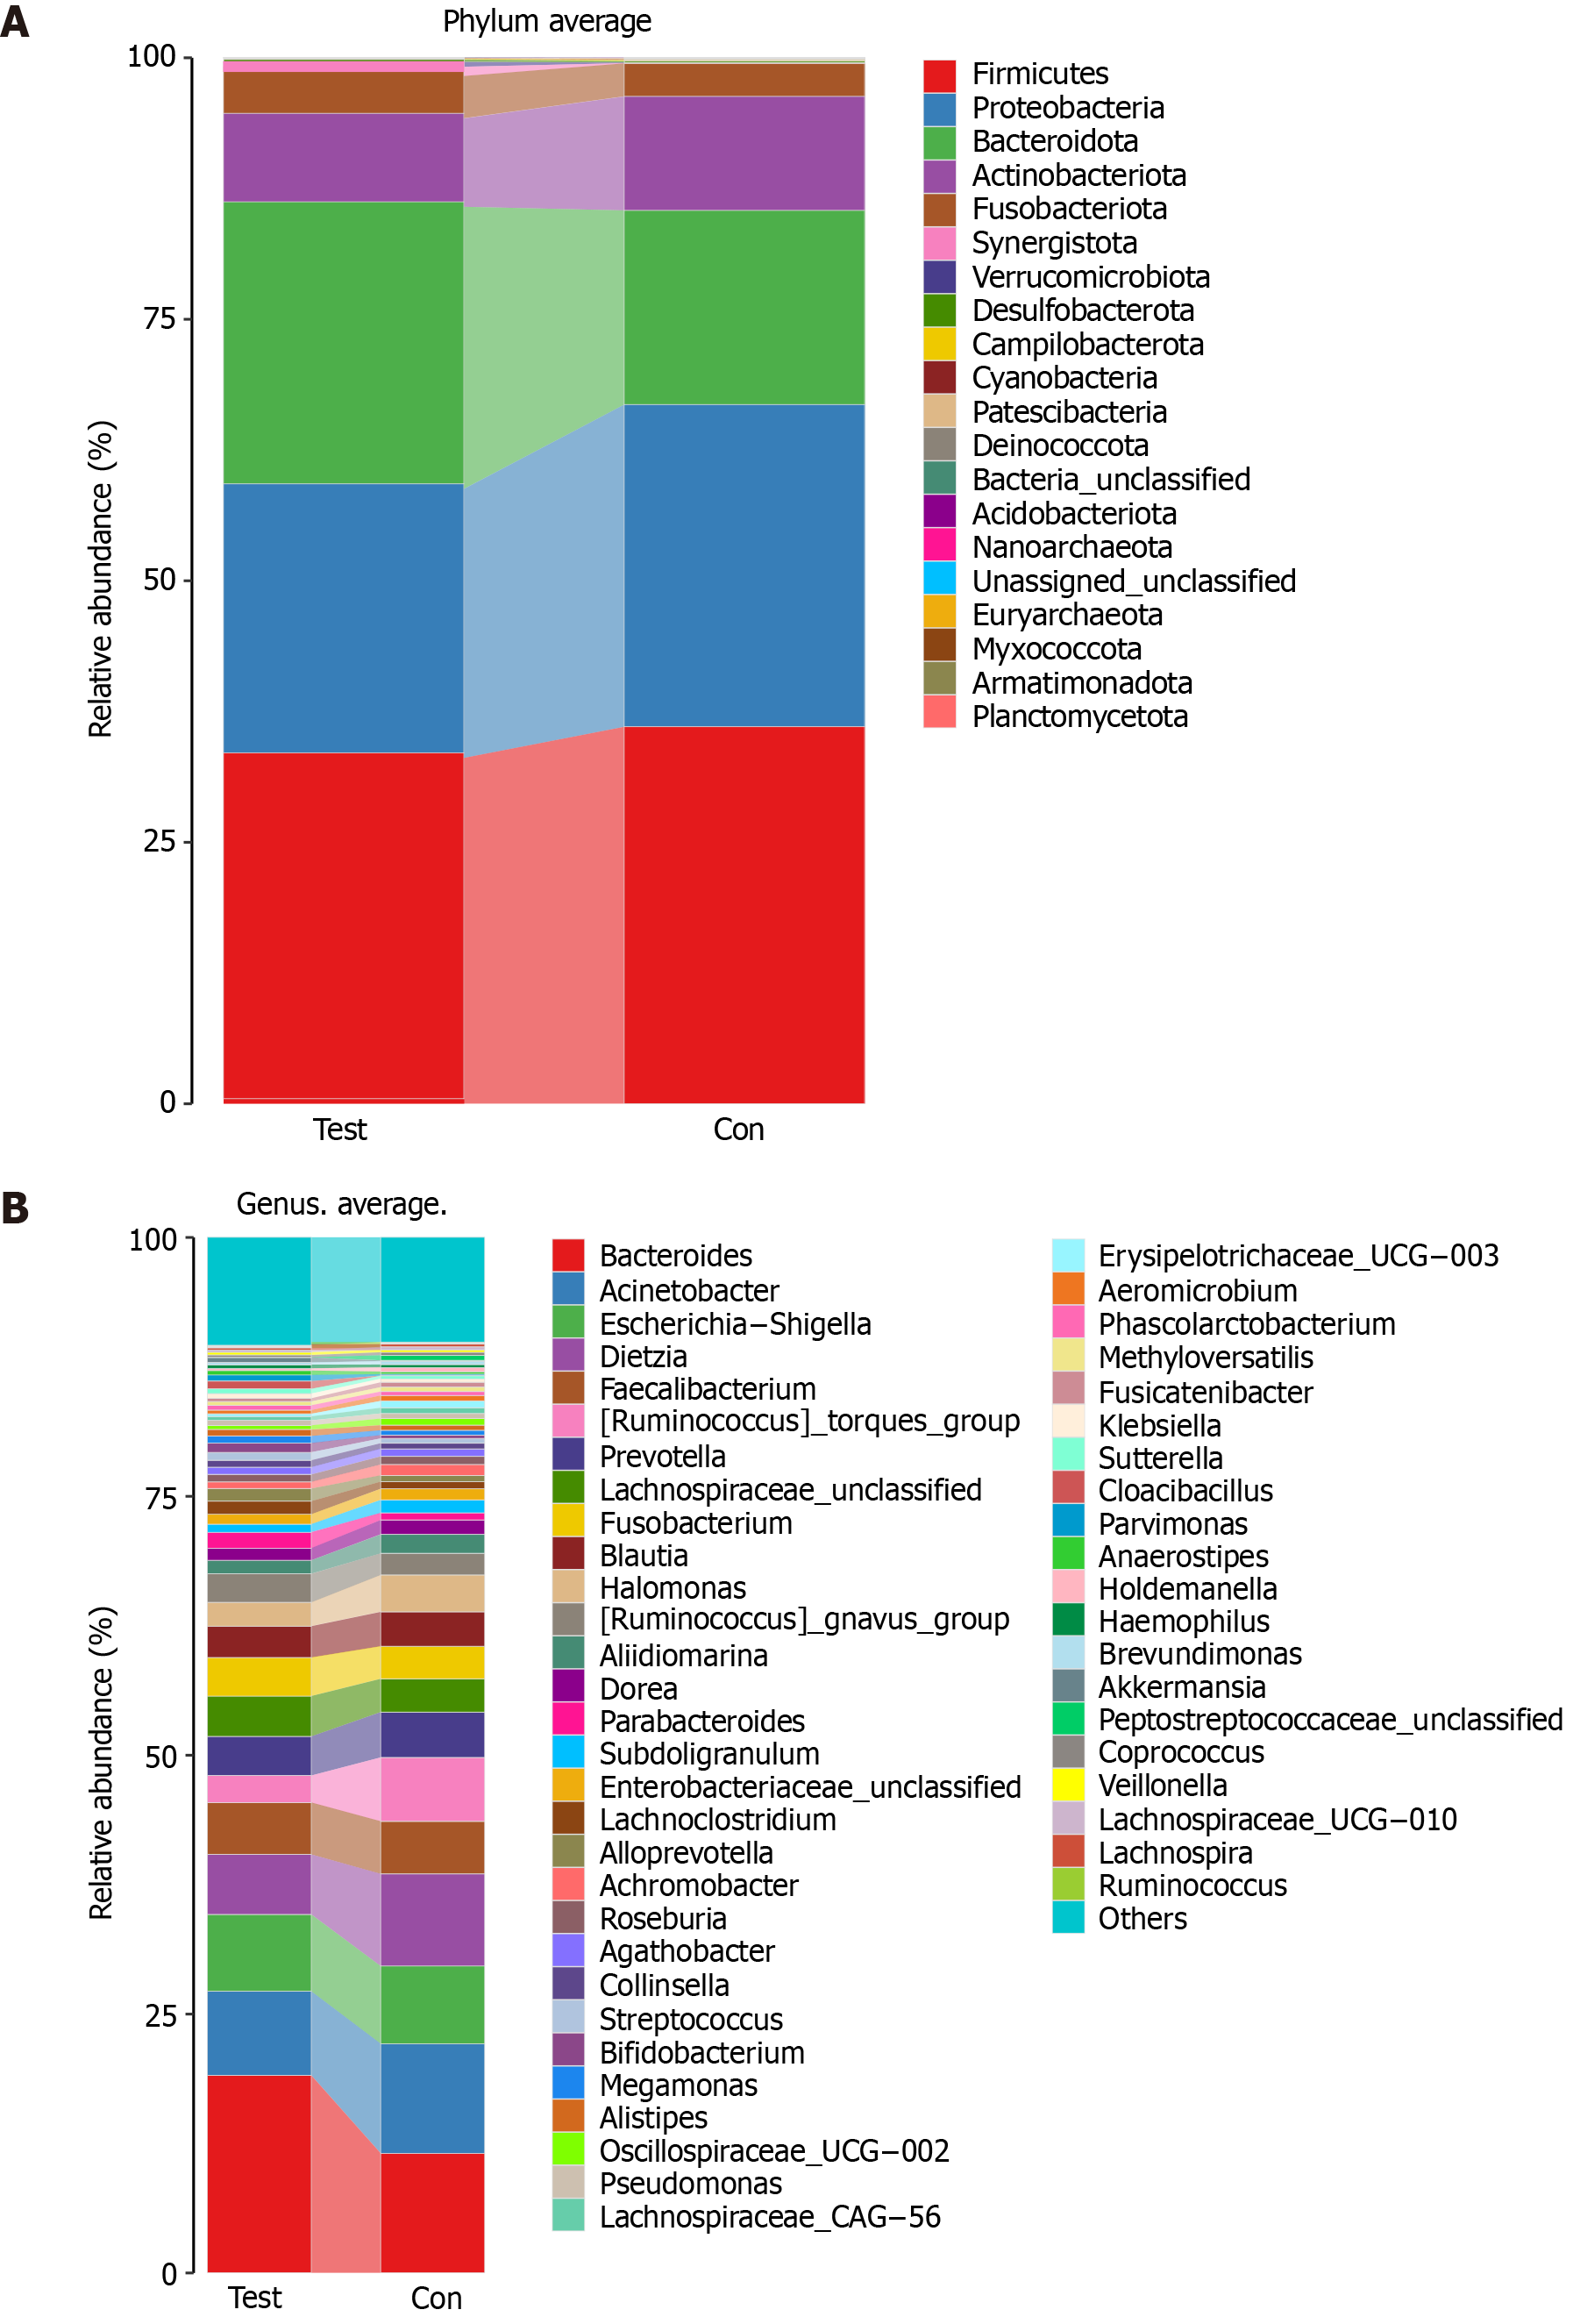
Figure 3 Microbiome floral composition in the test and control groups.
A: The composition of the flora at the phylum level; B: The composition of the flora at the genus level.
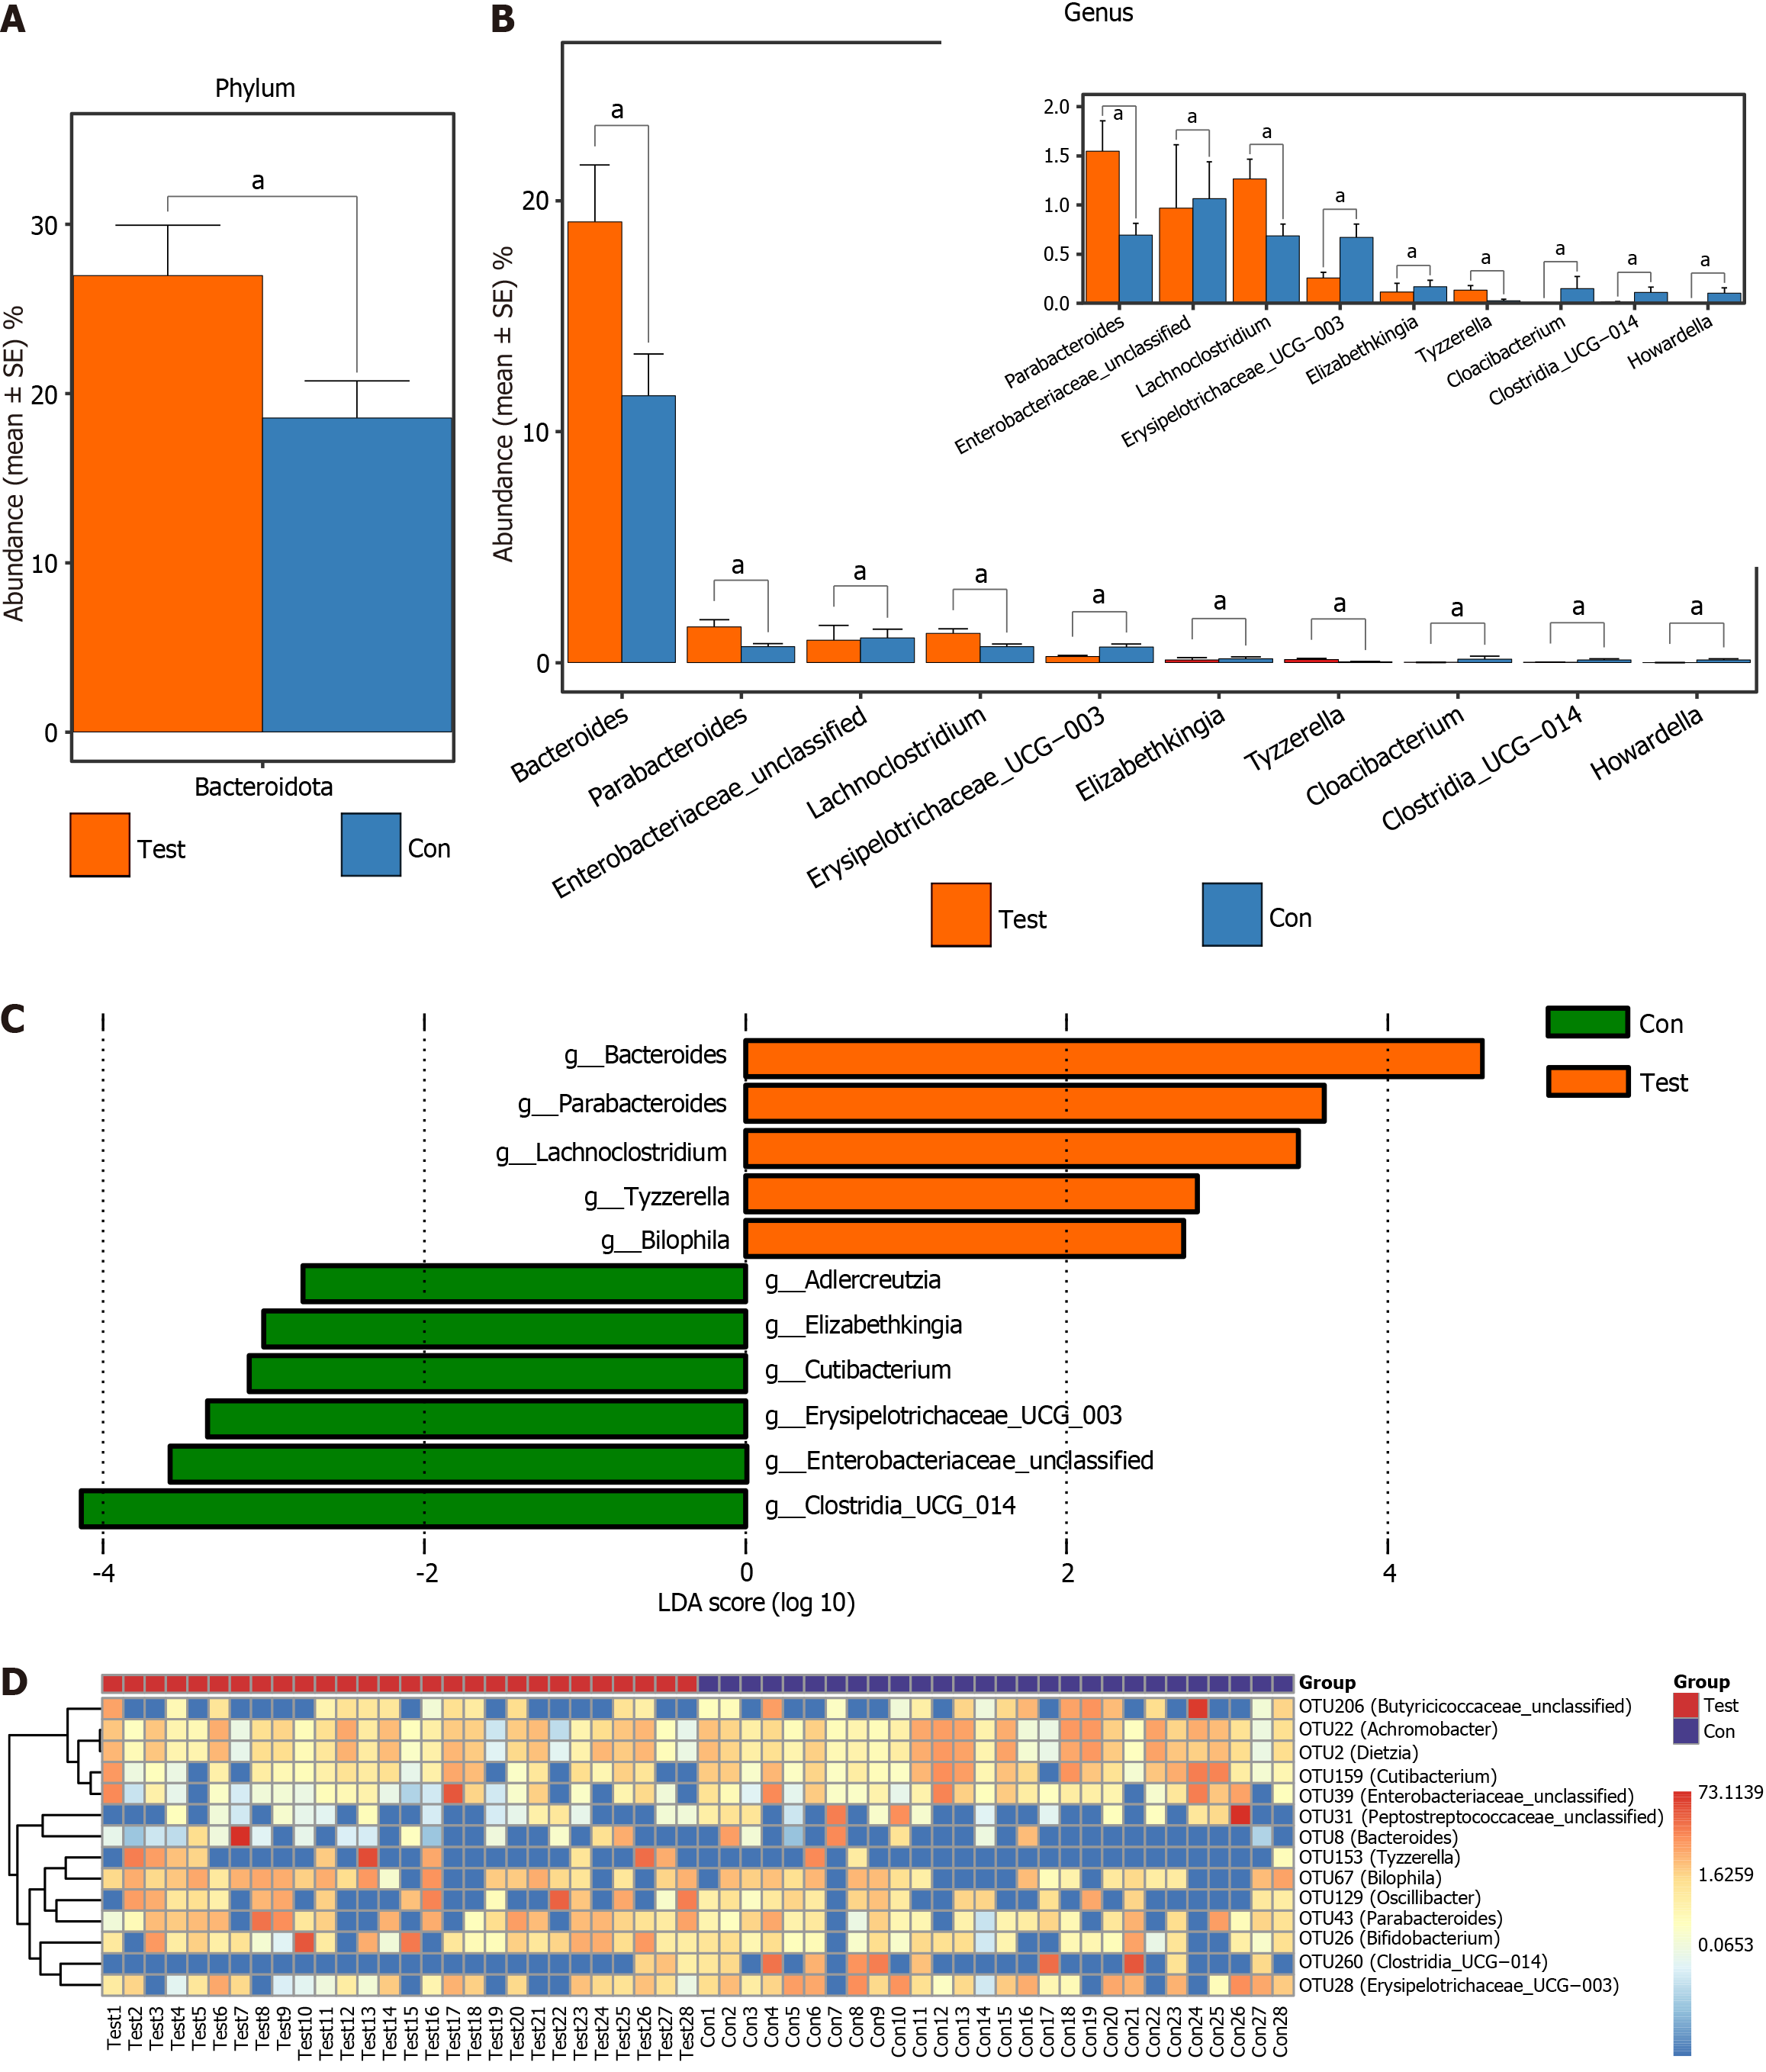
Figure 4 Differences in microbiome composition between the test and control groups.
A: The test group showed a significantly higher abundance of Bacteroidetes at the phylum level, determined by a Wilcoxon rank-sum test; B: Differences in the microbiota at the genus level between the groups, determined by a Wilcoxon rank-sum test; C: Microbiota variances at the genus level, assessed by linear discriminatory analysis effect size; D: Analysis of microbiome heatmap through a random forest model. LDA: Linear discriminatory analysis.
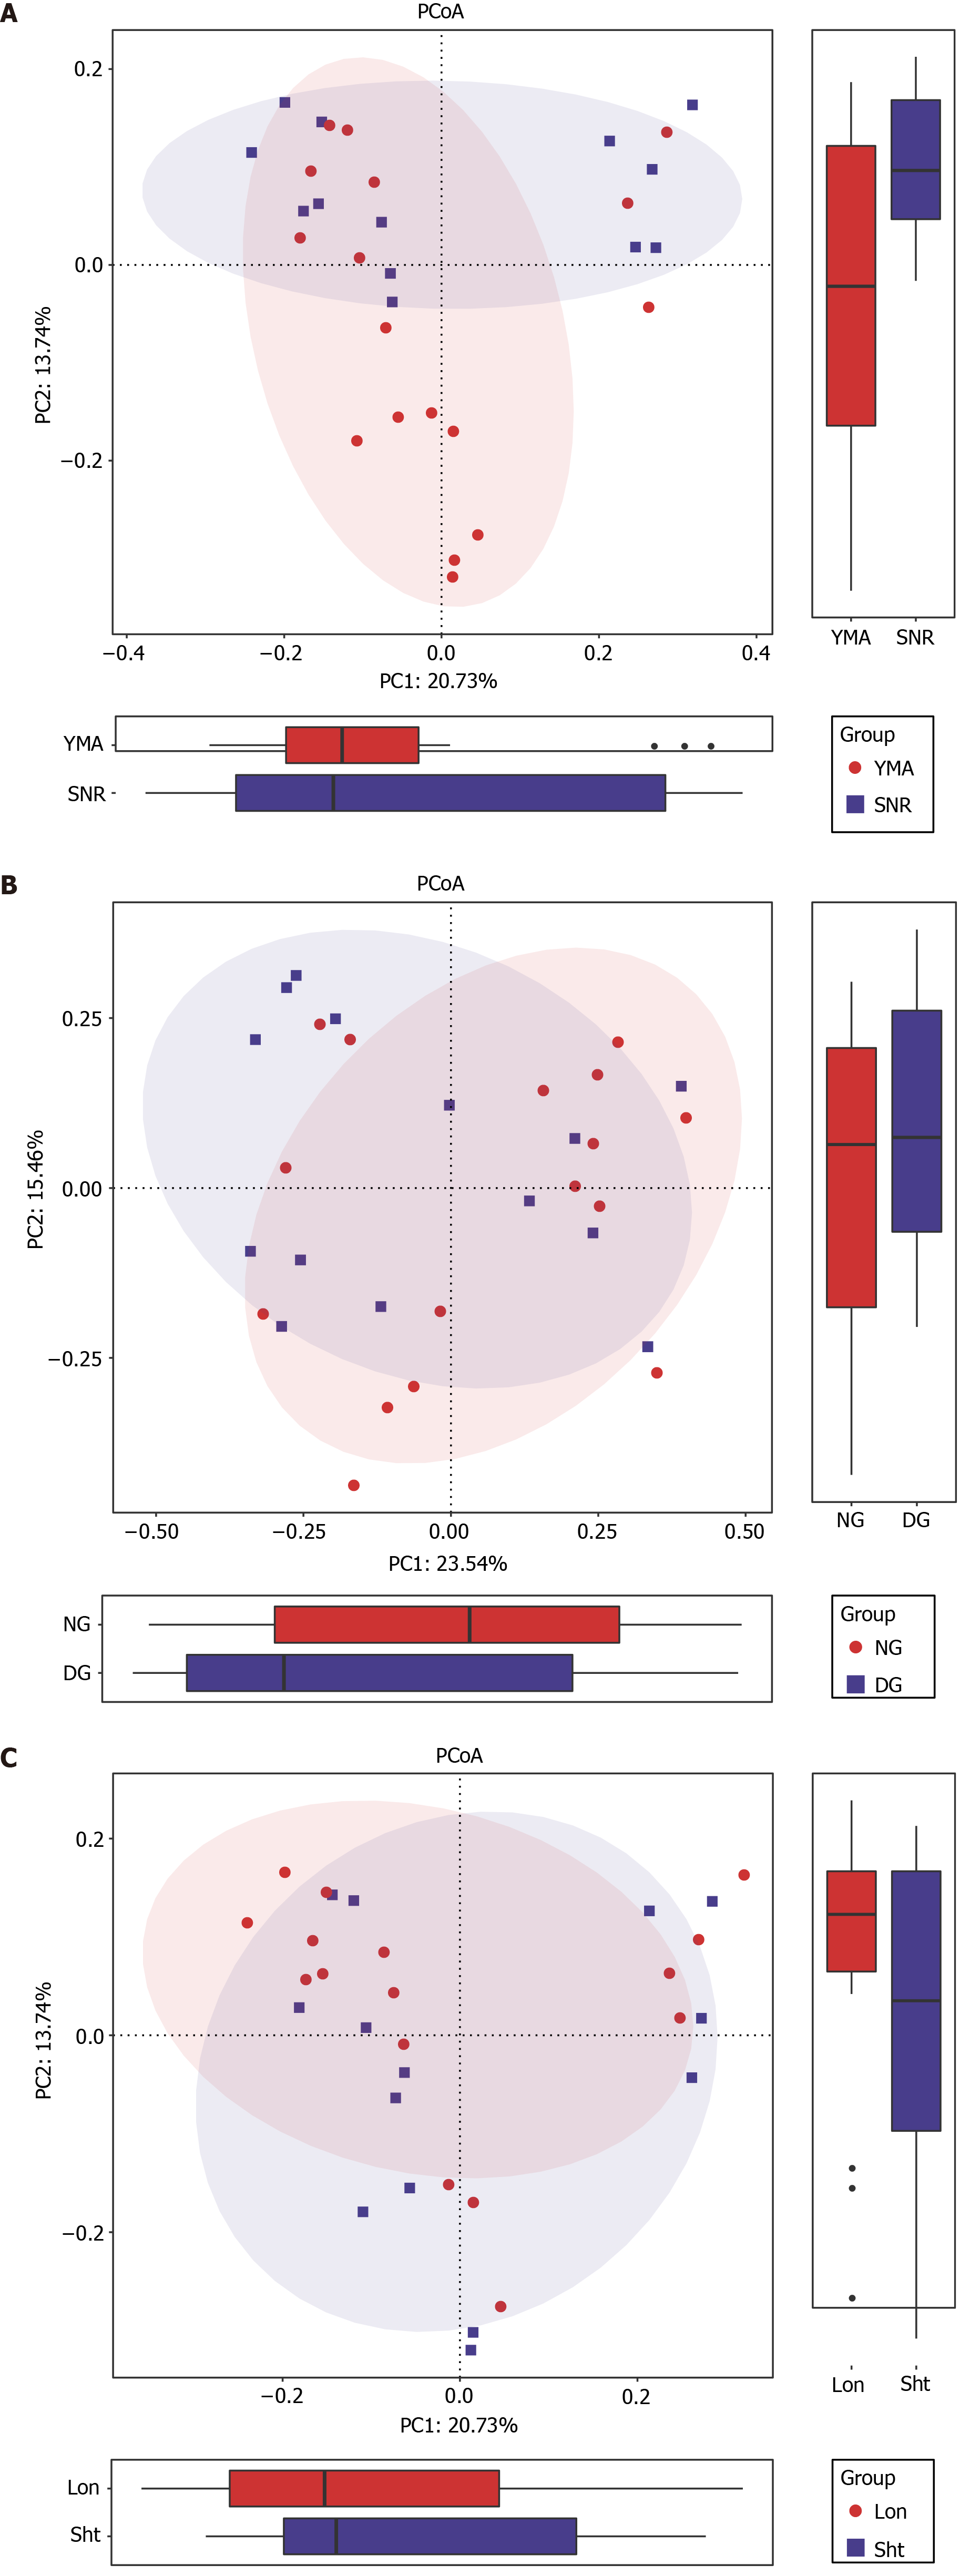
Figure 5 Examining beta diversity applying operational taxonomic units levels in subgroups.
A: Principal coordinate analysis (PCoA) plots based on Unweighted UniFrac distances of patients over 60 years and patients under 60 years groups; B: PCoA plots based on Bray-Curtis distances of patients had diarrhea and patients without diarrhea groups; C: PCoA plots based on Unweighted Unifrac distances of post-operative patients over 5 years and post-operative patients less than 5 years groups. YMA: Patients over 60 years; SNR: Patients under 60 years; DG: Patients had diarrhea; NG: Patients without diarrhea; Lon: Post-operative patients over 5 years; Sht: Post-operative patients less than 5 years; PCoA: Principal coordinate analysis.
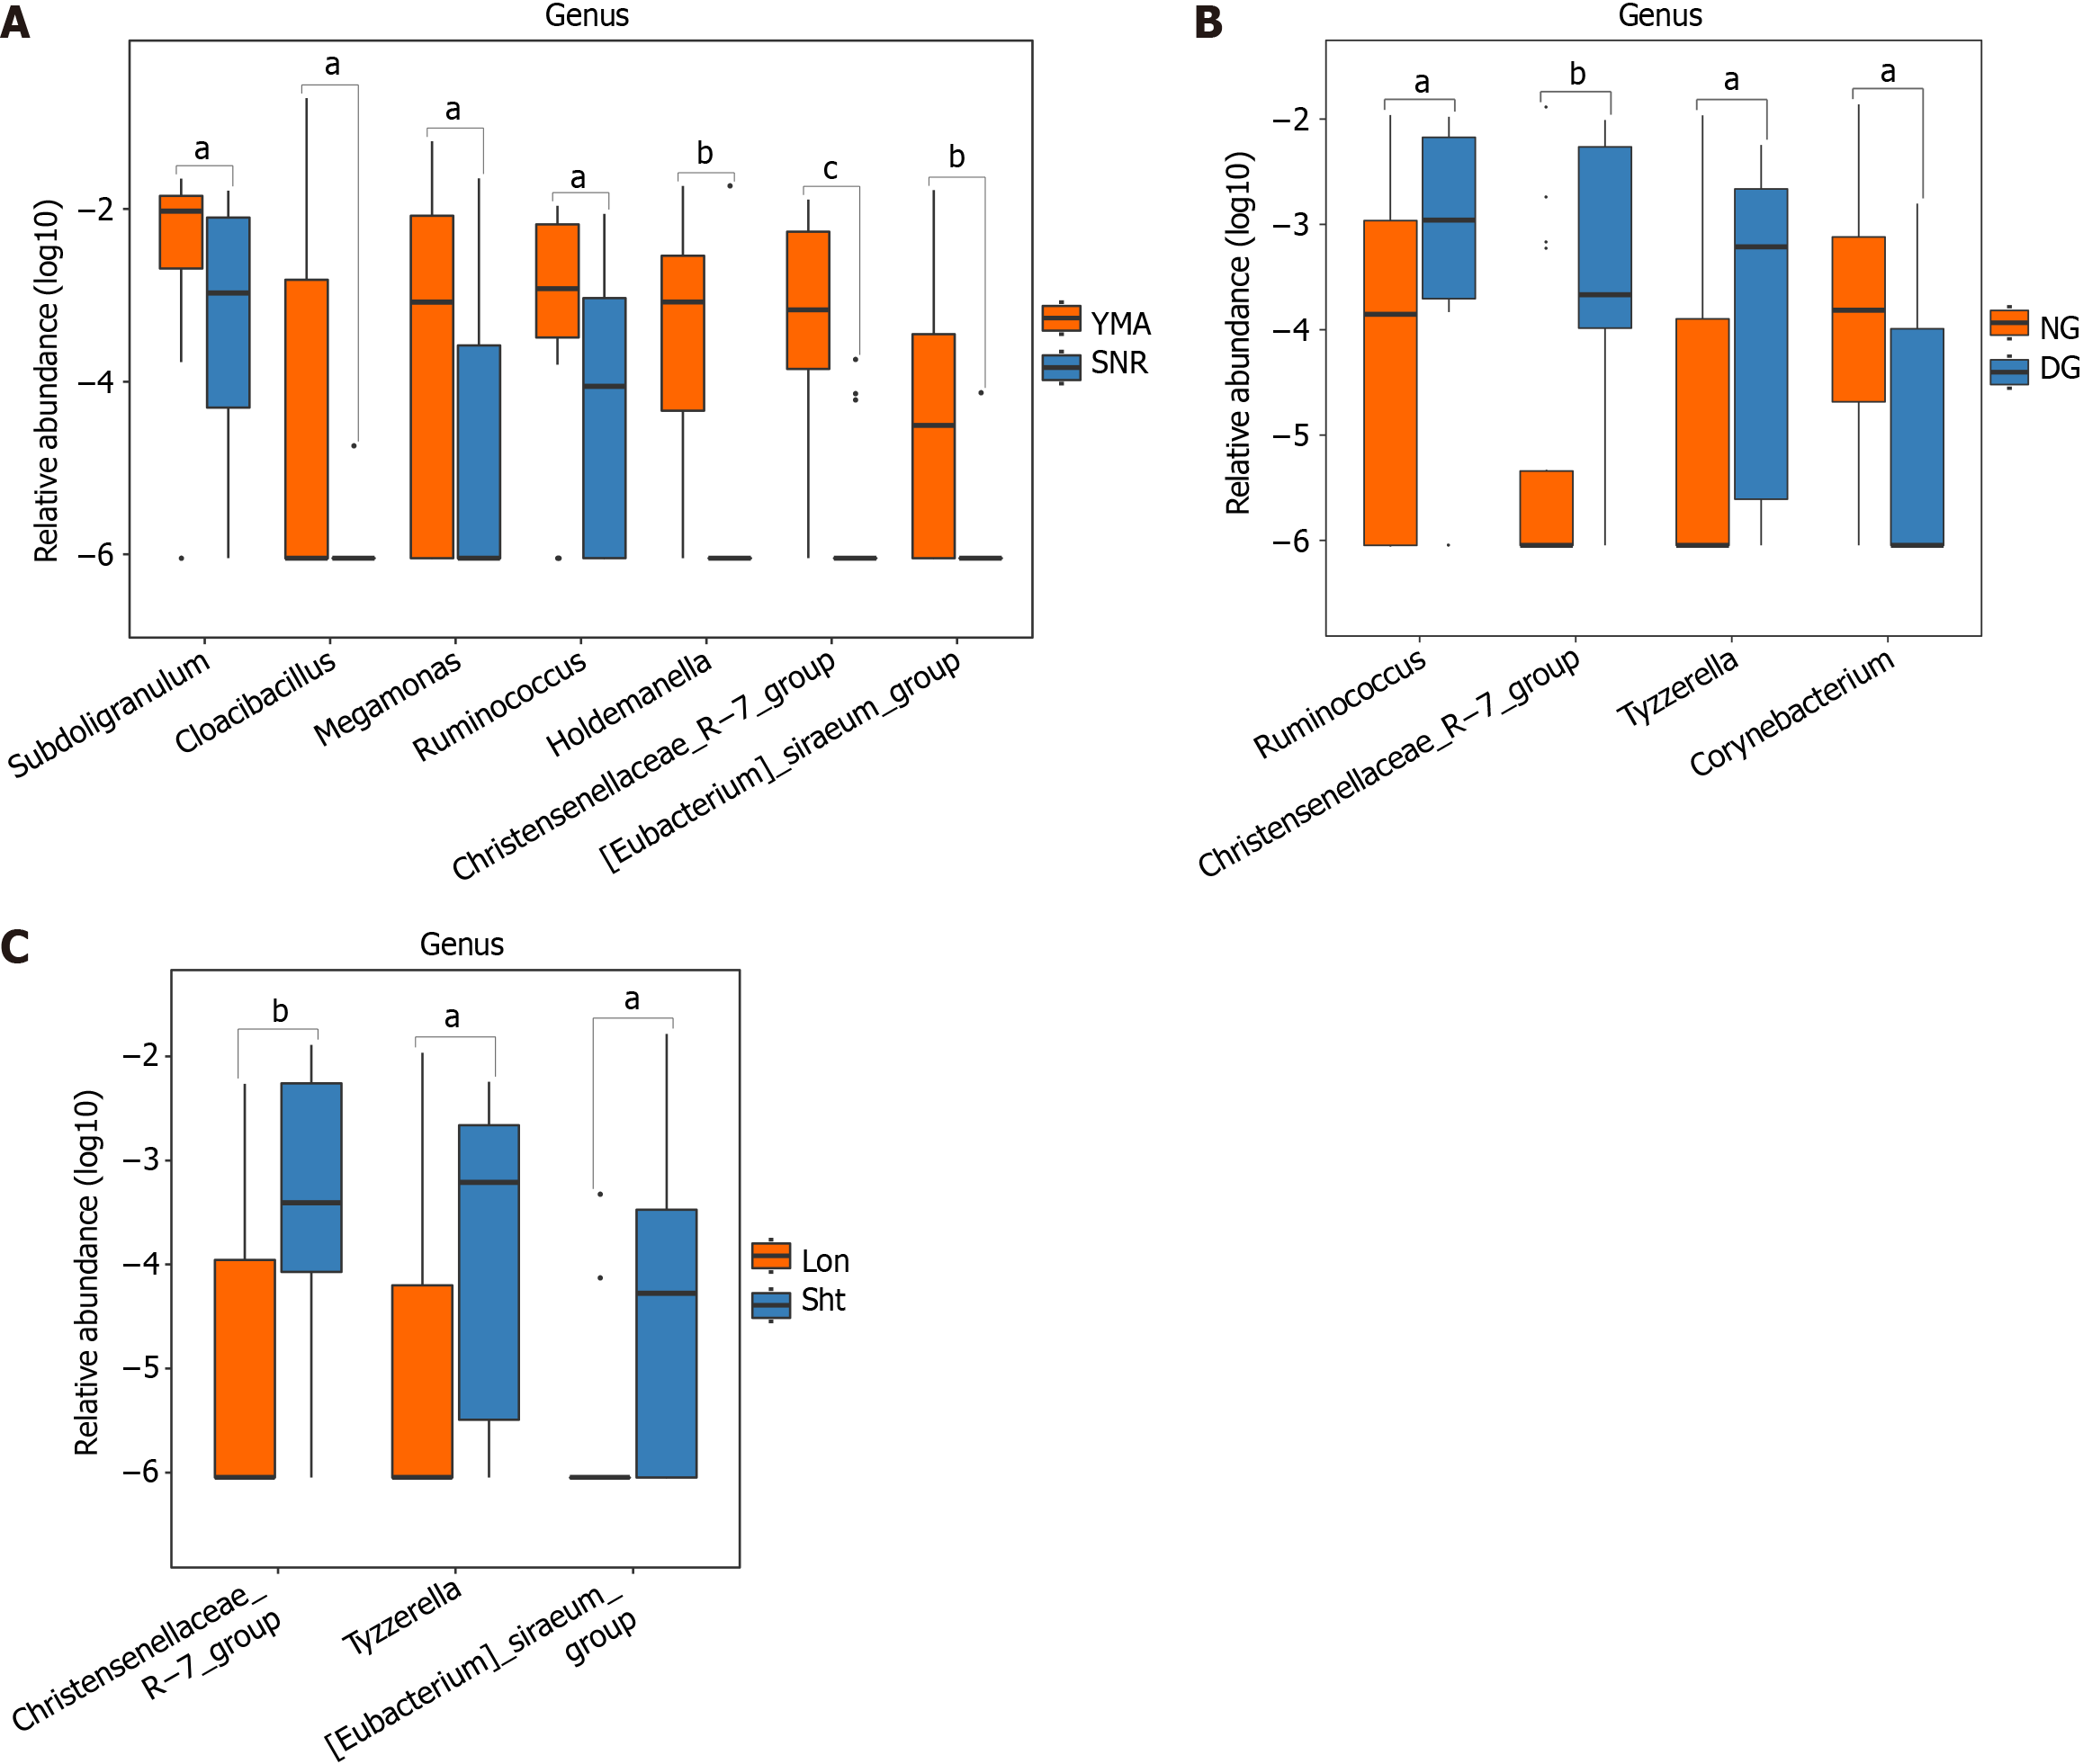
Figure 6 Microbiome composition variations in microflora among subgroups were evaluated at the genus level using the Wilcoxon rank-sum test.
A: Variations in genus-level microflora between the patients over 60 years and patients under 60 years populations; B: Variations in genus-level microflora between the patients had diarrhea (DG) and patients without diarrhea (NG) groups; C: Variations in genus-level microflora between the DG and NG groups. YMA: Patients over 60 years; SNR: Patients under 60 years; DG: Patient had diarrhea; NG: Patients without diarrhea; Lon: Post-operative patients over 5 years; Sht: Post-operative patients less than 5 years.
Figure 7 Changes in metabolic pathways between the test and control groups, as illustrated by the histogram of linear discriminatory analysis scores.
LDA: Linear discriminatory analysis.
- Citation: Fan MY, Jiang QL, Cui MY, Zhao MQ, Wang JJ, Lu YY. Alteration of ascending colon mucosal microbiota in patients after cholecystectomy. World J Gastrointest Surg 2024; 16(8): 2436-2450
- URL: https://www.wjgnet.com/1948-9366/full/v16/i8/2436.htm
- DOI: https://dx.doi.org/10.4240/wjgs.v16.i8.2436


