Copyright
©The Author(s) 2024.
World J Gastrointest Surg. Nov 27, 2024; 16(11): 3499-3510
Published online Nov 27, 2024. doi: 10.4240/wjgs.v16.i11.3499
Published online Nov 27, 2024. doi: 10.4240/wjgs.v16.i11.3499
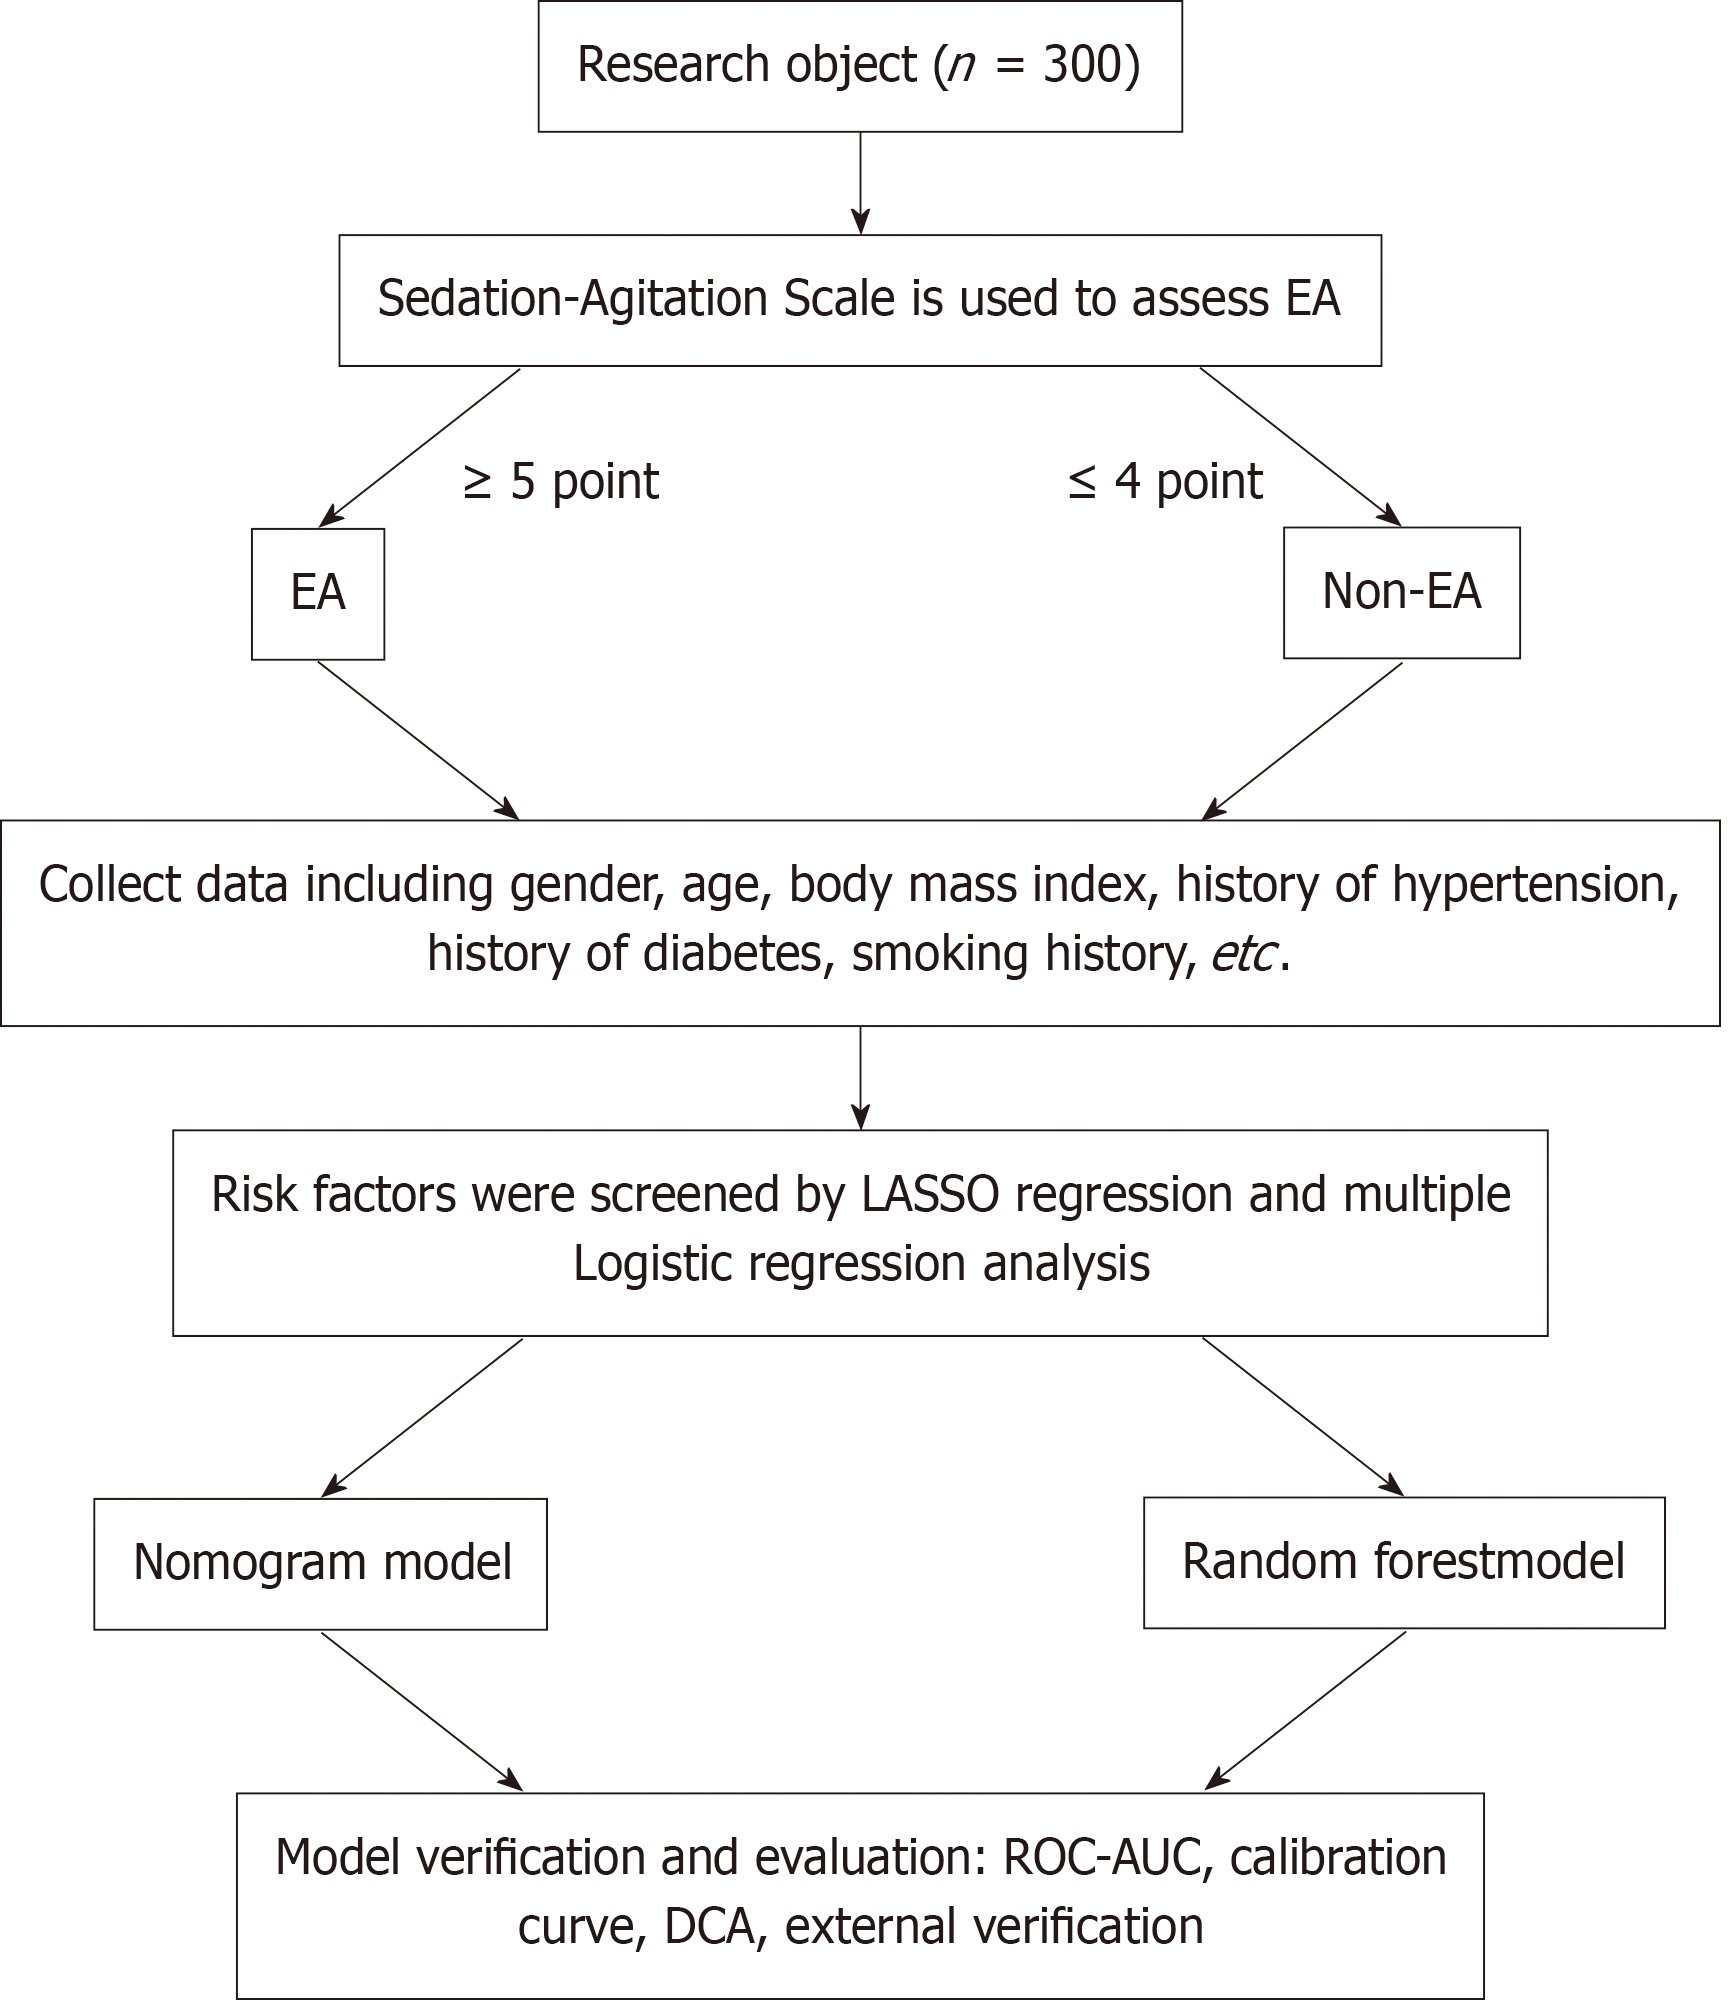
Figure 1 Research process.
EA: Emergence agitation; LASSO: Least absolute shrinkage and selection operator; ROC: Receiver operating characteristic; AUC: Area under the receiver operating characteristic curve; DCA: Direct coupling analysis.
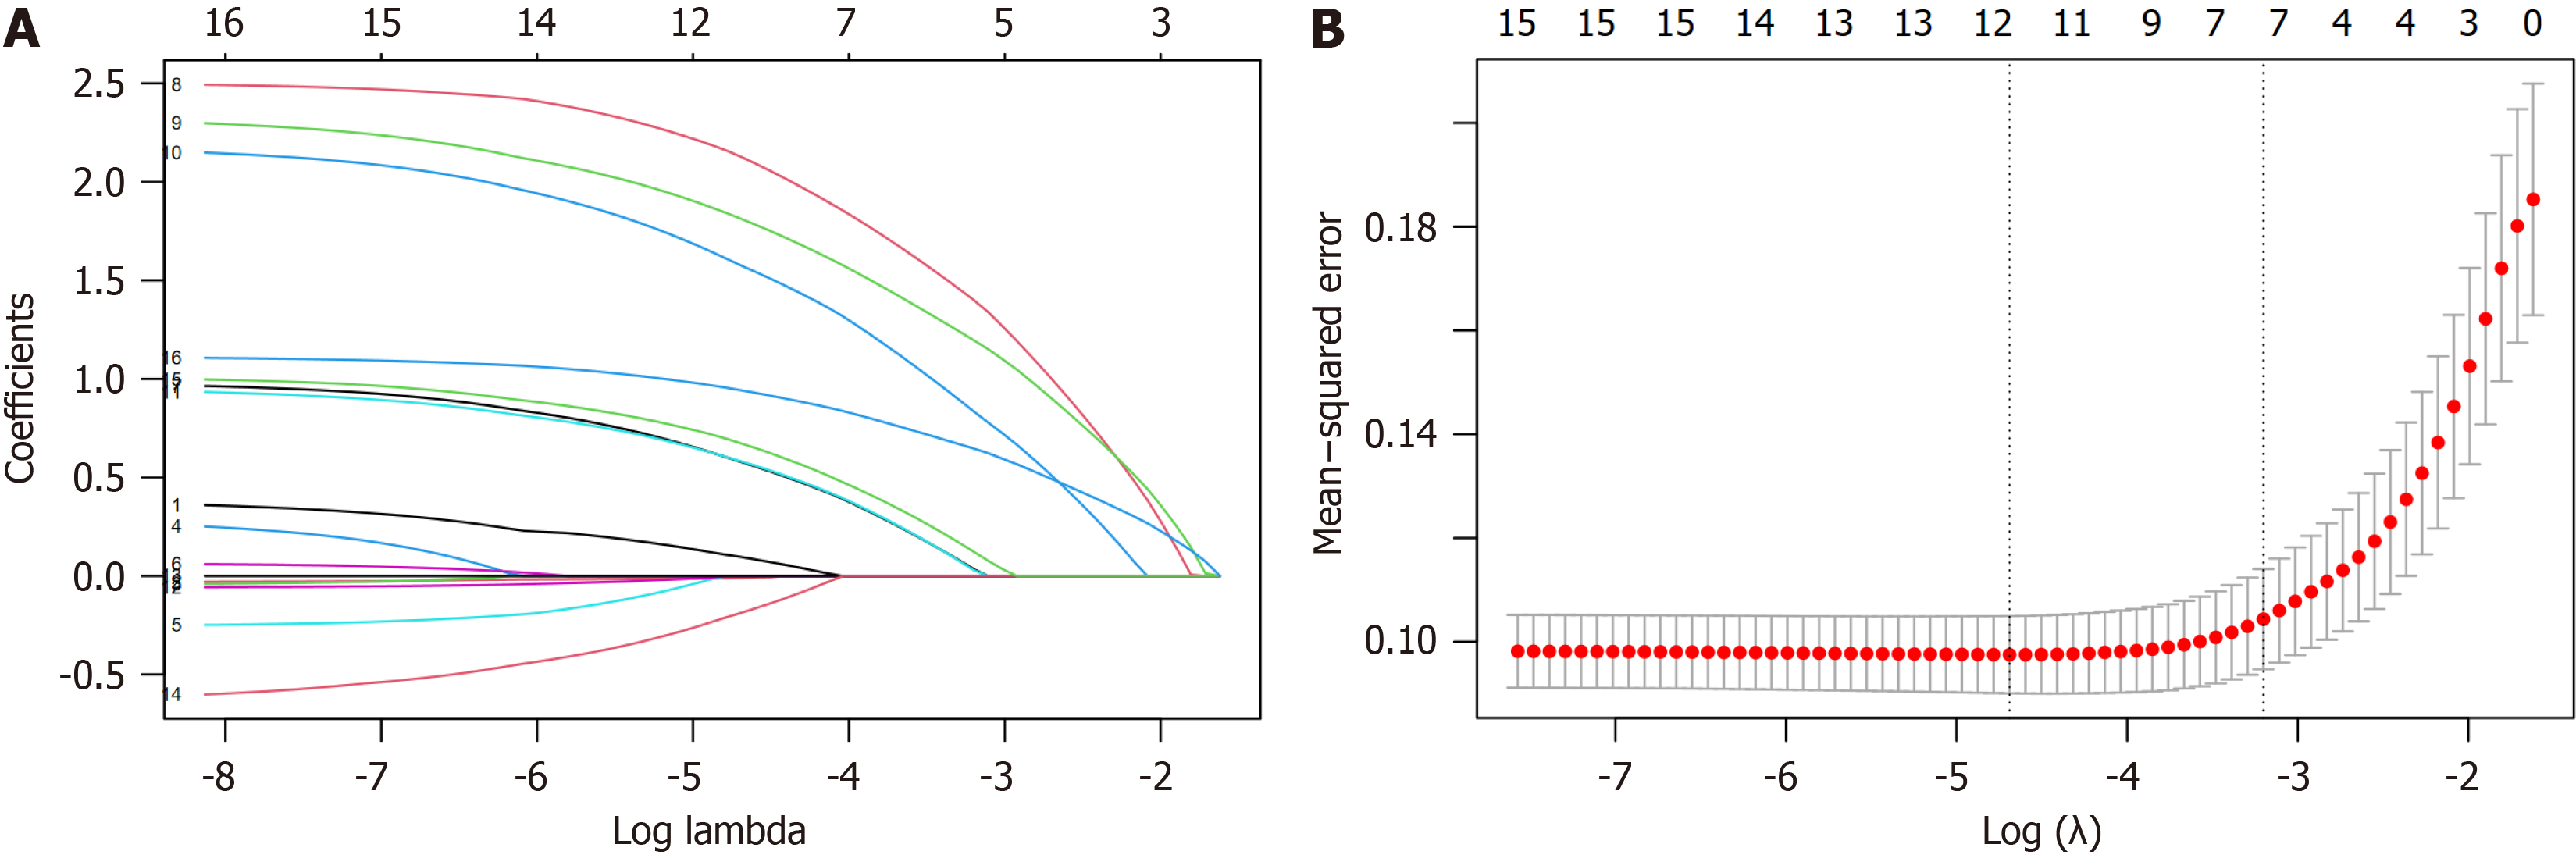
Figure 2 Least absolute shrinkage and selection operator regression and cross-validation curve.
A: Least absolute shrinkage and selection operator regression; B: Cross-validation curve.
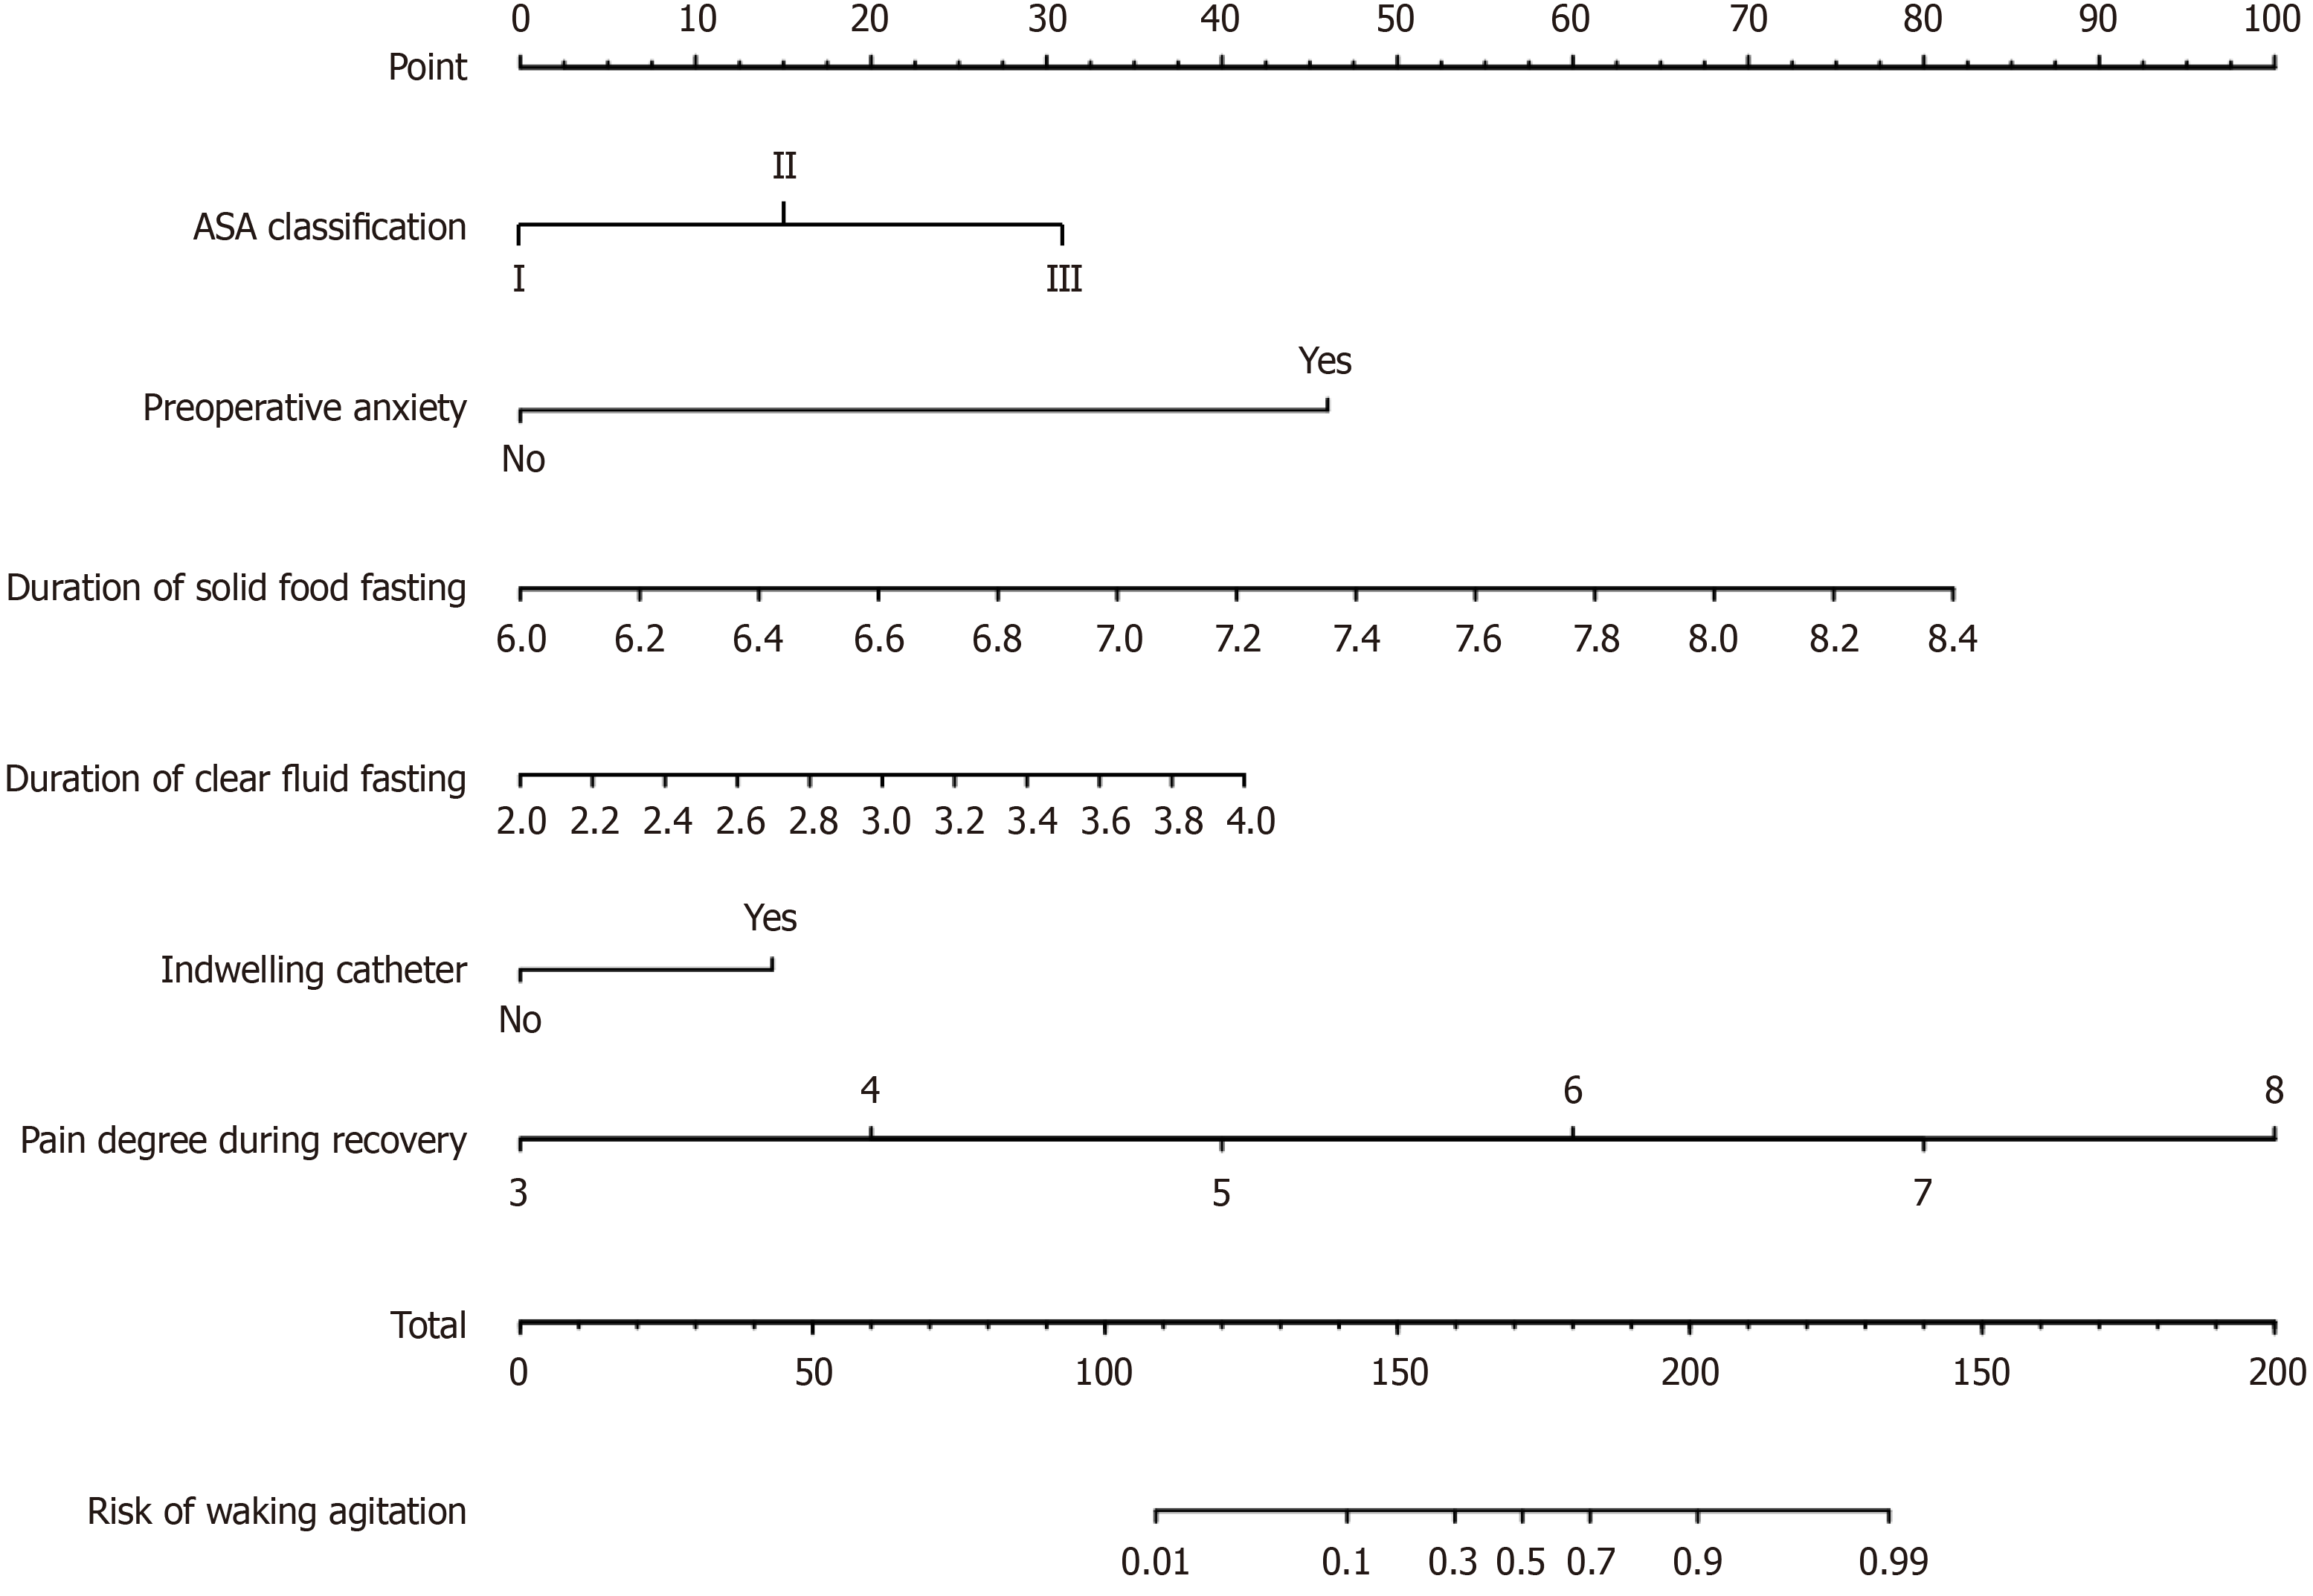
Figure 3 Column chart prediction model.
ASA: American Society of Anesthesiologists.
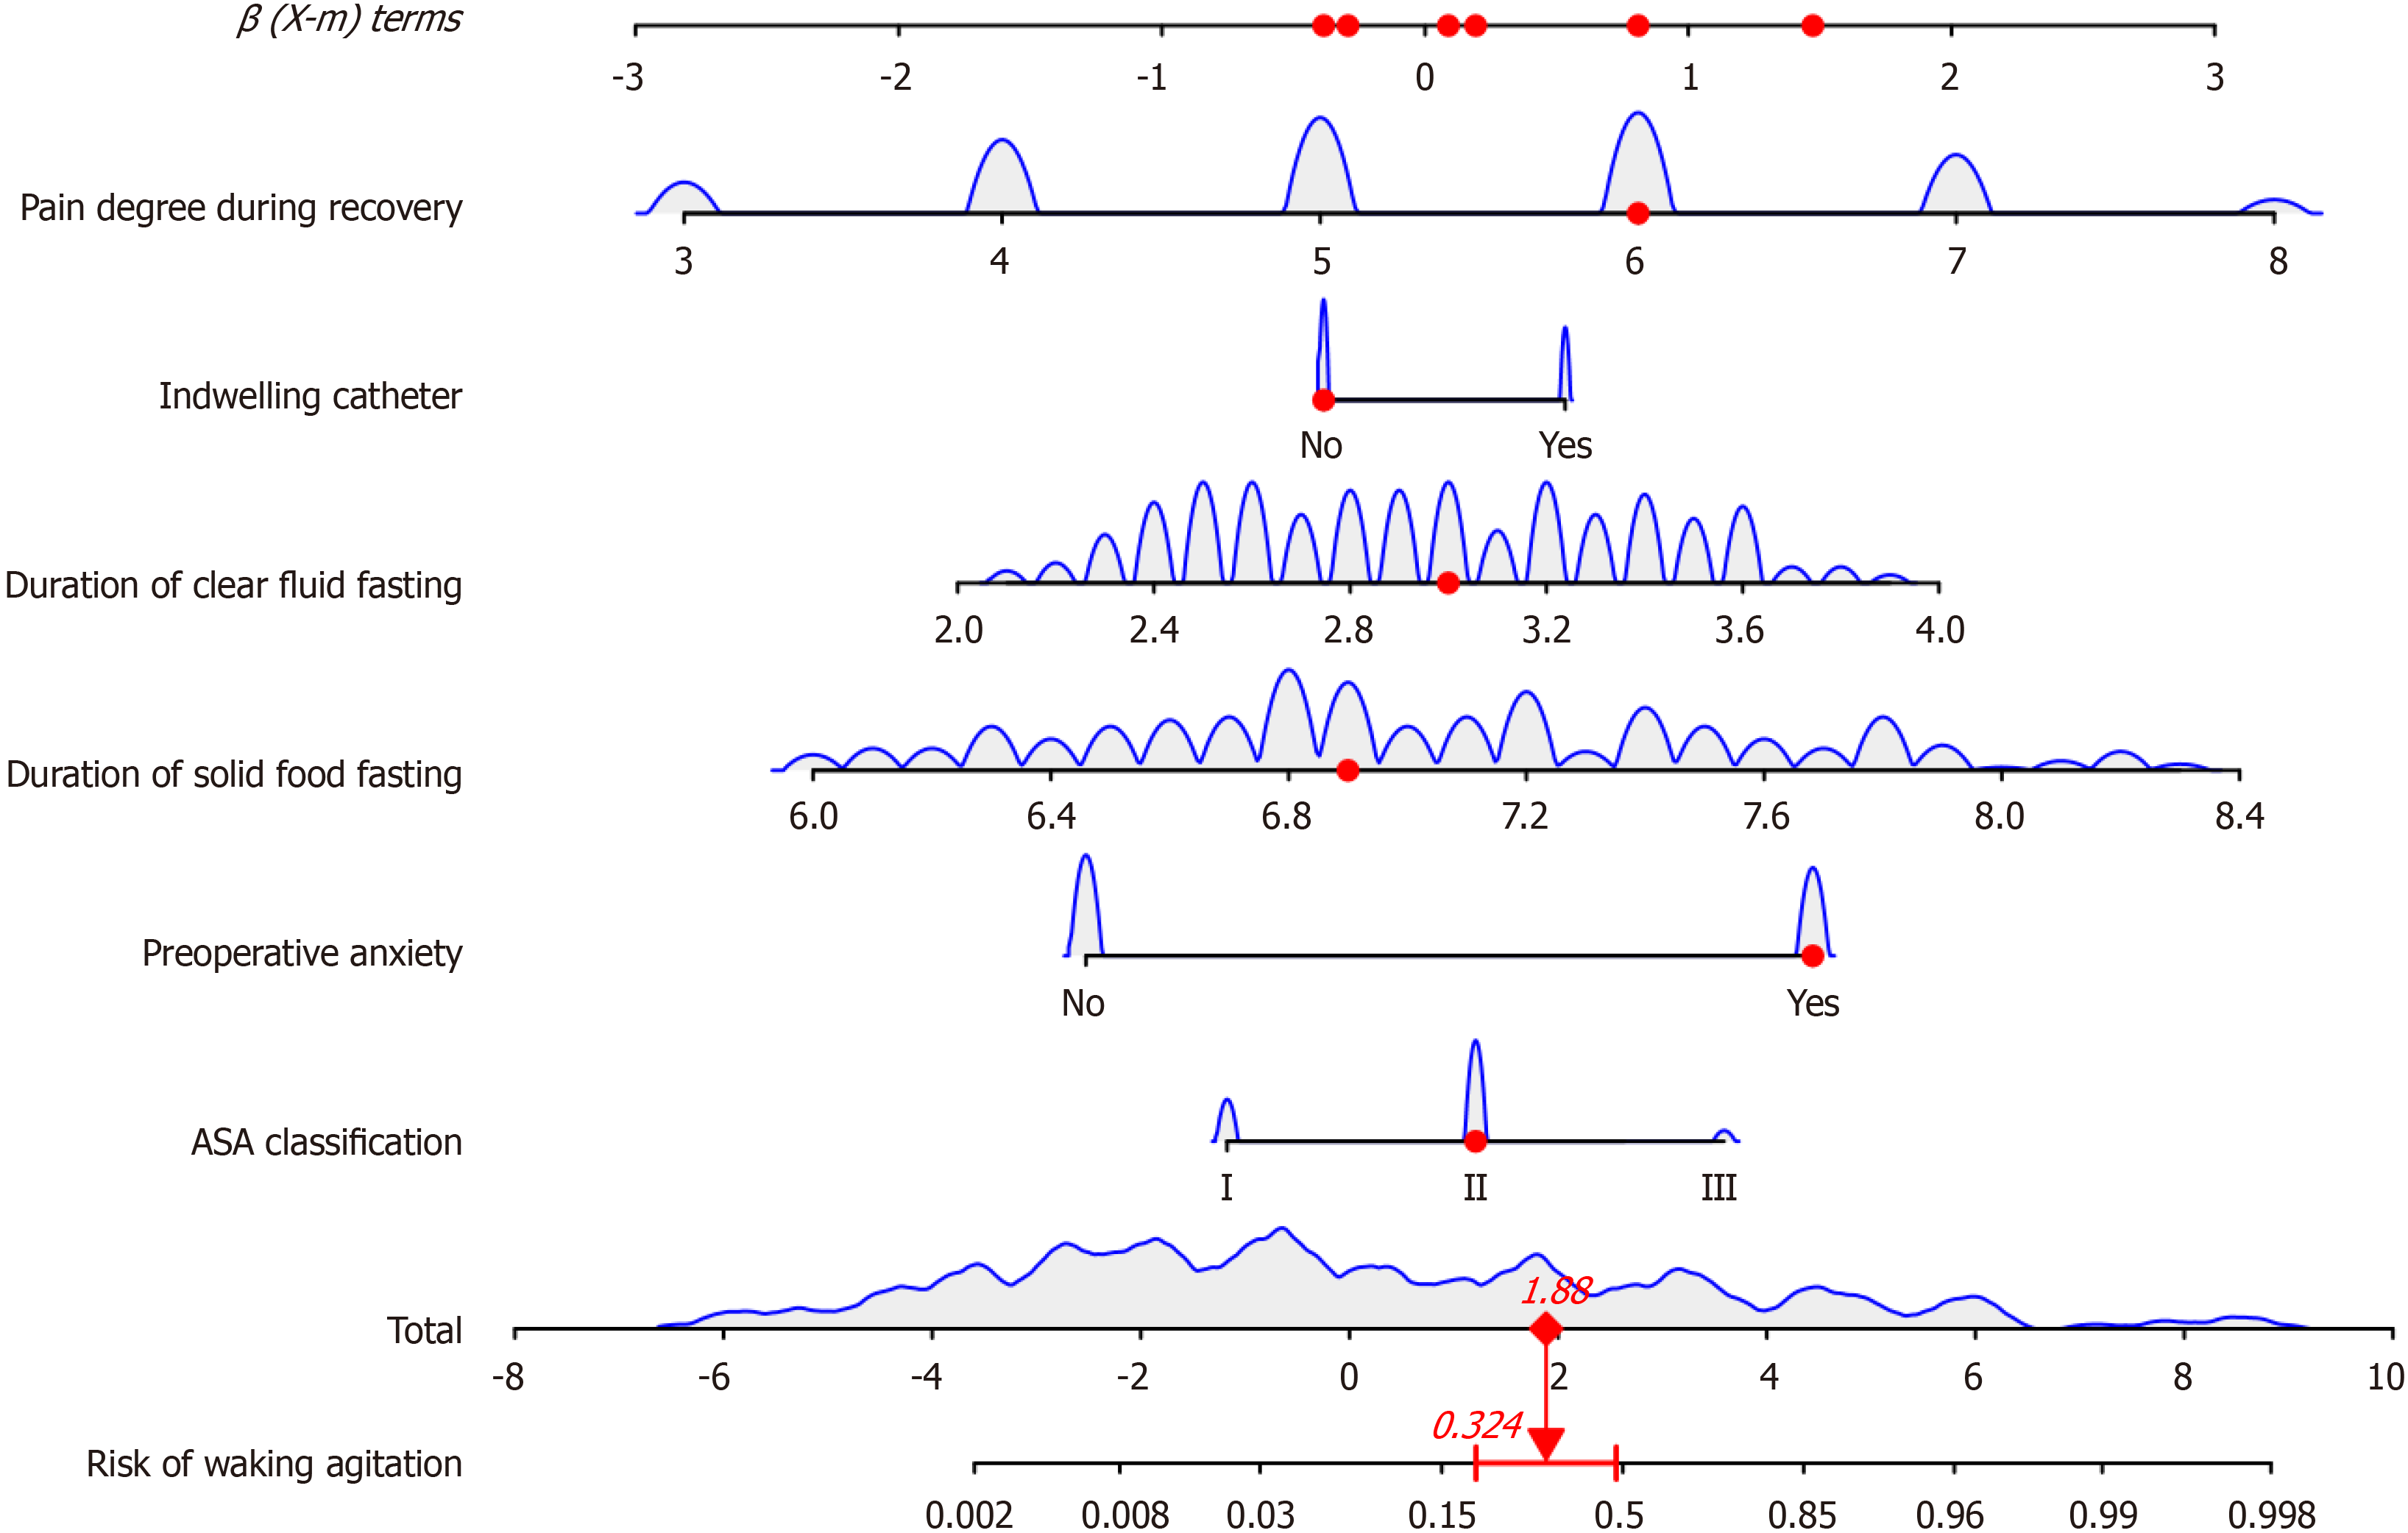
Figure 4 The example’s nomogram.
ASA: American Society of Anesthesiologists.
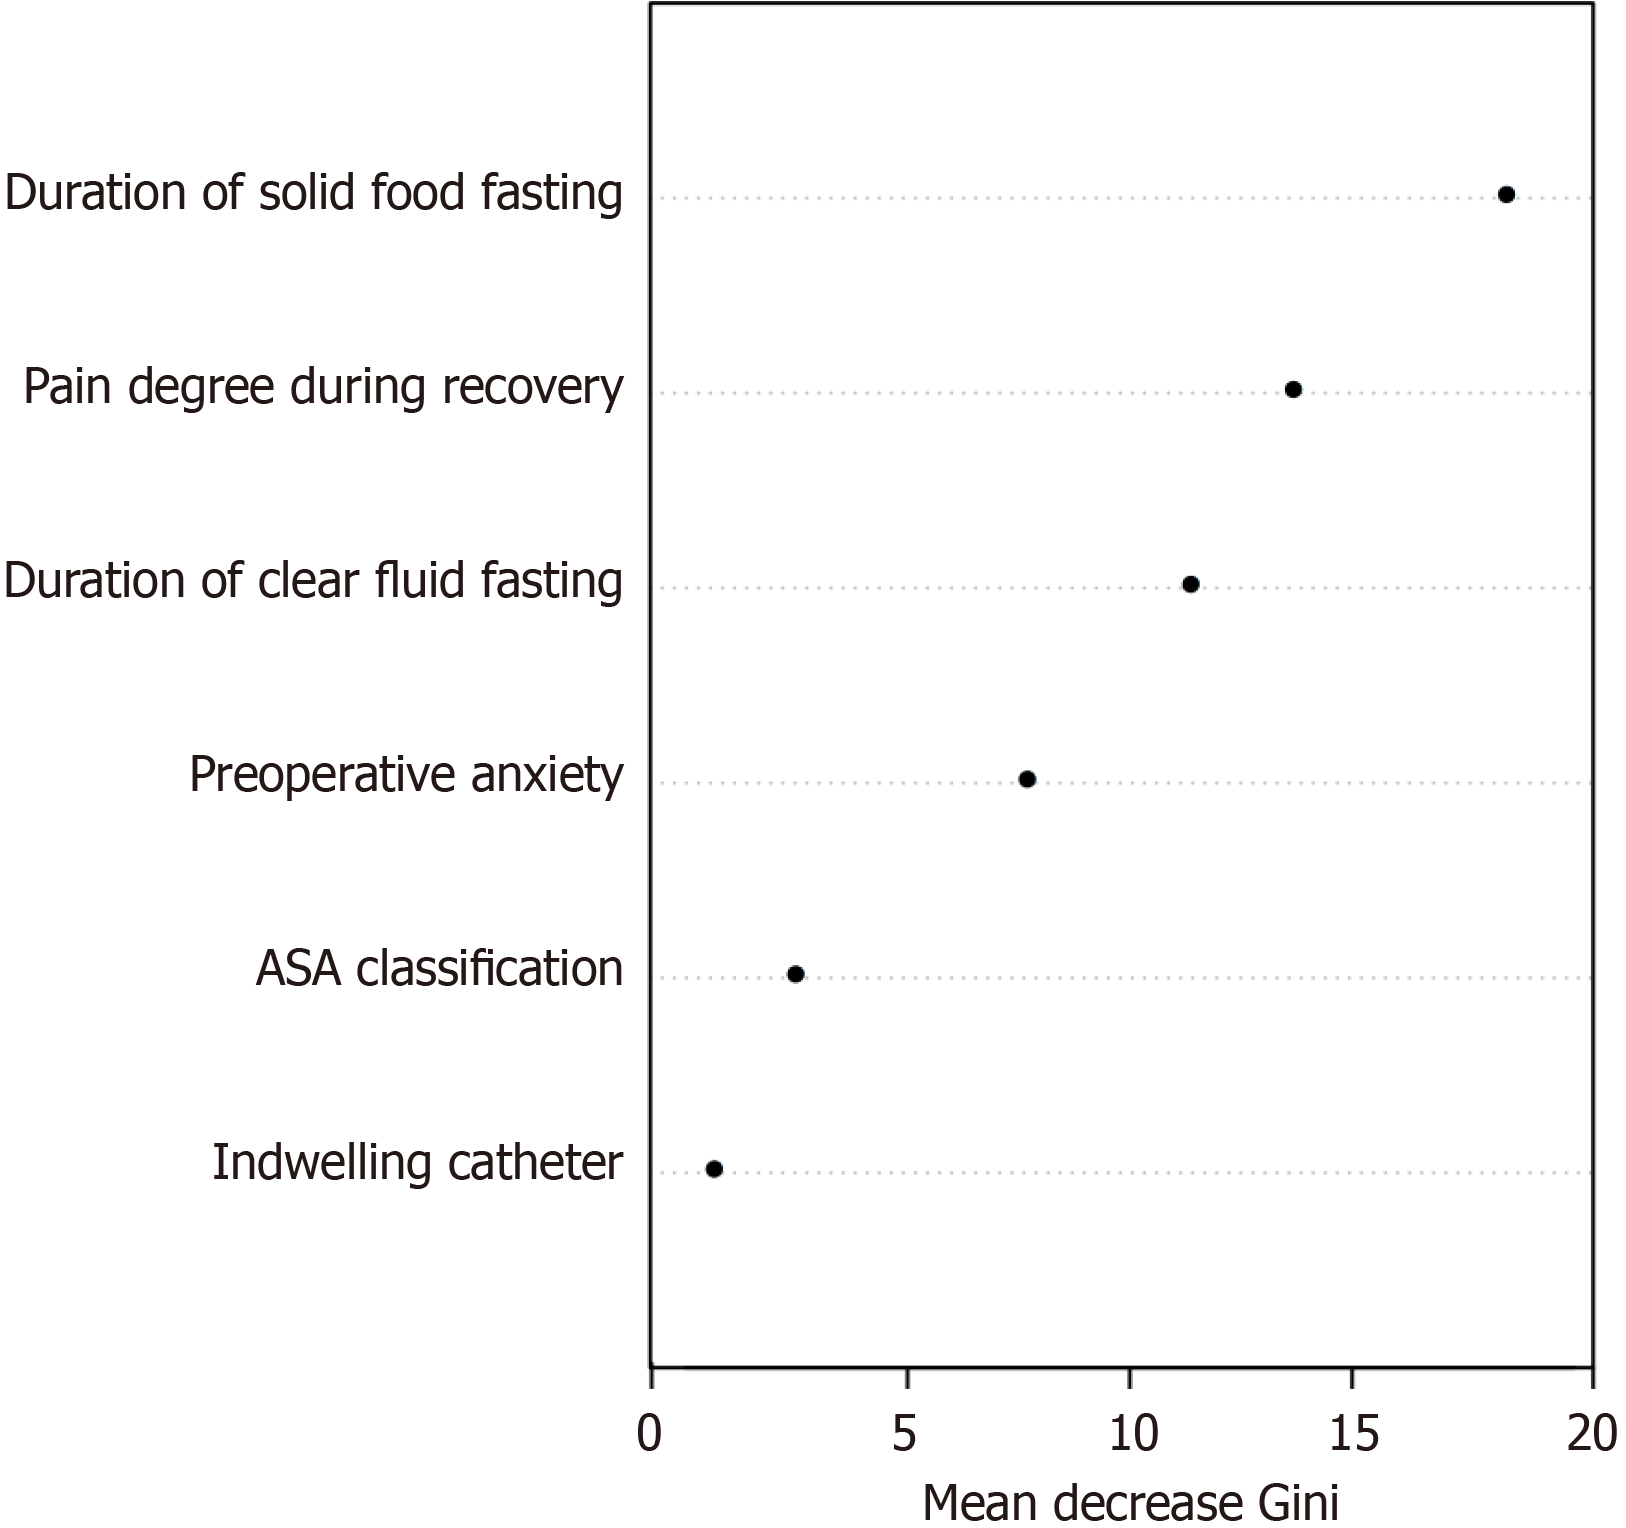
Figure 5 Importance of predictive variables affecting.
ASA: American Society of Anesthesiologists.
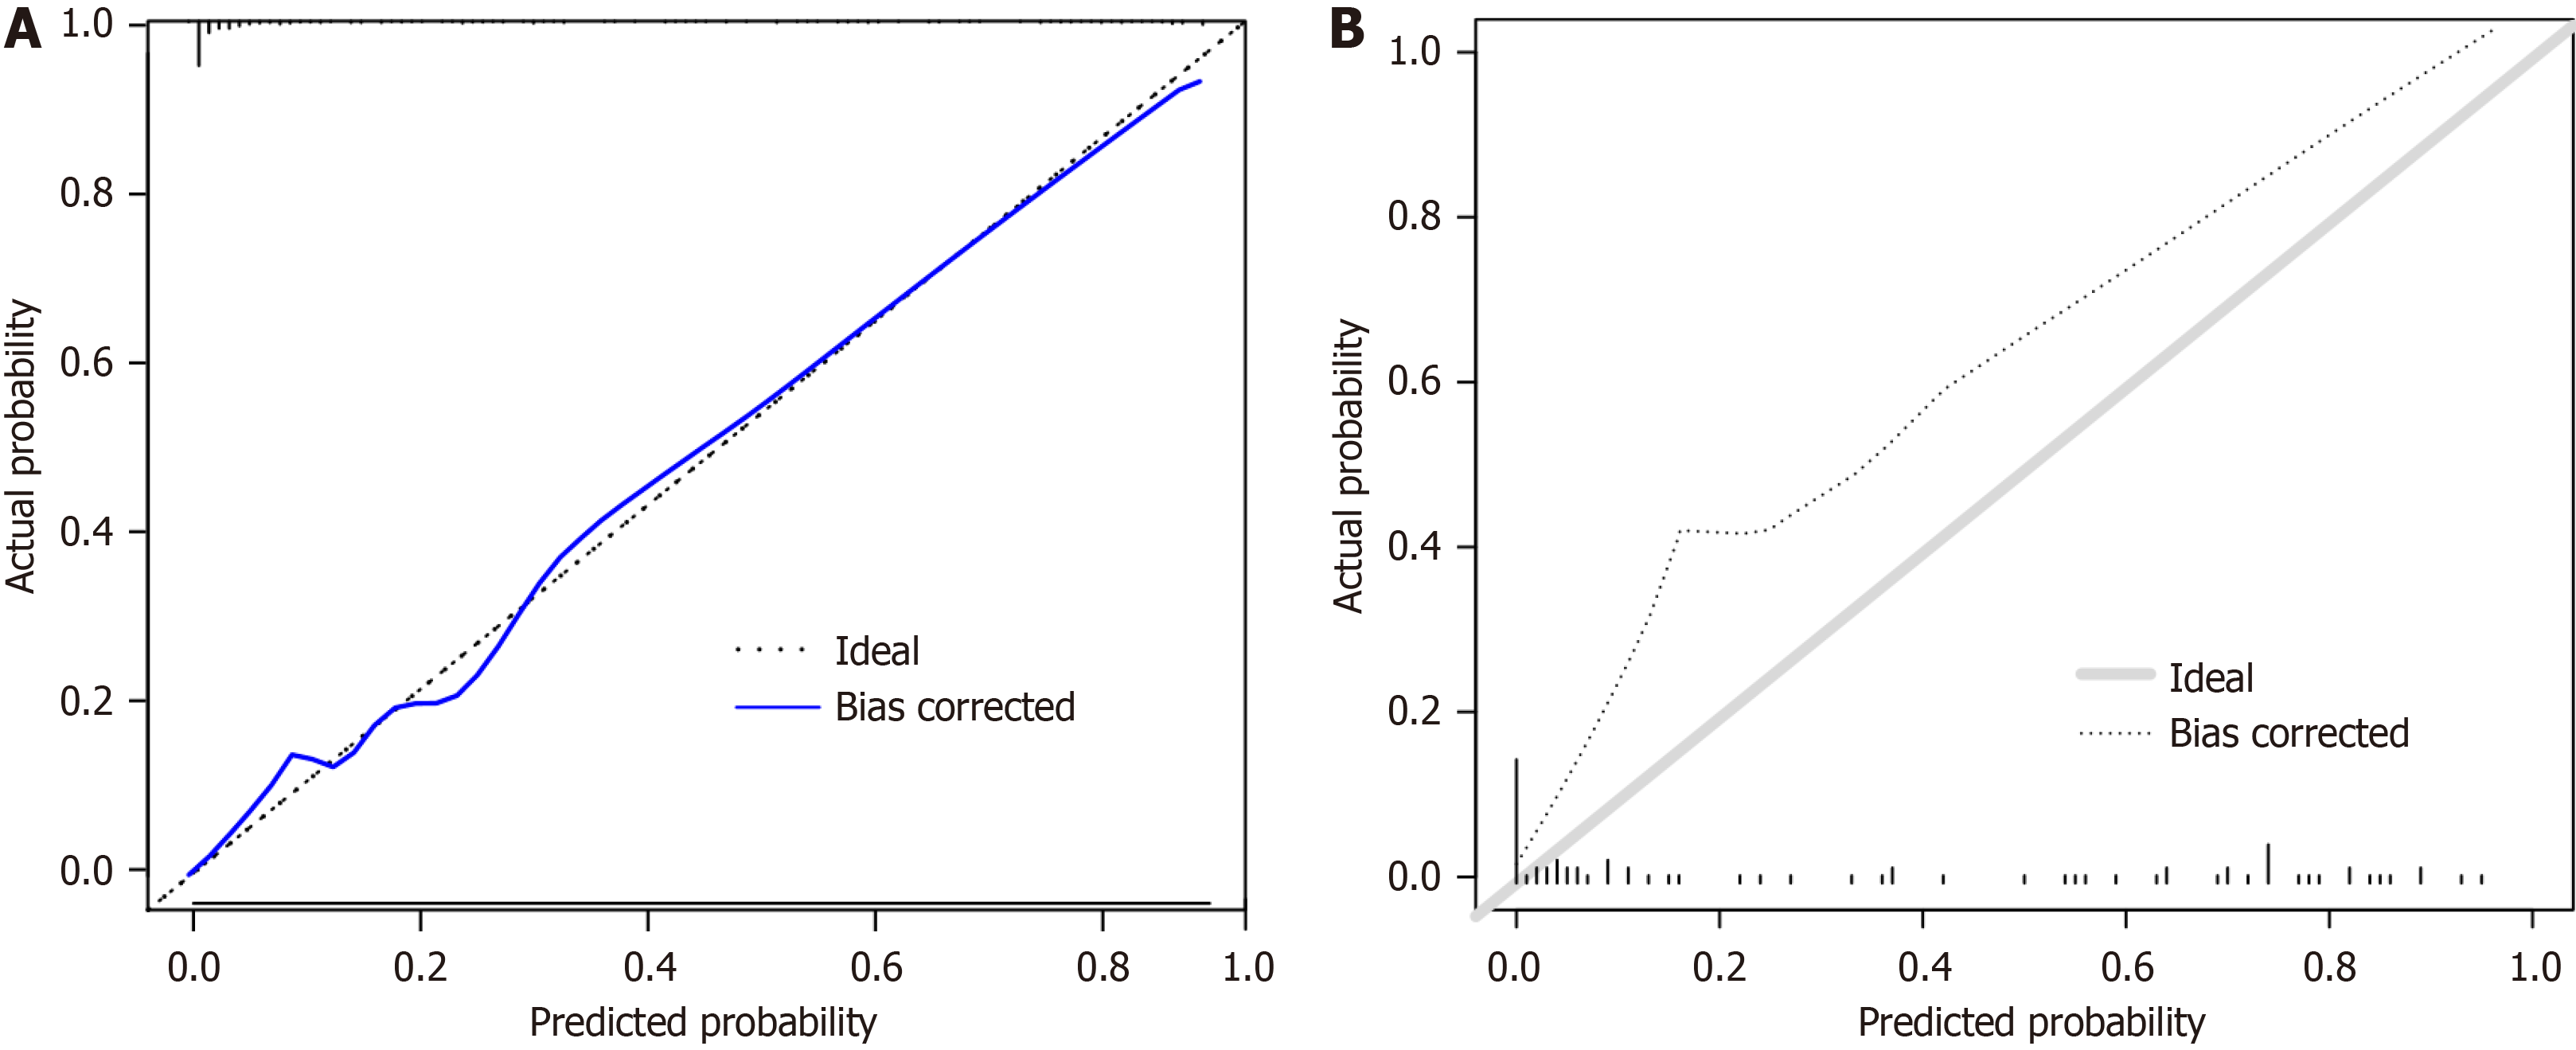
Figure 6 Calibration curve.
A: Calibration curve of the column diagram; B: Calibration curve of the random forest.
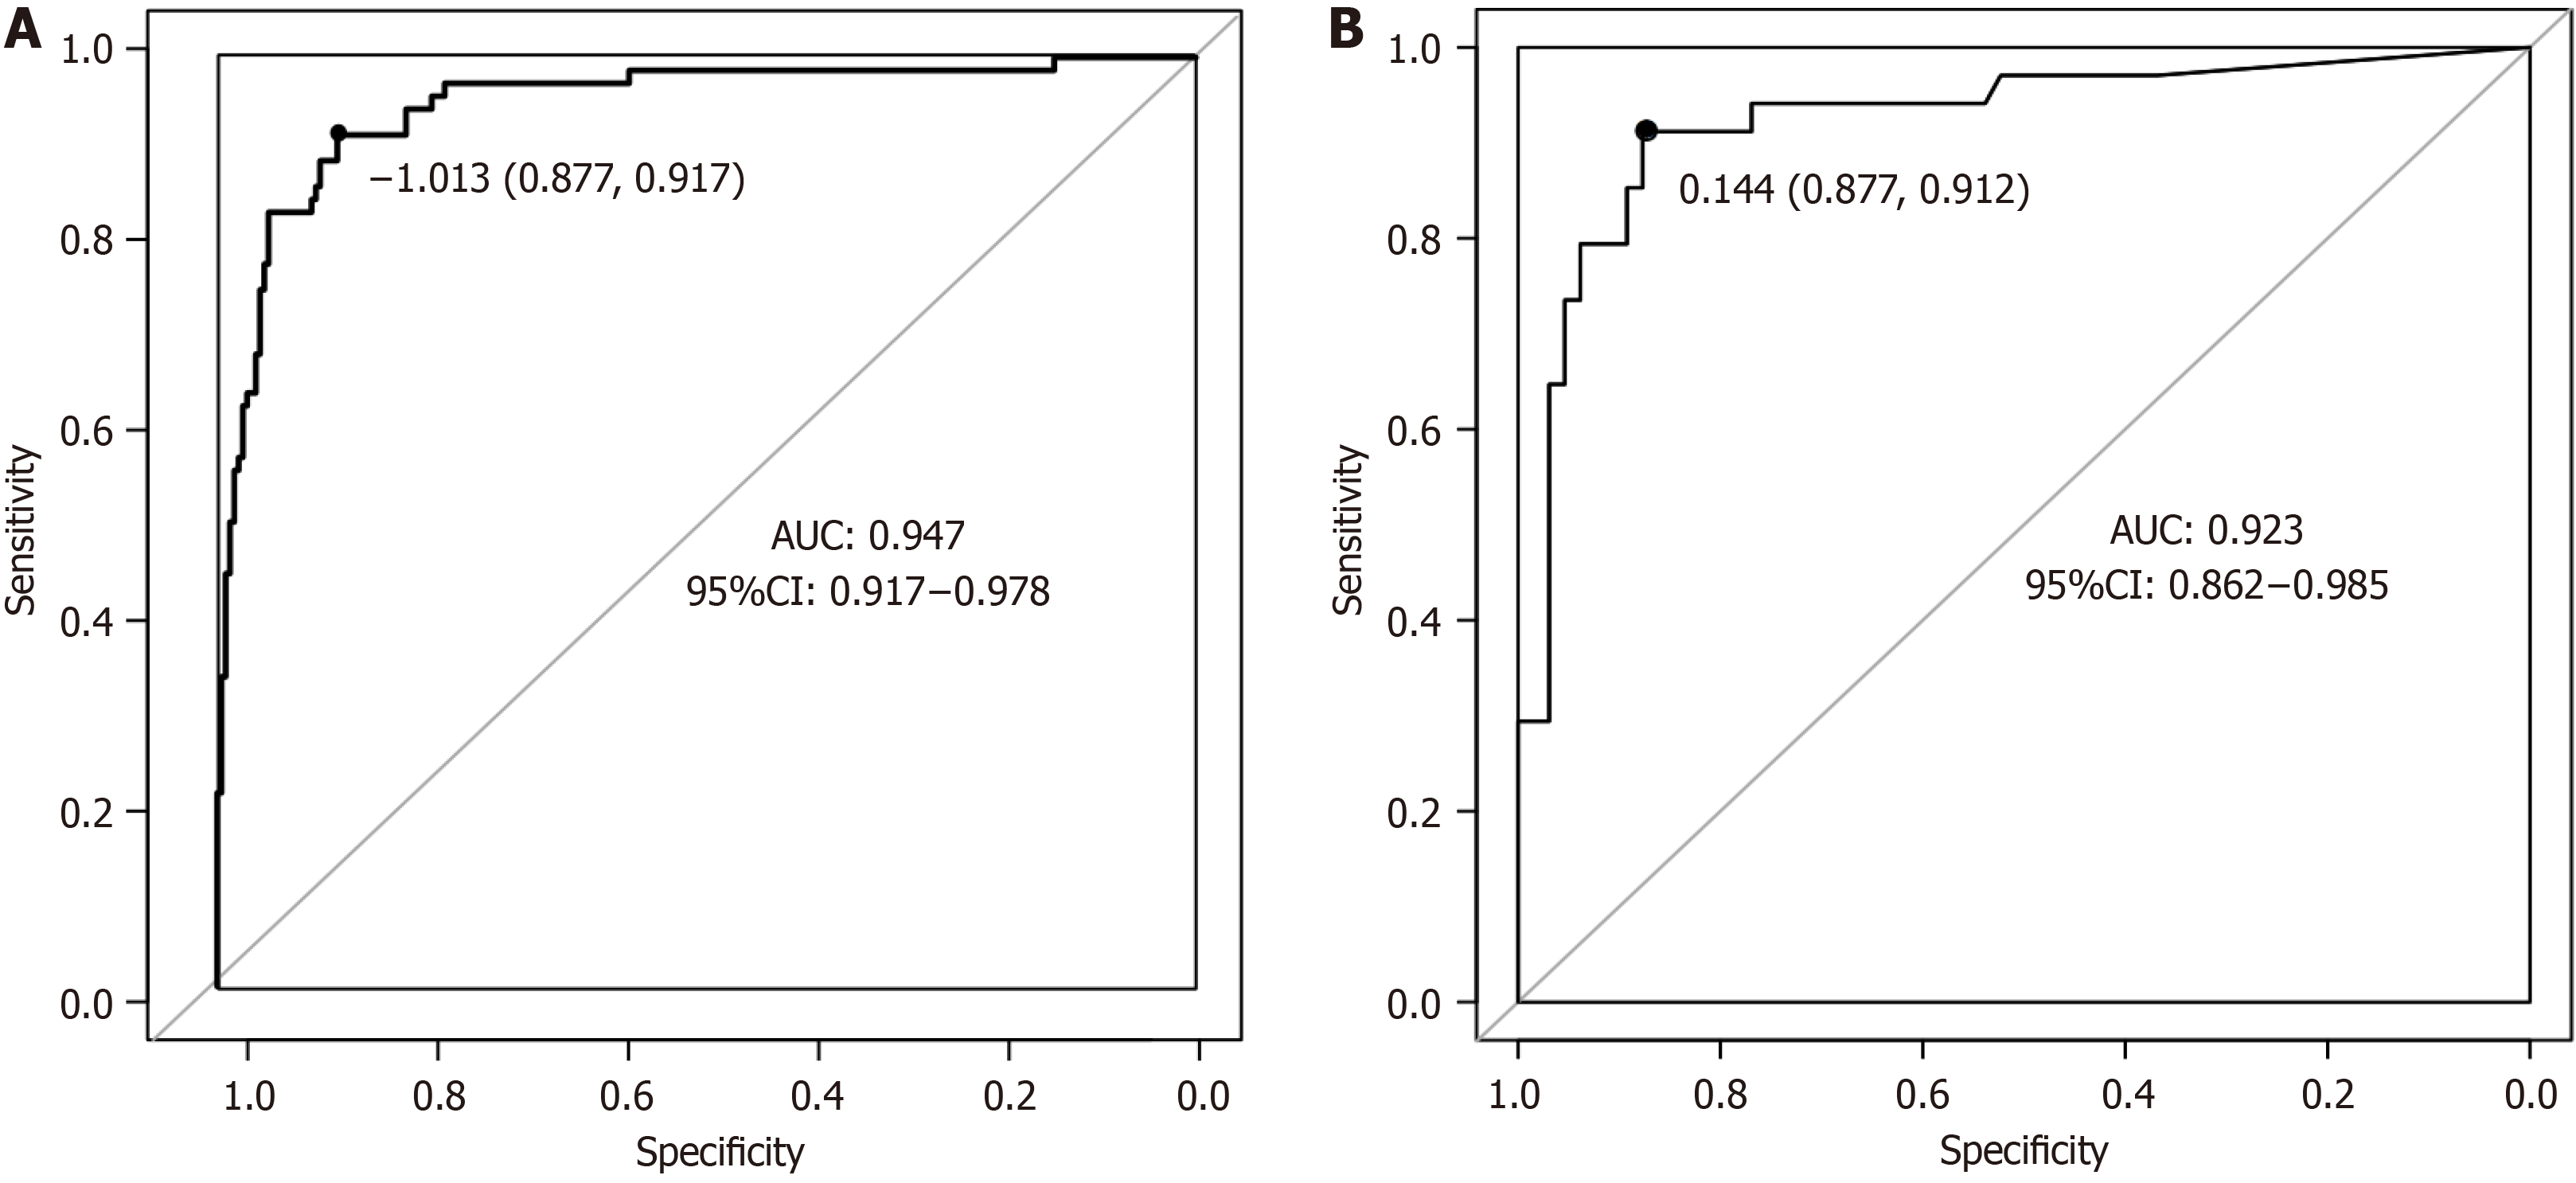
Figure 7 Receiver operating characteristic curve.
A: Receiver operating characteristic curve of the nomogram; B: Receiver operating characteristic curve of the random forest. AUC: Area under the receiver operating characteristic curve; CI: Confidence interval.
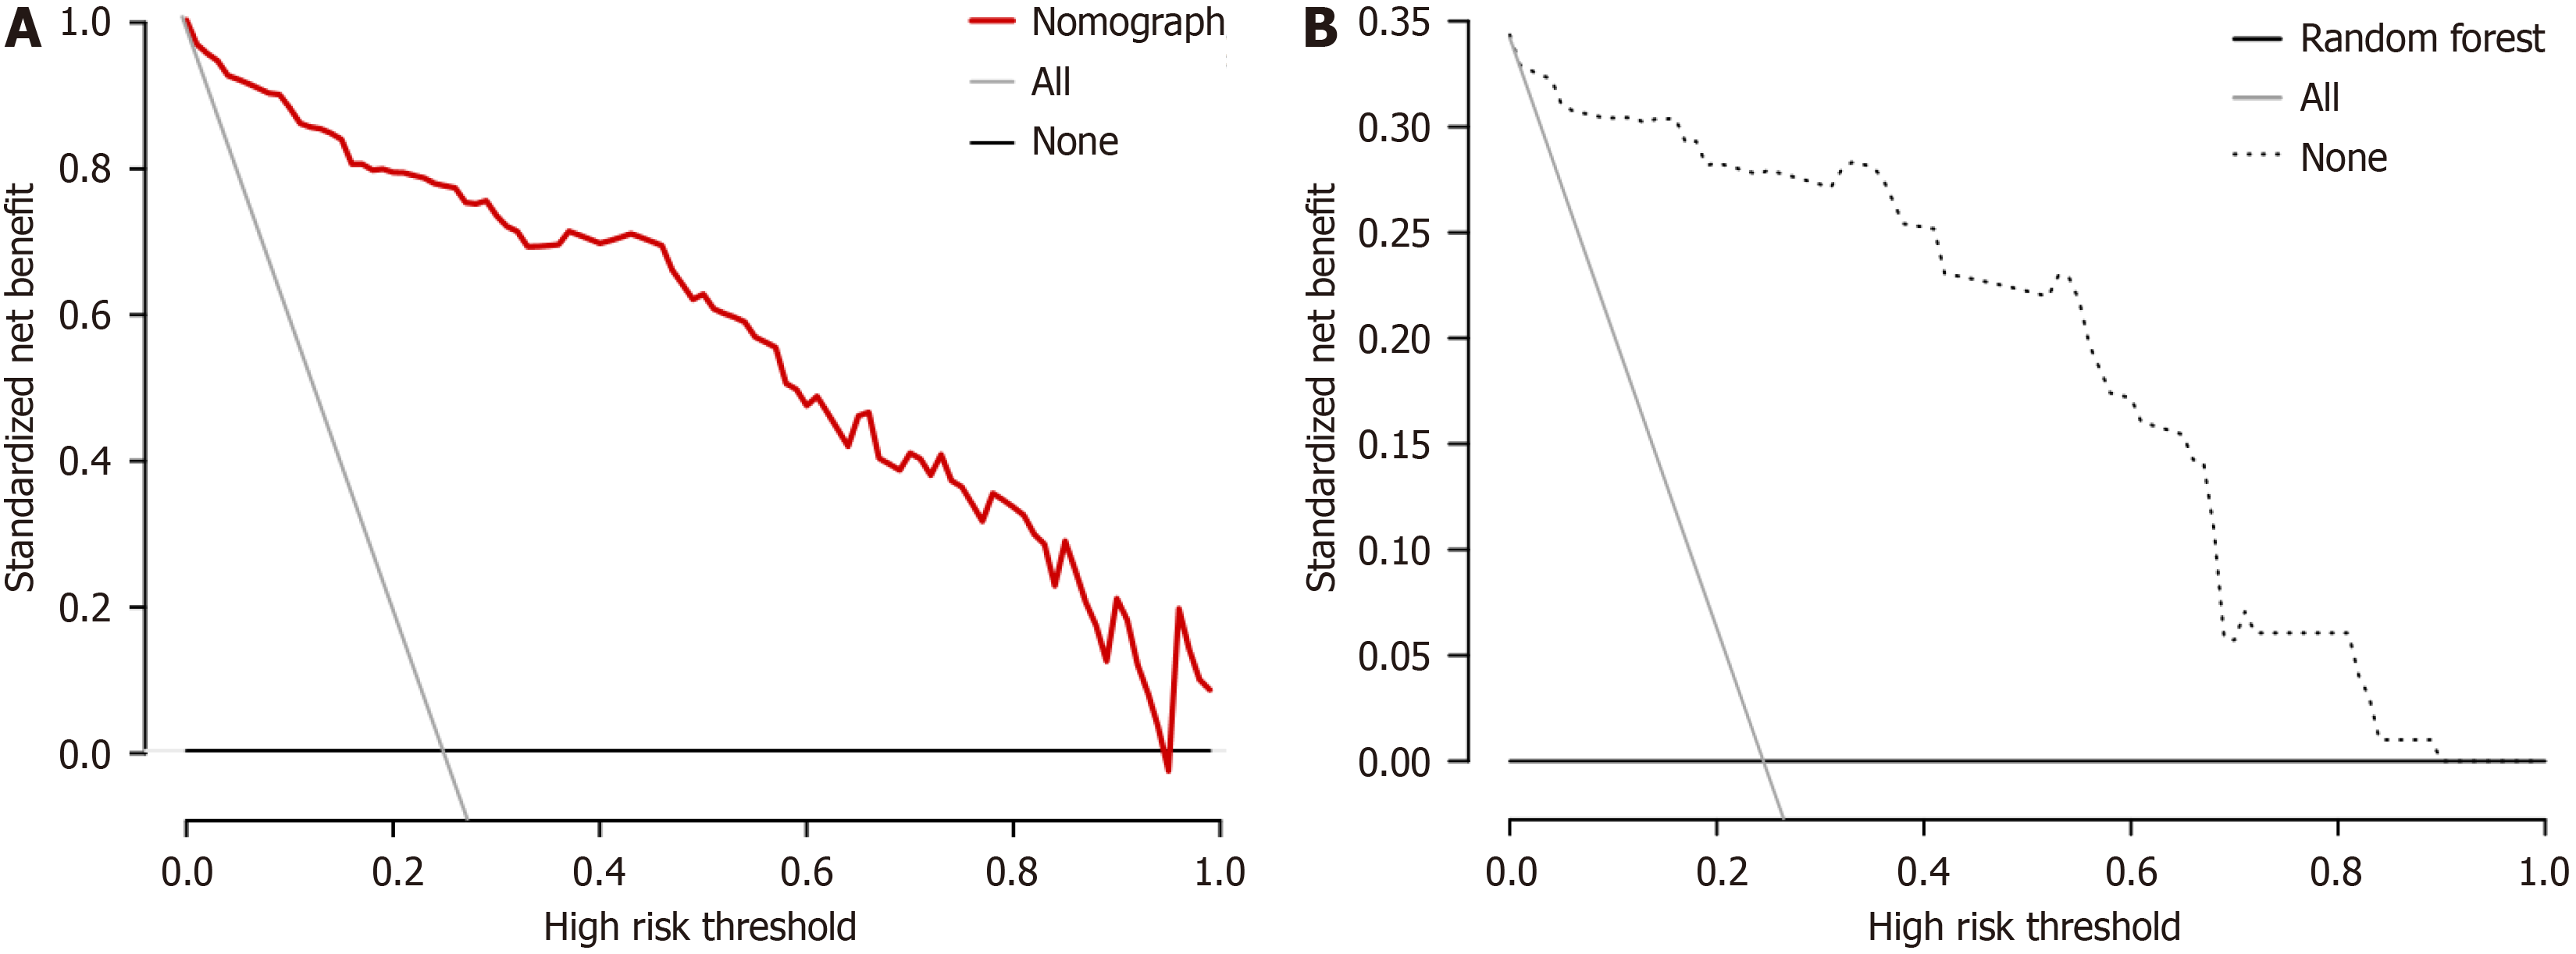
Figure 8 Clinical decision curve.
A: Decision curve of a column graph; B: Decision curve of a random forest.
- Citation: Zhu YF, Yi FY, Qin MH, Lu J, Liang H, Yang S, Wei YZ. Factors influencing agitation during anesthesia recovery after laparoscopic hernia repair under total inhalation combined with caudal block anesthesia. World J Gastrointest Surg 2024; 16(11): 3499-3510
- URL: https://www.wjgnet.com/1948-9366/full/v16/i11/3499.htm
- DOI: https://dx.doi.org/10.4240/wjgs.v16.i11.3499


