Copyright
©The Author(s) 2024.
World J Gastrointest Surg. Nov 27, 2024; 16(11): 3437-3444
Published online Nov 27, 2024. doi: 10.4240/wjgs.v16.i11.3437
Published online Nov 27, 2024. doi: 10.4240/wjgs.v16.i11.3437
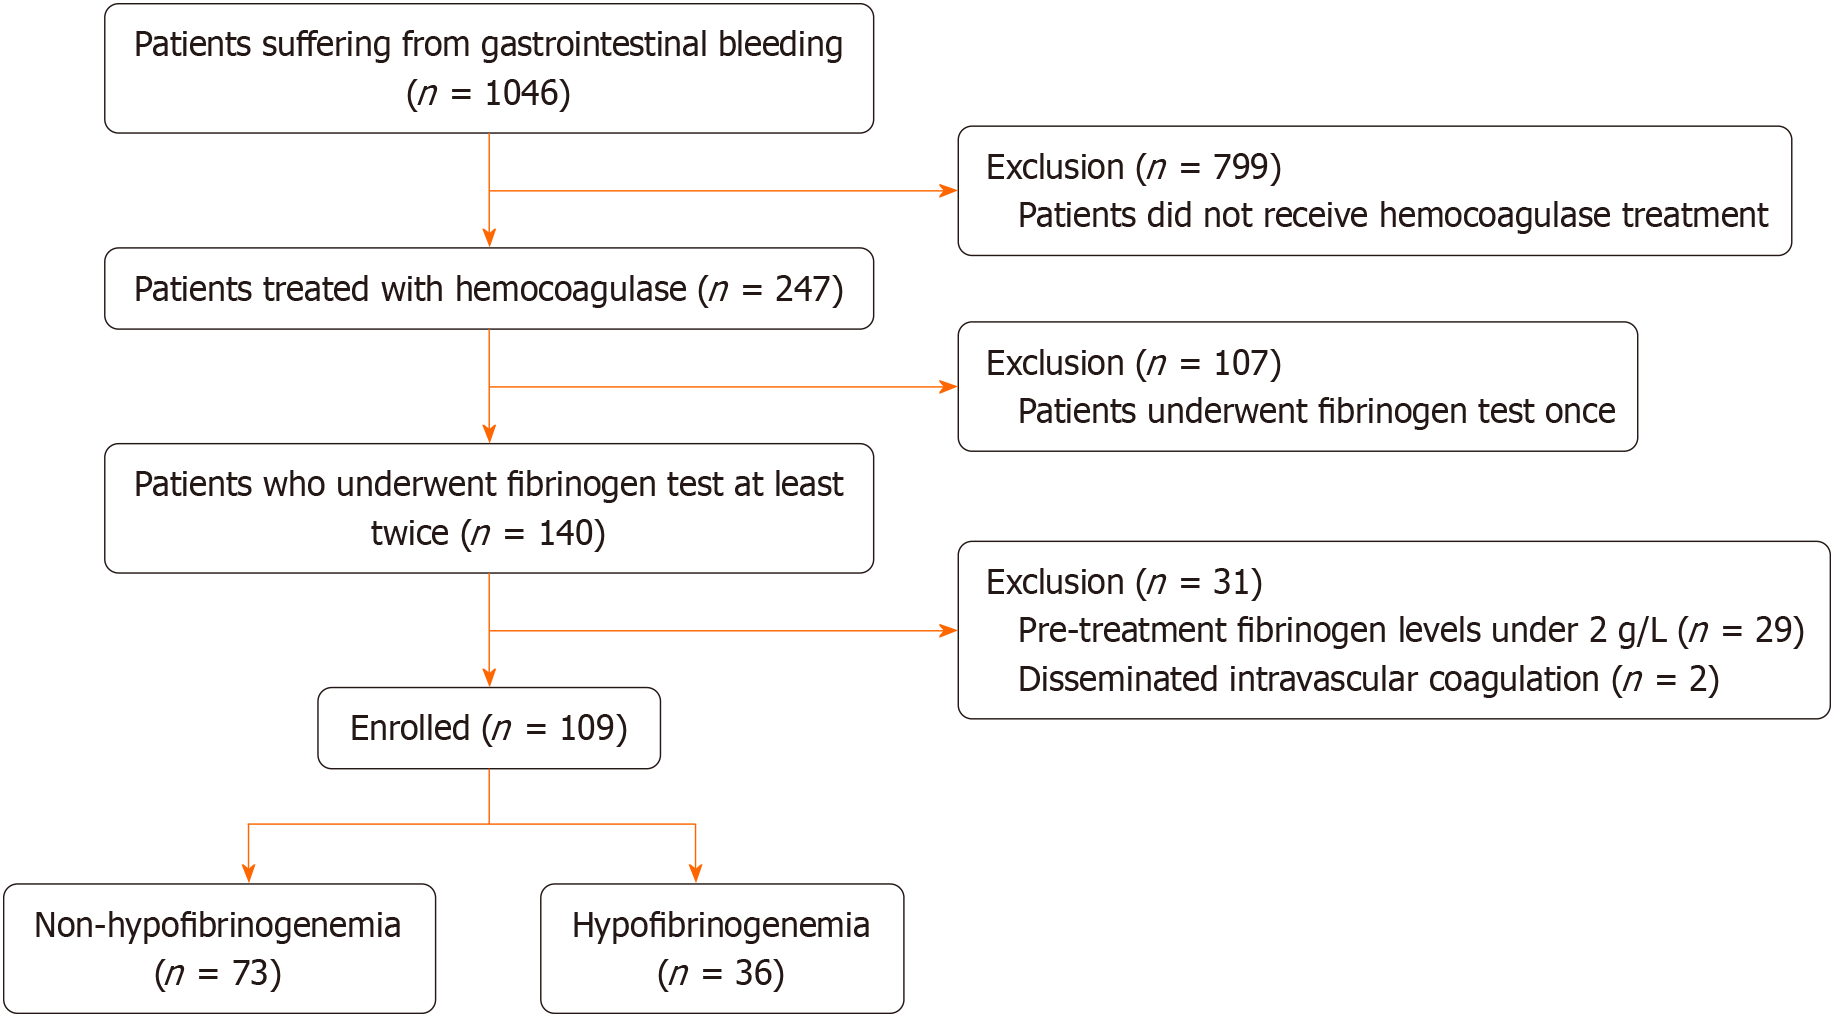
Figure 1 Flow diagram of this study.
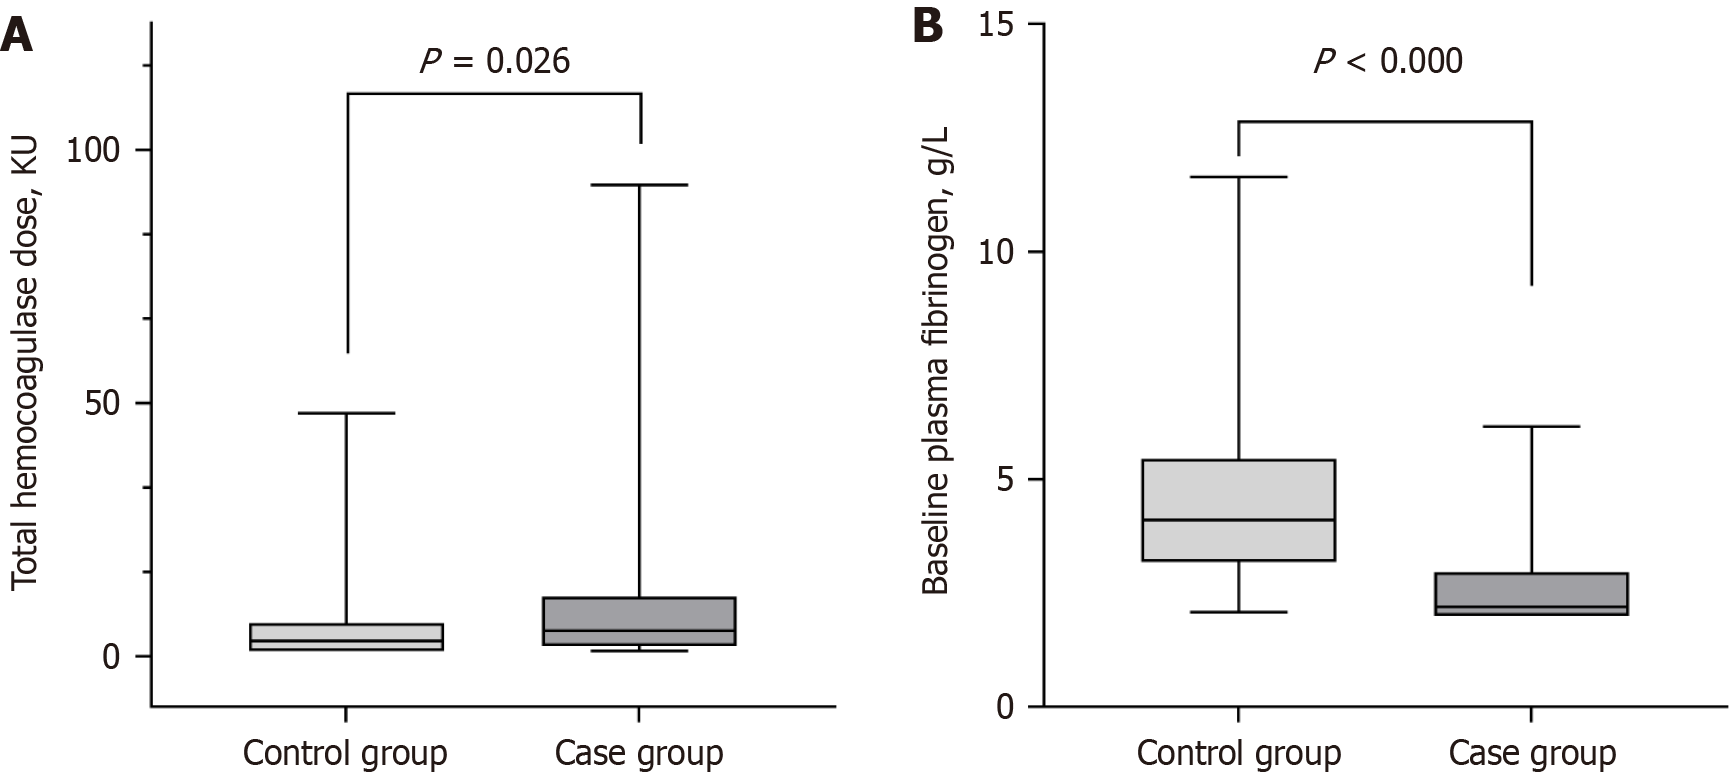
Figure 2 Comparison in the non-hypofibrinogenemia group (control group) vs the hypofibrinogenemia group (case group).
A: Comparison of total hemocoagulase doses administered in the non-hypofibrinogenemia group (control group) vs the hypofibrinogenemia group (case group); B: Comparison of baseline fibrinogen in the non-hypofibrinogenemia group (control group) vs the hypofibrinogenemia group (case group). KU: Klobusitzky unit.
- Citation: Zou F, Wu MT, Wang YY. Risk factors for hemocoagulase-associated hypofibrinogenemia in patients with gastrointestinal bleeding. World J Gastrointest Surg 2024; 16(11): 3437-3444
- URL: https://www.wjgnet.com/1948-9366/full/v16/i11/3437.htm
- DOI: https://dx.doi.org/10.4240/wjgs.v16.i11.3437


