©The Author(s) 2022.
World J Gastrointest Surg. Sep 27, 2022; 14(9): 1060-1071
Published online Sep 27, 2022. doi: 10.4240/wjgs.v14.i9.1060
Published online Sep 27, 2022. doi: 10.4240/wjgs.v14.i9.1060
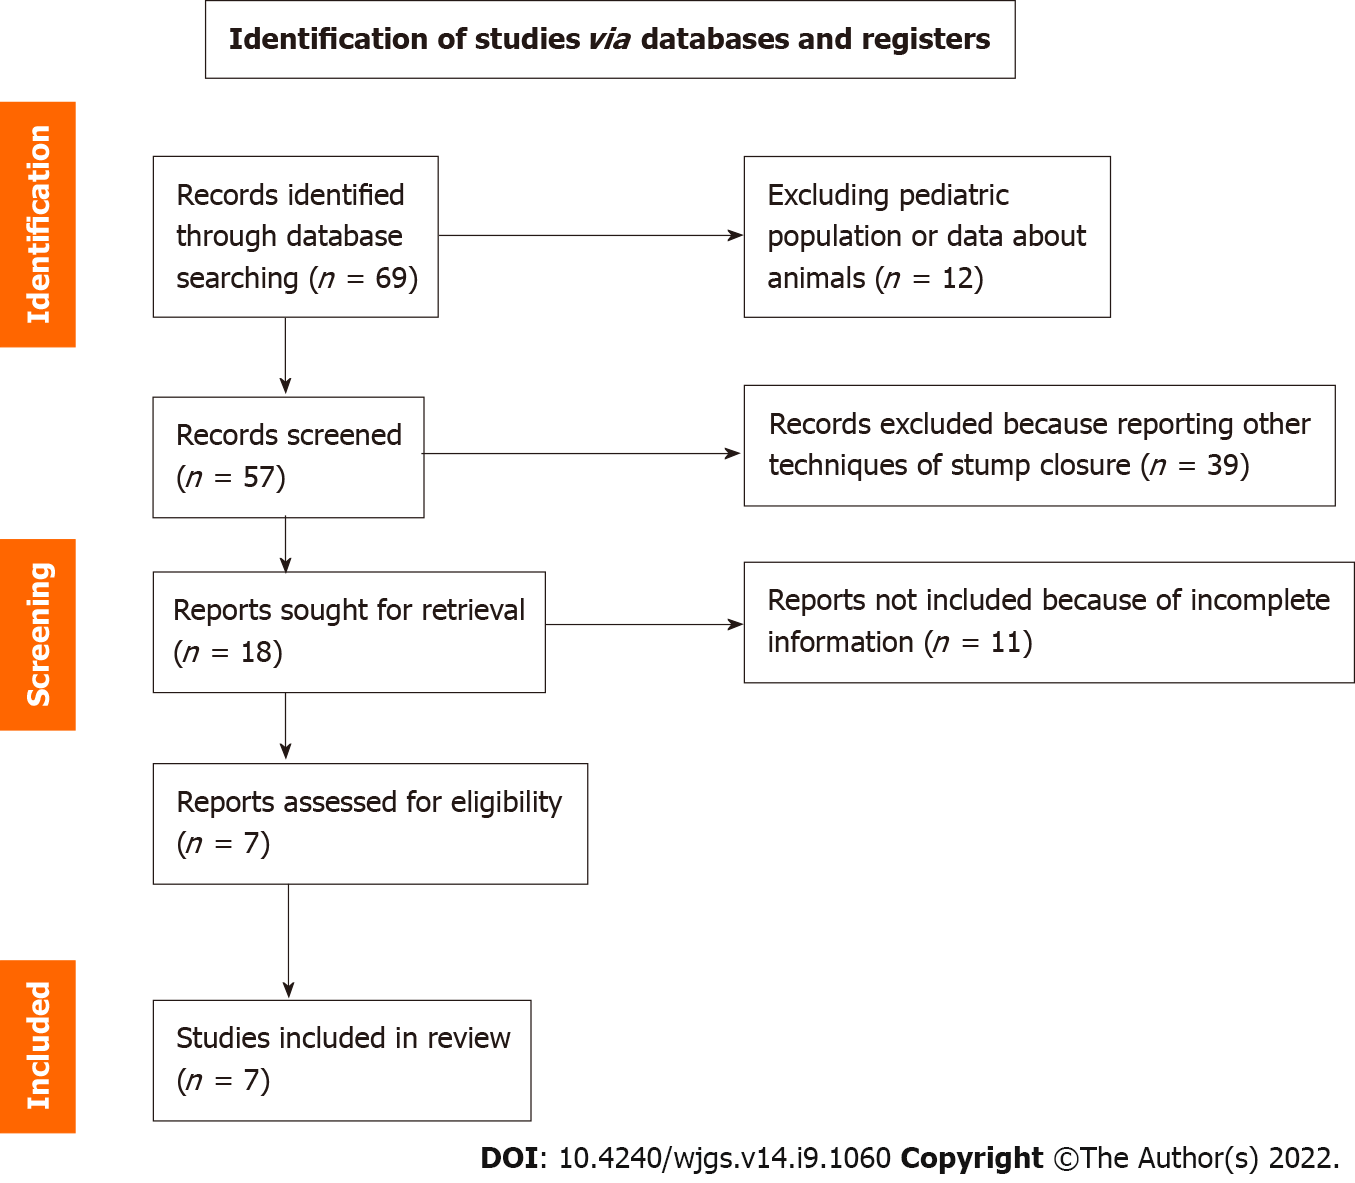
Figure 1 PRISMA diagram.
Figure 2 Wound infection Funnel plot.
A: Asymmetrical distribution among both sides indicates that bias can be present; B: The confidence interval (diamond) confirms there is no statistically significant result.
Figure 3 Abdominal abscess Funnel plot.
A: With asymmetrical distribution among both sides, indicating that bias can be present; B: The confidence interval (diamond) confirms there is no statistically significant result favoring endoloop or endostapler.
Figure 4 Post-operative complications Funnel plot.
A: Asymmetrical distribution among both sides indicates that bias can be present; B: The confidence interval (diamond) confirms there is not statistically significant difference between endoloop vs endostapler.
- Citation: Zorzetti N, Lauro A, Bellini MI, Vaccari S, Dalla Via B, Cervellera M, Cirocchi R, Sorrenti S, D’Andrea V, Tonini V. Laparoscopic appendectomy, stump closure and endoloops: A meta-analysis. World J Gastrointest Surg 2022; 14(9): 1060-1071
- URL: https://www.wjgnet.com/1948-9366/full/v14/i9/1060.htm
- DOI: https://dx.doi.org/10.4240/wjgs.v14.i9.1060


