


Published online Nov 15, 2025. doi: 10.4239/wjd.v16.i11.111008
Revised: August 5, 2025
Accepted: October 22, 2025
Published online: November 15, 2025
Processing time: 133 Days and 0.4 Hours
Colorectal cancer (CRC) is the third most diagnosed malignancy worldwide and a frequent comorbidity among these patients is type 2 diabetes mellitus (T2DM). The coexistence of these conditions poses significant challenges to glycemic management, particularly during chemotherapy.
To assess the effects of individualized exercise training (IET) on glycemic control and nutritional status in patients with T2DM undergoing chemotherapy for CRC.
In this retrospective study, clinical data from 245 patients with T2DM and on chemotherapy for CRC between November 2023 and December 2024 were ana
Patients in the IET group demonstrated significant improvements in glycemic control, nutritional biomarkers, and glycemic variability (all P < 0.05), compared with the SC group. The markers of intestinal permeability also improved significantly in the IET group (P < 0.05). Meanwhile, no statistically significant difference in the incidence of adverse events was found between the two groups (P > 0.05). These findings suggest that individualized exercise interventions can enhance metabolic, nutritional, and gastrointestinal outcomes without increasing treatment-related risks.
Personalized exercise training may offer clinically meaningful benefits in glycemic regulation and nutritional status for patients with T2DM and on chemotherapy for CRC.
Core Tip: Managing glycemic control and nutritional status is challenging in colorectal cancer patients with type 2 diabetes mellitus undergoing chemotherapy. This retrospective study demonstrates that adding personalized exercise training to standard care significantly improves glycemic control (reduced fasting plasma glucose, postprandial glucose, glycosylated hemoglobin, and variability), enhances nutritional biomarkers (albumin, prealbumin, hemoglobin, transferrin), and positively modulates intestinal permeability markers (zonulin, occludin) compared to standard care alone. Individualized exercise training was safe, with no increased adverse events. Personalized exercise is a beneficial adjunctive therapy for improving metabolic and nutritional outcomes in this high-risk population during chemotherapy.
- Citation: Yang L, Liu XP, Deng XM. Effects of tailored exercise on glycemic and nutritional outcomes in diabetic patients with colorectal cancer and on chemotherapy. World J Diabetes 2025; 16(11): 111008
- URL: https://www.wjgnet.com/1948-9358/full/v16/i11/111008.htm
- DOI: https://dx.doi.org/10.4239/wjd.v16.i11.111008
Colorectal cancer (CRC) remains one of the most prevalent malignancies globally, ranking as the third most diagnosed cancer and the second leading cause of cancer-related mortality worldwide[1,2]. Approximately one-third of individuals with CRC suffer from type 2 diabetes mellitus (T2DM), highlighting the complex bidirectional relationship between metabolic dysfunction and oncogenic risk. Glycemic control in this population is particularly challenging during chemotherapy because of treatment-related factors, such as chemotherapy-induced insulin resistance and compromised nutritional status can exacerbate hyperglycemia and glycemic variability[3-5]. Furthermore, dysregulated glucose homeostasis has been linked to adverse cancer outcomes and increased mortality, underscoring the critical importance of effective glycemic management in patients with comorbid T2DM and CRC[6,7].
Personalized exercise training has emerged as a promising intervention for reducing glycemic variability and improving nutritional status in individuals with chronic illnesses. A growing body of evidence highlights the mul
Glycemic variability, defined as fluctuations in blood glucose levels, has been identified as an independent risk factor for diabetic complications. It contributes to increased oxidative stress and endothelial dysfunction, thereby exacerbating cancer progression[12]. Traditional metrics of glycemic control, such as hemoglobin A1c (HbA1c), often fail to capture acute glucose fluctuations that commonly occur during chemotherapy. This limitation underscore the need for more refined monitoring tools, such as continuous glucose monitoring systems[13]. Concurrently, chemotherapy can severely compromise nutritional status, contributing to cancer-related cachexia and diminished quality of life. These challenges emphasize the critical need for supportive interventions aimed at preserving functional capacity and improving overall outcomes[14].
The incorporation of personalized exercise routines may stabilize glycemic variability and mitigate chemotherapy-induced declines in nutritional status. Individualized exercise programs, tailored to a patient’s baseline fitness, cancer stage, and treatment protocol, have demonstrated efficacy in improving outcomes across various cancer populations[15,16]. Current clinical guidelines support the role of exercise during cancer treatment, citing its potential to alleviate treatment-related side effects, reduce fatigue, and enhance psychological well-being. However, evidence-based recommendations specific to patients with CRC and comorbid diabetes remain limited[17].
In this context, the present study aims to evaluate the impact of personalized exercise interventions on glycemic variability and nutritional status in patients with T2DM and on chemotherapy for CRC. Given the dual challenges of hyperglycemia management and nutritional deterioration in this population, individualized exercise training (IET) may offer a noninvasive, patient-centered strategy to improve clinical outcomes. The distinct metabolic demands imposed by both CRC and diabetes underscore the need for tailored interventions that account for the heterogeneity of treatment responses and the individualized needs of each patient. This study seeks to address a critical gap in the current literature by providing evidence-based insights into the therapeutic potential of personalized exercise interventions for patients with coexisting CRC and T2DM.
This retrospective study analyzed clinical data from 245 patients with T2DM who underwent chemotherapy for CRC at Shanxi Province Cancer Hospital between November 2023 and December 2024. Patients were categorized into two groups according to the type of intervention received during hospitalization. The standard care (SC) group included 111 patients who received routine nursing care alongside conventional chemotherapy and diabetes management. The IET group comprised 134 patients who, in addition to SC, participated in a personalized exercise program tailored to their clinical condition and functional status.
This study was approved by the institutional review board and the ethics committee of Shanxi Province Cancer Hospital. Given its retrospective design, the use of de-identified patient data, and the absence of any impact on patient care or associated risk, the requirement for informed consent was waived. This waiver was granted in accordance with institutional and ethical guidelines governing retrospective research.
Inclusion criteria: The patients met the American Diabetes Association diagnostic criteria-2023 for T2DM[18], had a histopathologically confirmed diagnosis of CRC, and were undergoing chemotherapy for CRC. Additional eligibility criteria included an Eastern Cooperative Oncology Group (ECOG) performance status score of less than 3, preserved cognitive function, the ability to cooperate with medical examinations and treatment procedures, and a demonstrated capacity for high treatment compliance.
Exclusion criteria: The presence of comorbid conditions involving the heart, liver, or kidneys; impaired communication ability; diagnosed thyroid disorders; respiratory or other infectious diseases; additional malignancies; major organ dysfunction; or severe diabetic complications. Additionally, patients with stage IV CRC or those in poor overall physical condition were excluded from the study.
SC group: All patients received SC, which included maintaining a clean and comfortable hospital environment with appropriate temperature and humidity control and regular disinfection of the wards. Nursing staff provided patient- and family-centered education covering the pathophysiology of T2DM, the chemotherapy treatment process, and appropriate caregiving practices. One-on-one, face-to-face sessions were conducted to emphasize the importance of glycemic control, adherence to prescribed medications, and individualized nutritional planning. Patients were also instructed in self-administration of insulin and trained to monitor their blood glucose levels independently.
Central venous catheters were utilized for chemotherapy administration, and adjustments to medication dosages and infusion rates were made according to the pharmacological properties of the drugs to ensure optimal therapeutic efficacy. Disease-related information and chemotherapy precautions were communicated to patients in a manner appropriate to their educational level, aiming to enhance understanding and promote active cooperation. Open communication was encouraged to assess patients’ psychological well-being, allowing for targeted counseling interventions to alleviate negative emotions and reinforce psychological resilience. Dietary management was also prioritized, and patients were advised to consume bland, nutrient-dense foods.
IET group: The IET group received the same medical treatment, nursing care, and nutritional support as the SC group. In addition, patients in this group participated in a personalized exercise training program. All exercise interventions were administered by certified physiotherapists with a minimum of five years of experience in oncological rehabilitation. Exercise intensity was adjusted according to the patient’s ECOG performance status: Patients with ECOG grades 0-1 performed the full set of prescribed repetitions, whereas those with grade 2 completed half the repetitions per session. Dorsiflexion exercises were excluded for patients with diabetic neuropathy. Exercise sessions were scheduled to prevent hematologic nadir periods, typically occurring between days 3-7 following chemotherapy infusion, and to reduce the risk of infection and fatigue. The training regimen included the following regimens: (1) Breathing exercises: Pursed-lip and diaphragmatic breathing (1:2, inspiration:expiration ratio) at 8-12 breaths/minute, in 3-5 sets lasting 10-15 minutes, once daily. Respiratory rate and depth were monitored using portable spirometers (Vitalograph Alpha, Vitalograph, United Kingdom); and (2) Lower extremity and hip exercises: In the supine position, patients extended their legs and maximally flexed the dorsum, then lifted each leg to a 45° angle for five seconds. For hip movements, they bent their knees, pressed their feet against the bed, and lifted the hips using feet and elbows or shoulders, contracting the perineal muscles for two to five seconds before relaxing. Exercises were performed twice daily (morning and evening), 7-10 minutes per session, with rest as needed. Throughout the training period, healthcare staff continuously monitored patients’ vital signs and adjusted exercise intensity based on individual recovery progress. The intervention was conducted over a two-week period.
To comprehensively assess nutritional status, standardized procedures were used to measure serum levels of albumin, prealbumin, hemoglobin, and transferrin. These biomarkers were quantitatively analyzed using an automated analyzer (SC 100, Beckman Coulter, Inc., Brea, CA, United States) through chemiluminescent immunoassay, with consistent sampling and processing protocols applied across all specimens. Upon obtaining laboratory results for serum albumin, lymphocyte count, body weight, and height, the prognostic nutritional index was calculated using the formula: Prognostic nutritional index = albumin (g/L) + 5 × lymphocyte count (109/L). The nutritional risk index was determined using the following equation: Nutritional risk index = 1.487 × albumin (g/L) + 41.7 × (preoperative weight/ideal weight in kilogram)[19].
Venous blood samples (3 mL each) were collected from patients using sodium citrate vacuum blood collection tubes on the mornings before and after the nursing interventions. The samples were anticoagulated with citrate and centrifuged at 3000 rpm for five minutes using a refrigerated high-speed centrifuge (Mini1524, Zhuhai Hemac Medical Equipment Co., Ltd., China). Plasma levels of zonulin, occludin, and lipopolysaccharide-binding protein (LBP) were measured using enzyme-linked immunosorbent assay techniques. The specific enzyme-linked immunosorbent assay kits employed were as follows: Human Zonulin Kit (EKC36091, Biomatik Unites States, LLC, Wilmington, DE, Unites States), Human Occludin Kit (NBP2-80305, Novus Biologicals, LLC, Centennial, CO, Unites States), and Human LBP Kit (DY870-05, R&D Systems, Inc., Minneapolis, MN, Unites States).
Fasting blood glucose (FBG) levels were measured in both groups before and after the nursing interventions. Five milliliters of fasting venous blood were collected from each patient in the early morning. The samples were centrifuged at 400 rpm for 10 minutes using a refrigerated high-speed centrifuge (TLD 12A, Xiangxi Scientific Instruments, Hunan, China). Following centrifugation, the samples were stored at low temperatures for subsequent analysis. Fasting plasma glucose (FPG), two-hour postprandial blood glucose, and HbA1c levels were measured before and after the nursing intervention using a fully automated biochemical analyzer (AU5811, Kehua Bio-Engineering Co., Ltd., Shanghai, China). The reference ranges for adult patients were as follows: FPG, 3.9-6.1 mmol/L; two-hour postprandial blood glucose, 4.4-7.8 mmol/L; and HbA1c, 4%-6%.
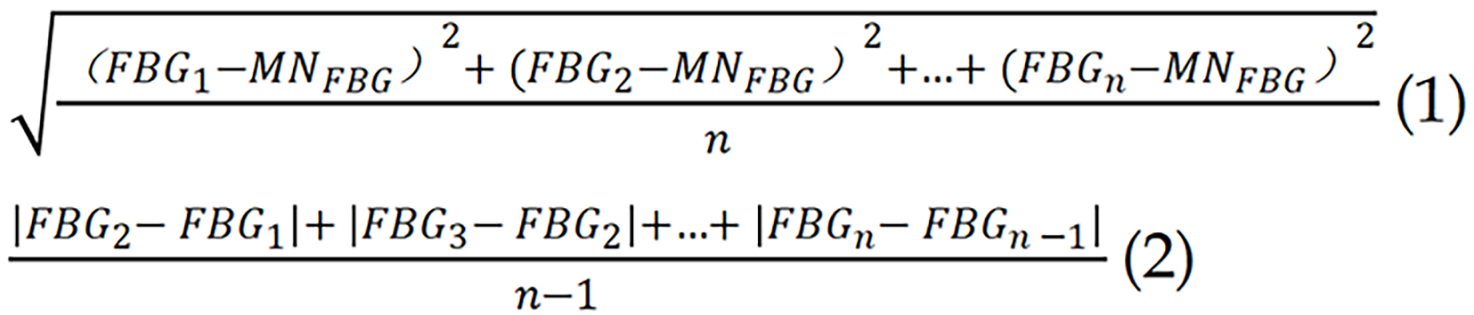
Indicators of long-term variability in FBG included the standard deviation of FBG, the average successive variability, and the coefficient of variation. These metrics were calculated based on multiple FBG assessments conducted throughout the nursing intervention period[20]. The calculation formulas were as follows. Among them, MN refers to the mean.
Data analysis was performed using SPSS statistical software version 29.0 (SPSS Inc., Chicago, IL, United States). Categorical variables were expressed as n (%). The χ2 test was applied when the sample size was ≥ 40 and the expected frequency (T) was ≥ 5. For sample sizes ≥ 40 with expected frequencies between 1 and < 5, a continuity correction was applied to the χ2 test. Fisher’s exact test was used when the sample size was < 40 or the expected frequency was < 1. The Shapiro-Wilk test was employed to assess the normality of continuous variables. Variables with a normal distribution were presented as mean ± SD and analyzed using the independent samples t-test. A P value of < 0.05 was considered statistically significant.
The mean age of participants was 58.44 ± 7.65 years in the SC group and 57.96 ± 8.17 years in the IET group (P = 0.633; Table 1). Body mass index was comparable between the two groups, with mean values of 24.37 ± 4.11 kg/m² in the SC group and 24.42 ± 4.12 kg/m² in the IET group (P = 0.928). Gender distribution was similar, with females comprising 27.93% of the SC group and 29.10% of the IET group (P = 0.839). No significant differences were observed in smoking or drinking status between groups (P > 0.05). Physical activity levels, measured in hours per week, were identical in both groups, with a mean of 4.69 hours (P = 0.981). There were also no statistically significant differences in education level, occupational status, or financial difficulty (P > 0.05). Furthermore, marital status, monthly average income, and the prevalence of hypertension and anemia did not differ significantly between groups (P > 0.05). These findings suggest that the two groups were well matched in terms of demographic and baseline clinical characteristics.
| Index | SC group (n = 111) | IET group (n = 134) | t/χ² | P value |
| Age (years) | 58.44 ± 7.65 | 57.96 ± 8.17 | 0.478 | 0.633 |
| BMI (kg/m²) | 24.37 ± 4.11 | 24.42 ± 4.12 | 0.09 | 0.928 |
| Female/male | 31 (27.93)/80 (72.07) | 39 (29.1)/95 (70.9) | 0.041 | 0.839 |
| Smoking status | 22 (19.82) | 21 (15.67) | 0.722 | 0.396 |
| Drinking status | 12 (10.81) | 11 (8.21) | 0.483 | 0.487 |
| Physical activity (hours/week) | 4.69 ± 2.22 | 4.69 ± 1.93 | 0.024 | 0.981 |
| Education level (high school and below/bachelor degree and above) | 94 (84.68)/17 (15.32) | 117 (87.31)/17 (12.69) | 0.351 | 0.554 |
| Occupation status (working/not working) | 46 (41.44)/65 (58.56) | 51 (38.06)/83 (61.94) | 0.29 | 0.59 |
| Difficulty paying for basics (hard/ not hard) | 75 (67.57)/36 (32.43) | 88 (65.67)/46 (34.33) | 0.098 | 0.754 |
| Marital status (single/married/divorced) | 28 (25.23)/59 (53.15)/24 (21.62) | 37 (27.61)/75 (55.97)/22 (16.42) | 1.094 | 0.579 |
| Monthly average income (< 3000/3000-6000/> 6000) | 23 (20.72)/56 (50.45)/32 (28.83) | 23 (17.16)/57 (42.54)/54 (40.3) | 3.508 | 0.173 |
| Hypertension | 31 (27.93) | 32 (23.88) | 0.521 | 0.471 |
| Anemia | 18 (16.22) | 15 (11.19) | 1.314 | 0.252 |
The mean duration of diabetes was 9.01 ± 2.29 years in the SC group and 8.84 ± 2.39 years in the IET group (P = 0.581; Table 2). A family history of diabetes was reported in 26.13% of patients in the SC group and 23.13% in the IET group (P = 0.588). Use of self-blood glucose monitoring was reported by 53.15% of SC patients and 44.03% of IET group, though the difference was not statistically significant (P = 0.155). The proportion of patients receiving insulin monotherapy was 70.27% in the SC group and 65.67% in the IET group (P = 0.443), while 22.52% and 29.85% of patients, respectively, were on a combination of oral medication and insulin (P = 0.196). The average daily insulin dose was similar between groups, with 42.47 ± 13.89 units in the SC group and 41.47 ± 12.97 units in the IET group (P = 0.559). Staple food intake was comparable, with 68.47% of SC patients and 69.40% of IET patients consuming ≤ 400 g/day (P = 0.875). Dorsalis pedis artery pulsation was present in 83.78% of SC patients and 89.55% of IET patients (P = 0.182). These findings confirm that diabetes-related baseline characteristics were comparable between the two groups.
| Index | SC group (n = 111) | IET group (n = 134) | t/χ² | P value |
| Duration of diabetes (years) | 9.01 ± 2.29 | 8.84 ± 2.39 | 0.552 | 0.581 |
| Family history of diabetes | 29 (26.13) | 31 (23.13) | 0.294 | 0.588 |
| Use of SBGM | 59 (53.15) | 59 (44.03) | 2.024 | 0.155 |
| Only insulin injection | 78 (70.27) | 88 (65.67) | 0.588 | 0.443 |
| Oral medicine plus insulin injection | 25 (22.52) | 40 (29.85) | 1.673 | 0.196 |
| The average daily dose of insulin injection (units) | 42.47 ± 13.89 | 41.47 ± 12.97 | 0.585 | 0.559 |
| Staple food control (≤ 400 g/day/> 400 g/day) | 76 (68.47)/35 (31.53) | 93 (69.4)/41 (30.6) | 0.025 | 0.875 |
| Dorsalis pedis artery pulsation | 93 (83.78) | 120 (89.55) | 1.779 | 0.182 |
Tumor site distribution revealed that 62.16% of patients in the SC group and 64.93% in the IET group had segmented colon tumors, while rectal tumors were present in 37.84% and 35.07%, respectively (P = 0.654; Table 3). Tumor size at diagnosis showed slight variation: Tumors < 4 cm were observed in 36.94% of SC patients and 30.60% of IET patients; tumors measuring 4-6 cm were reported in 32.43% and 35.07%; and those > 6 cm in 30.63% and 34.33%, respectively (P = 0.575). Tumor node metastasis staging was comparable between groups: Stage I in 22.52% (SC) vs 23.13% (IET), stage II in 40.54% vs 43.28%, stage III in 36.94% vs 33.58%, and stage IV in 18.92% vs 14.93% (P = 0.855). Disease duration of less than 3 months was recorded in 32.43% of SC patients and 35.07% of IET patients, 3-6 months in 34.23% vs 38.06%, and more than 6 months in 33.33% vs 26.87% (P = 0.543). Surgical method data showed that 68.47% of SC and 70.90% of IET patients underwent palliative surgery, while 31.53% and 29.10%, respectively, underwent radical surgery (P = 0.680). The ECOG performance status was also similar: Grade 0 in 18.92% (SC) vs 19.40% (IET), grade 1 in 19.82% vs 21.64%, and grade 2 in 61.26% vs 58.96% (P = 0.924). These findings confirm the comparability of CRC-related characteristics between the two groups at baseline.
| Parameters | SC group (n = 111) | IET group (n = 134) | t/χ² | P value |
| Tumor site | 0.2 | 0.654 | ||
| Segmented colon | 69 (62.16) | 87 (64.93) | ||
| Rectum | 42 (37.84) | 47 (35.07) | ||
| Tumor size at diagnosis | 1.108 | 0.575 | ||
| < 4 cm | 41 (36.94) | 41 (30.6) | ||
| 4-6 cm | 36 (32.43) | 47 (35.07) | ||
| > 6 cm | 34 (30.63) | 46 (34.33) | ||
| TNM staging | 0.313 | 0.855 | ||
| Stage I | 25 (22.52) | 31 (23.13) | ||
| Stage II | 45 (40.54) | 58 (43.28) | ||
| Stage III | 41 (36.94) | 45 (33.58) | ||
| Disease duration | 1.222 | 0.543 | ||
| < 3 months | 36 (32.43) | 47 (35.07) | ||
| 3-6 months | 38 (34.23) | 51 (38.06) | ||
| > 6 months | 37 (33.33) | 36 (26.87) | ||
| Surgical method | 0.17 | 0.68 | ||
| Palliative surgery | 76 (68.47) | 95 (70.9) | ||
| Radical surgery | 35 (31.53) | 39 (29.1) | ||
| ECOG | 0.158 | 0.924 | ||
| Grade 0 | 21 (18.92) | 26 (19.4) | ||
| Grade 1 | 22 (19.82) | 29 (21.64) | ||
| Grade 2 | 68 (61.26) | 79 (58.96) |
Albumin levels were 36.34 ± 4.31 g/L in the SC group and 36.65 ± 4.14 g/L in the IET group (P = 0.578; Figure 1). Prealbumin levels were nearly identical, at 207.33 ± 21.27 mg/L for the SC group and 207.38 ± 21.65 mg/L for the IET group (P = 0.988). Hemoglobin levels were slightly higher in the IET group (113.12 ± 7.87 g/L) than in the SC group (111.45 ± 7.49 g/L), though the difference was not statistically significant (P = 0.092). Transferrin levels were also comparable between groups: 1.71 ± 0.31 mg/L in the SC group and 1.69 ± 0.21 mg/L in the IET group (P = 0.483). These results confirm that baseline nutritional status did not significantly differ between the two groups.

Post-intervention, albumin levels were significantly higher in the IET group (36.99 ± 4.89 g/L) than in the SC group (35.44 ± 3.23 g/L, P = 0.003; Figure 1). Prealbumin levels also increased significantly in the IET group (247.87 ± 23.22 mg/L) compared to the SC group (241.36 ± 20.14 mg/L, P = 0.021). Hemoglobin concentrations were elevated in the IET group (125.51 ± 7.83 g/L) relative to the SC group (123.57 ± 5.24 g/L, P = 0.022). Transferrin levels were likewise higher in the IET group (1.75 ± 0.23 mg/L) than in the SC group (1.68 ± 0.11 mg/L, P = 0.001). These findings suggest that personalized exercise training may improve nutritional status in diabetic patients undergoing chemotherapy for CRC.
Occludin concentrations were 0.31 ± 0.13 ng/mL in the SC group and 0.29 ± 0.11 ng/mL in the IET group (P = 0.206; Figure 2A-C). Zonulin levels were likewise comparable, at 1.39 ± 0.35 and 1.38 ± 0.29 ng/mL for the SC and IET groups, respectively (P = 0.738). LBP levels were 30.33 ± 7.49 ng/mL in the SC group and 30.86 ± 7.61 ng/mL in the IET group (P = 0.582). These findings indicate that intestinal permeability markers were similar between the two groups at baseline.

Occludin levels were significantly higher in the SC group, at 0.32 ± 0.09 ng/mL, compared to 0.29 ± 0.09 ng/mL in the IET group (P = 0.009; Figure 2D-F). Zonulin levels were significantly lower in the IET group, averaging 1.30 ± 0.21 ng/mL, vs 1.41 ± 0.41 ng/mL in the SC group (P = 0.011). LBP levels were significantly elevated in the IET group, reaching 33.69 ± 6.98 ng/mL vs 31.66 ± 7.21 ng/mL in the SC group (P = 0.026). These findings suggest that personalized exercise training may modulate intestinal permeability markers in diabetic patients undergoing chemotherapy for CRC.
FPG levels were comparable at baseline (SC: 10.12 ± 1.28 mmol/L; IET: 10.08 ± 1.48 mmol/L; P = 0.796; Table 4). Post-intervention, FPG significantly declined in the IET group to 6.98 ± 1.21 mmol/L, compared with 7.55 ± 1.88 mmol/L in the SC group (P = 0.007). Two-hour postprandial glucose levels also decreased significantly, averaging 8.85 ± 2.55 mmol/L in the IET group vs 9.92 ± 2.87 mmol/L in the SC group (P = 0.002). Baseline HbA1c levels were not significantly different (SC: 8.87% ± 1.41%; IET: 8.57% ± 1.76%; P = 0.133), but improved more markedly in the IET group after intervention (6.51% ± 2.41%) compared with the SC group (7.49% ± 2.64%; P = 0.003). These findings suggest that personalized exercise training improves glycemic control in diabetic patients undergoing chemotherapy for CRC.
| Index | SC group (n = 111) | IET group (n = 134) | t | P value |
| FPG before nursing (mmol/L) | 10.12 ± 1.28 | 10.08 ± 1.48 | 0.259 | 0.796 |
| FPG after nursing (mmol/L) | 7.55 ± 1.88 | 6.98 ± 1.21 | 2.732 | 0.007 |
| 2-hour PG before nursing (mmol/L) | 12.83 ± 1.57 | 12.47 ± 1.58 | 1.755 | 0.08 |
| 2-hour PG after nursing (mmol/L) | 9.92 ± 2.87 | 8.85 ± 2.55 | 3.096 | 0.002 |
| HbA1c before nursing (%) | 8.87 ± 1.41 | 8.57 ± 1.76 | 1.506 | 0.133 |
| HbA1c after nursing (%) | 7.49 ± 2.64 | 6.51 ± 2.41 | 3.036 | 0.003 |
The average successive variability of FBG was significantly lower in the IET group (0.44 ± 0.17) compared with the SC group (0.51 ± 0.21; P = 0.004; Table 5). Likewise, the standard deviation of FBG was reduced in the IET group (0.43 ± 0.23) vs the SC group (0.54 ± 0.33; P = 0.002). The coefficient of variation of FBG was also lower in the IET group (7.93 ± 1.29) compared with the SC group (8.64 ± 2.47; P = 0.007). These results suggest that personalized exercise training reduces blood glucose variability in diabetic patients undergoing chemotherapy for CRC.
| Parameters | SC group (n = 111) | IET group (n = 134) | t | P value |
| ASVFBG | 0.51 ± 0.21 | 0.44 ± 0.17 | 2.881 | 0.004 |
| SDFBG | 0.54 ± 0.33 | 0.43 ± 0.23 | 3.085 | 0.002 |
| CVFBG | 8.64 ± 2.47 | 7.93 ± 1.29 | 2.728 | 0.007 |
In comparing adverse events between the SC group (n = 111) and the IET group (n = 134), no significant differences were observed (all P > 0.05; Table 6). Falls occurred in 0 (0.00%) of the SC group and 1 (0.75%) of the IET group; hypoglycemia in 1 (0.90%) and 3 (2.24%), respectively; excessive fatigue in 0 (0.00%) and 1 (0.75%); and musculoskeletal pain in 1 (0.90%) and 2 (1.49%). These results suggest both groups had similar safety profiles, with no increased risk associated with either treatment.
| Parameters | SC group (n = 111) | IET group (n = 134) | t | P value |
| Falls | 0 (0.00) | 1 (0.75) | None | 1 |
| Hypoglycemia | 1 (0.90) | 3 (2.24) | 0.1 | 0.752 |
| Excessive fatigue | 0 (0.00) | 1 (0.75) | None | 1 |
| Musculoskeletal pain | 1 (0.90) | 2 (1.49) | 0 | 1 |
This study investigates the impact of personalized exercise training on glycemic variability and nutritional status in diabetic patients undergoing chemotherapy for CRC. The observed reduction in glycemic variability, particularly in FBG levels, in the IET group compared to the SC group aligns with previous findings that physical activity improves insulin sensitivity and muscle glucose uptake[21-23]. The personalized nature of the exercise regimen, tailored to each patient’s physiological condition and treatment schedule, likely enhanced these effects. By incorporating aerobic (breathing) and resistance (lower extremity) training, the intervention likely promoted more effective blood glucose utilization during and after sessions, resulting in improved glycemic control.
Importantly, the reduction in HbA1c levels in the IET group underscores the long-term benefits of exercise on glycemic control over the study period. While acute exercise offers transient improvements in insulin sensitivity, sustained exercise leads to lasting metabolic benefits[24,25]. The tailored approach may have improved patient compliance and adherence, supported by regular healthcare guidance and individualized adjustments based on recovery progress. This likely contributed to the more pronounced improvements in glucose variability observed in the IET group[26].
The improvements in nutritional status, evidenced by increased levels of albumin, prealbumin, and other nutritional markers in the IET group, were particularly noteworthy. These enhancements may be attributed to several mechanisms. First, personalized exercise programs may have stimulated appetite and improved dietary intake, helping to counteract the cachexia commonly observed in cancer patients[27]. Additionally, structured physical activity could have promoted protein synthesis and supported muscle mass maintenance, thereby contributing indirectly to improved nutritional biomarker levels[28]. Moreover, exercise is known to enhance gastrointestinal motility and function, which may improve nutrient absorption and utilization, further supporting overall nutritional status[29].
The findings regarding intestinal permeability markers, such as zonulin and occludin, provide valuable insights. Zonulin, a key regulator of intestinal permeability, was significantly lower post-intervention in the IET group, suggesting that personalized exercise may help maintain or restore gut barrier function. This is important, as increased intestinal permeability and associated inflammation have been linked to poorer outcomes in both diabetes and cancer contexts[30]. Physical activity is known to exert anti-inflammatory effects, which may reduce both systemic and intestinal inflammation, thereby improving barrier function[31,32]. Enhanced gut health may also support better nutrient absorption, further contributing to the nutritional improvements observed.
The impact on LBP also warrants consideration. Elevated LBP levels post-exercise may reflect transient gut ischemia during physical exertion, allowing for endotoxin translocation. This acute-phase response contrasts with the sustained barrier restoration suggested by improvements in zonulin and occludin levels. Measuring LBP 24 hours post-exercise could help clarify its kinetics. By potentially reducing systemic endotoxin load over time, personalized exercise might contribute to lowering chronic inflammation. This hypothesis is consistent with the observed improvements in nutritional status and glycemic control.
The mechanisms by which personalized exercise elicits these beneficial effects are likely multifaceted and interconnected. In addition to physiological and metabolic improvements, the psychological benefits of exercise play an important role. Physical activity is known to enhance mood and alleviate symptoms of anxiety and depression, which are conditions commonly experienced by cancer patients. This psychological uplift may promote better treatment adherence and greater engagement in healthy lifestyle behaviors, thereby amplifying the positive outcomes observed in the IET group[33-35].
Integrating exercise into a comprehensive care plan reflects the principles of the biopsychosocial model of health, which emphasizes the interdependence of physical, psychological, and social well-being. As patients gain a greater sense of empowerment and self-efficacy through individualized exercise, their overall quality of life may improve. This enhancement in well-being could serve as a key driver of adherence and the observed effectiveness of the personalized exercise interventions in the study.
Although this study provides valuable insights into the benefits of personalized exercise training for diabetic patients undergoing chemotherapy for CRC, several limitations must be acknowledged. First, the relatively small sample size may limit the generalizability of the findings to broader populations. Moreover, the exclusion of patients with cardiorenal or hepatic comorbidities, which are conditions commonly seen in chemotherapy cohorts, and the restriction to participants with an ECOG performance status of ≤ 2, limit applicability to only healthier subpopulations. Caution is therefore warranted when extrapolating these findings to frail or multimorbid individuals. Second, the 2-week intervention period precludes evaluation of long-term outcomes, such as sustained HbA1c control, disease-free survival, or long-term nutritional improvements. Future trials should extend follow-up to at least 3 months to assess the durability of exercise-induced benefits. Third, the study did not stratify outcomes based on chemotherapy regimens (e.g., FOLFOX vs FOLFIRI), despite their differing metabolic and nutritional impacts. This unaccounted variability may confound the observed effects of exercise and should be addressed in future analyses.
Additionally, reliance on self-reported measures for dietary intake and exercise adherence introduces potential recall and reporting bias. Future studies should employ objective tools such as wearable activity trackers and dietary logs validated against biomarkers. Finally, the absence of body composition metrics (e.g., bioimpedance analysis) and functional assessments (e.g., grip strength) limits conclusions about the physiological mechanisms underlying the nutritional improvements. Integrating these parameters, alongside validated assessment tools such as subjective global assessment, would allow future research to more accurately differentiate between improvements in intake, absorption, and muscle mass/function.
This study highlights the potential of personalized exercise training as a valuable adjunctive therapeutic strategy for improving glycemic control and nutritional status in diabetic patients undergoing chemotherapy for CRC. The significant improvements observed in the IET group underscore the importance of tailoring exercise interventions to individual health profiles and functional capacities to maximize physiological benefits. These findings support the integration of personalized exercise regimens into standard oncological care, capitalizing on their synergistic effects with chemotherapy to optimize patient outcomes. As the healthcare field increasingly adopts holistic, patient-centered models, personalized exercise emerges as a promising approach that strengthens resilience against the multifaceted physiological burdens imposed by both cancer and its treatment.
| 1. | Benioudakis E, Karlafti E, Bekiaridou A, Didangelos T, Papavramidis TS. Gestational Diabetes, Colorectal Cancer, Bariatric Surgery, and Weight Loss among Diabetes Mellitus Patients: A Mini Review of the Interplay of Multispecies Probiotics. Nutrients. 2021;14:192. [RCA] [PubMed] [DOI] [Full Text] [Full Text (PDF)] [Cited by in Crossref: 14] [Cited by in RCA: 10] [Article Influence: 2.0] [Reference Citation Analysis (1)] |
| 2. | Cheng HC, Chang TK, Su WC, Tsai HL, Wang JY. Narrative review of the influence of diabetes mellitus and hyperglycemia on colorectal cancer risk and oncological outcomes. Transl Oncol. 2021;14:101089. [RCA] [PubMed] [DOI] [Full Text] [Full Text (PDF)] [Cited by in Crossref: 48] [Cited by in RCA: 57] [Article Influence: 11.4] [Reference Citation Analysis (0)] |
| 3. | de Andrade Mesquita L, Wayerbacher LF, Schwartsmann G, Gerchman F. Obesity, diabetes, and cancer: epidemiology, pathophysiology, and potential interventions. Arch Endocrinol Metab. 2023;67:e000647. [RCA] [PubMed] [DOI] [Full Text] [Cited by in RCA: 22] [Reference Citation Analysis (0)] |
| 4. | Harborg S, Kjærgaard KA, Thomsen RW, Borgquist S, Cronin-Fenton D, Hjorth CF. New Horizons: Epidemiology of Obesity, Diabetes Mellitus, and Cancer Prognosis. J Clin Endocrinol Metab. 2024;109:924-935. [RCA] [PubMed] [DOI] [Full Text] [Cited by in Crossref: 2] [Cited by in RCA: 67] [Article Influence: 33.5] [Reference Citation Analysis (2)] |
| 5. | Kim DS, Scherer PE. Obesity, Diabetes, and Increased Cancer Progression. Diabetes Metab J. 2021;45:799-812. [RCA] [PubMed] [DOI] [Full Text] [Full Text (PDF)] [Cited by in Crossref: 29] [Cited by in RCA: 204] [Article Influence: 40.8] [Reference Citation Analysis (5)] |
| 6. | Lawler T, Walts ZL, Steinwandel M, Lipworth L, Murff HJ, Zheng W, Warren Andersen S. Type 2 Diabetes and Colorectal Cancer Risk. JAMA Netw Open. 2023;6:e2343333. [RCA] [PubMed] [DOI] [Full Text] [Full Text (PDF)] [Cited by in Crossref: 8] [Cited by in RCA: 64] [Article Influence: 21.3] [Reference Citation Analysis (0)] |
| 7. | Murphy N, Song M, Papadimitriou N, Carreras-Torres R, Langenberg C, Martin RM, Tsilidis KK, Barroso I, Chen J, Frayling TM, Bull CJ, Vincent EE, Cotterchio M, Gruber SB, Pai RK, Newcomb PA, Perez-Cornago A, van Duijnhoven FJB, Van Guelpen B, Vodicka P, Wolk A, Wu AH, Peters U, Chan AT, Gunter MJ. Associations Between Glycemic Traits and Colorectal Cancer: A Mendelian Randomization Analysis. J Natl Cancer Inst. 2022;114:740-752. [RCA] [PubMed] [DOI] [Full Text] [Full Text (PDF)] [Cited by in Crossref: 35] [Cited by in RCA: 76] [Article Influence: 19.0] [Reference Citation Analysis (6)] |
| 8. | Pearson-Stuttard J, Papadimitriou N, Markozannes G, Cividini S, Kakourou A, Gill D, Rizos EC, Monori G, Ward HA, Kyrgiou M, Gunter MJ, Tsilidis KK. Type 2 Diabetes and Cancer: An Umbrella Review of Observational and Mendelian Randomization Studies. Cancer Epidemiol Biomarkers Prev. 2021;30:1218-1228. [RCA] [PubMed] [DOI] [Full Text] [Cited by in Crossref: 226] [Cited by in RCA: 197] [Article Influence: 39.4] [Reference Citation Analysis (0)] |
| 9. | Petrelli F, Ghidini M, Rausa E, Ghidini A, Cabiddu M, Borgonovo K, Ghilardi M, Parati MC, Pietrantonio F, Sganzerla P, Bossi AC. Survival of Colorectal Cancer Patients With Diabetes Mellitus: A Meta-Analysis. Can J Diabetes. 2021;45:186-197.e2. [RCA] [PubMed] [DOI] [Full Text] [Cited by in Crossref: 11] [Cited by in RCA: 35] [Article Influence: 5.8] [Reference Citation Analysis (0)] |
| 10. | Venugopal A, Carethers JM. Epidemiology and biology of early onset colorectal cancer. EXCLI J. 2022;21:162-182. [RCA] [PubMed] [DOI] [Full Text] [Full Text (PDF)] [Cited by in RCA: 40] [Reference Citation Analysis (0)] |
| 11. | Wang L, Wang W, Kaelber DC, Xu R, Berger NA. GLP-1 Receptor Agonists and Colorectal Cancer Risk in Drug-Naive Patients With Type 2 Diabetes, With and Without Overweight/Obesity. JAMA Oncol. 2024;10:256-258. [RCA] [PubMed] [DOI] [Full Text] [Full Text (PDF)] [Cited by in Crossref: 4] [Cited by in RCA: 111] [Article Influence: 55.5] [Reference Citation Analysis (0)] |
| 12. | Bharti A, Shekhar R, Prakash P, Kumari S, Kumar S. Poor Glycemic Control Affecting Screening of Prostate Carcinoma. Cureus. 2024;16:e58680. [RCA] [PubMed] [DOI] [Full Text] [Cited by in RCA: 3] [Reference Citation Analysis (0)] |
| 13. | Jeon CY, Kim S, Lin YC, Risch HA, Goodarzi MO, Nuckols TK, Freedland SJ, Pandol SJ, Pisegna JR. Prediction of Pancreatic Cancer in Diabetes Patients with Worsening Glycemic Control. Cancer Epidemiol Biomarkers Prev. 2022;31:242-253. [RCA] [PubMed] [DOI] [Full Text] [Full Text (PDF)] [Cited by in Crossref: 10] [Cited by in RCA: 15] [Article Influence: 3.8] [Reference Citation Analysis (0)] |
| 14. | Ligibel JA, Bohlke K, May AM, Clinton SK, Demark-Wahnefried W, Gilchrist SC, Irwin ML, Late M, Mansfield S, Marshall TF, Meyerhardt JA, Thomson CA, Wood WA, Alfano CM. Exercise, Diet, and Weight Management During Cancer Treatment: ASCO Guideline. J Clin Oncol. 2022;40:2491-2507. [RCA] [PubMed] [DOI] [Full Text] [Cited by in Crossref: 513] [Cited by in RCA: 460] [Article Influence: 115.0] [Reference Citation Analysis (0)] |
| 15. | Lavery JA, Boutros PC, Scott JM, Tammela T, Moskowitz CS, Jones LW. Pan-Cancer Analysis of Postdiagnosis Exercise and Mortality. J Clin Oncol. 2023;41:4982-4992. [RCA] [PubMed] [DOI] [Full Text] [Full Text (PDF)] [Cited by in Crossref: 24] [Cited by in RCA: 29] [Article Influence: 9.7] [Reference Citation Analysis (0)] |
| 16. | Michael CM, Lehrer EJ, Schmitz KH, Zaorsky NG. Prehabilitation exercise therapy for cancer: A systematic review and meta-analysis. Cancer Med. 2021;10:4195-4205. [RCA] [PubMed] [DOI] [Full Text] [Full Text (PDF)] [Cited by in Crossref: 28] [Cited by in RCA: 105] [Article Influence: 21.0] [Reference Citation Analysis (1)] |
| 17. | Shaukat A, Kahi CJ, Burke CA, Rabeneck L, Sauer BG, Rex DK. ACG Clinical Guidelines: Colorectal Cancer Screening 2021. Am J Gastroenterol. 2021;116:458-479. [RCA] [PubMed] [DOI] [Full Text] [Cited by in Crossref: 675] [Cited by in RCA: 576] [Article Influence: 115.2] [Reference Citation Analysis (4)] |
| 18. | ElSayed NA, Aleppo G, Aroda VR, Bannuru RR, Brown FM, Bruemmer D, Collins BS, Hilliard ME, Isaacs D, Johnson EL, Kahan S, Khunti K, Leon J, Lyons SK, Perry ML, Prahalad P, Pratley RE, Seley JJ, Stanton RC, Gabbay RA; on behalf of the American Diabetes Association. 2. Classification and Diagnosis of Diabetes: Standards of Care in Diabetes-2023. Diabetes Care. 2023;46:S19-S40. [RCA] [PubMed] [DOI] [Full Text] [Cited by in Crossref: 2057] [Cited by in RCA: 1732] [Article Influence: 577.3] [Reference Citation Analysis (6)] |
| 19. | Xue GQ, Li CP, Lv A, Wu JH, Tian XY, Qiu H, Hao C. Prognostic Nutritional Index (PNI): A More Promising Nutritional Predictor for Patients Undergoing Surgery for Retroperitoneal Liposarcoma. Cancer Manag Res. 2024;16:1021-1030. [RCA] [PubMed] [DOI] [Full Text] [Full Text (PDF)] [Cited by in RCA: 4] [Reference Citation Analysis (0)] |
| 20. | Seckiner S, Bas M, Simsir IY, Ozgur S, Akcay Y, Aslan CG, Kucukerdonmez O, Cetinkalp S. Effects of Dietary Carbohydrate Concentration and Glycemic Index on Blood Glucose Variability and Free Fatty Acids in Individuals with Type 1 Diabetes. Nutrients. 2024;16:1383. [RCA] [PubMed] [DOI] [Full Text] [Cited by in RCA: 3] [Reference Citation Analysis (0)] |
| 21. | Di Murro E, Di Giuseppe G, Soldovieri L, Moffa S, Improta I, Capece U, Nista EC, Cinti F, Ciccarelli G, Brunetti M, Gasbarrini A, Pontecorvi A, Giaccari A, Mezza T. Physical Activity and Type 2 Diabetes: In Search of a Personalized Approach to Improving β-Cell Function. Nutrients. 2023;15:4202. [RCA] [PubMed] [DOI] [Full Text] [Cited by in RCA: 17] [Reference Citation Analysis (0)] |
| 22. | Jaramillo AP, Ibrahimli S, Castells J, Jaramillo L, Moncada D, Revilla Huerta JC. Physical Activity as a Lifestyle Modification in Patients With Multiple Comorbidities: Emphasizing More on Obese, Prediabetic, and Type 2 Diabetes Mellitus Patients. Cureus. 2023;15:e41356. [RCA] [PubMed] [DOI] [Full Text] [Cited by in RCA: 1] [Reference Citation Analysis (0)] |
| 23. | Goyal Mehra C, Raymond AM, Prabhu R. A personalized multi-interventional approach focusing on customized nutrition, progressive fitness, and lifestyle modification resulted in the reduction of HbA1c, fasting blood sugar and weight in type 2 diabetes: a retrospective study. BMC Endocr Disord. 2022;22:290. [RCA] [PubMed] [DOI] [Full Text] [Cited by in RCA: 9] [Reference Citation Analysis (0)] |
| 24. | Zhang C, Yang J. Personalizing Physical Activity for Glucose Control Among Individuals With Type 2 Diabetes: Are We There Yet? Diabetes Care. 2024;47:196-198. [RCA] [PubMed] [DOI] [Full Text] [Full Text (PDF)] [Cited by in Crossref: 11] [Cited by in RCA: 8] [Article Influence: 4.0] [Reference Citation Analysis (0)] |
| 25. | White L, Kirwan M, Christie V, Hurst L, Gwynne K. The Effectiveness of Clinician-Led Community-Based Group Exercise Interventions on Health Outcomes in Adults with Type 2 Diabetes Mellitus: A Systematic Review and Meta-Analysis. Int J Environ Res Public Health. 2024;21:601. [RCA] [PubMed] [DOI] [Full Text] [Cited by in RCA: 5] [Reference Citation Analysis (0)] |
| 26. | Deichmann J, Bachmann S, Burckhardt MA, Pfister M, Szinnai G, Kaltenbach HM. New model of glucose-insulin regulation characterizes effects of physical activity and facilitates personalized treatment evaluation in children and adults with type 1 diabetes. PLoS Comput Biol. 2023;19:e1010289. [RCA] [PubMed] [DOI] [Full Text] [Cited by in RCA: 8] [Reference Citation Analysis (0)] |
| 27. | Deng N, Reyes-Uribe L, Fahrmann JF, Thoman WS, Munsell MF, Dennison JB, Murage E, Wu R, Hawk ET, Thirumurthi S, Lynch PM, Dieli-Conwright CM, Lazar AJ, Jindal S, Chu K, Chelvanambi M, Basen-Engquist K, Li Y, Wargo JA, McAllister F, Allison JP, Sharma P, Sinha KM, Hanash S, Gilchrist SC, Vilar E. Exercise Training Reduces the Inflammatory Response and Promotes Intestinal Mucosa-Associated Immunity in Lynch Syndrome. Clin Cancer Res. 2023;29:4361-4372. [RCA] [PubMed] [DOI] [Full Text] [Cited by in RCA: 17] [Reference Citation Analysis (0)] |
| 28. | Farley MJ, Boytar AN, Adlard KN, Salisbury CE, Hart NH, Schaumberg MA, Jenkins DG, Skinner TL. Interleukin-15 and high-intensity exercise: relationship with inflammation, body composition and fitness in cancer survivors. J Physiol. 2024;602:5203-5215. [RCA] [PubMed] [DOI] [Full Text] [Cited by in Crossref: 11] [Cited by in RCA: 8] [Article Influence: 4.0] [Reference Citation Analysis (0)] |
| 29. | Orange ST, Hicks KM, Saxton JM. Effectiveness of diet and physical activity interventions amongst adults attending colorectal and breast cancer screening: a systematic review and meta-analysis. Cancer Causes Control. 2021;32:13-26. [RCA] [PubMed] [DOI] [Full Text] [Full Text (PDF)] [Cited by in Crossref: 2] [Cited by in RCA: 14] [Article Influence: 2.3] [Reference Citation Analysis (0)] |
| 30. | Dmytriv TR, Storey KB, Lushchak VI. Intestinal barrier permeability: the influence of gut microbiota, nutrition, and exercise. Front Physiol. 2024;15:1380713. [RCA] [PubMed] [DOI] [Full Text] [Full Text (PDF)] [Cited by in Crossref: 163] [Cited by in RCA: 141] [Article Influence: 70.5] [Reference Citation Analysis (0)] |
| 31. | Wegierska AE, Charitos IA, Topi S, Potenza MA, Montagnani M, Santacroce L. The Connection Between Physical Exercise and Gut Microbiota: Implications for Competitive Sports Athletes. Sports Med. 2022;52:2355-2369. [RCA] [PubMed] [DOI] [Full Text] [Full Text (PDF)] [Cited by in Crossref: 182] [Cited by in RCA: 156] [Article Influence: 39.0] [Reference Citation Analysis (10)] |
| 32. | Bragina TV, Elizarova EV, Sheveleva SA. [Intestinal microbiote of athletes]. Vopr Pitan. 2021;90:36-52. [RCA] [PubMed] [DOI] [Full Text] [Cited by in Crossref: 2] [Cited by in RCA: 4] [Article Influence: 0.8] [Reference Citation Analysis (0)] |
| 33. | Machado P, Pimenta S, Oliveiros B, Ferreira JP, Martins RA, Cruz J. Effect of Exercise Training on Quality of Life after Colorectal and Lung Cancer Surgery: A Meta-Analysis. Cancers (Basel). 2021;13:4975. [RCA] [PubMed] [DOI] [Full Text] [Full Text (PDF)] [Cited by in Crossref: 9] [Cited by in RCA: 23] [Article Influence: 4.6] [Reference Citation Analysis (0)] |
| 34. | Machado P, Morgado M, Raposo J, Mendes M, Silva CG, Morais N. Effectiveness of exercise training on cancer-related fatigue in colorectal cancer survivors: a systematic review and meta-analysis of randomized controlled trials. Support Care Cancer. 2022;30:5601-5613. [RCA] [PubMed] [DOI] [Full Text] [Cited by in RCA: 21] [Reference Citation Analysis (0)] |
| 35. | Abdul Razak N, Azhar ZI, Baharuddin IH, Ismail Z, Mohd Azman ZA, Abdul Manap SA, Ramli N. Does Exercise Improve Health-Related Quality of Life of Colorectal Cancer Survivors? A Systematic Review and Meta-Analysis. Asian Pac J Cancer Prev. 2024;25:379-391. [RCA] [PubMed] [DOI] [Full Text] [Cited by in RCA: 9] [Reference Citation Analysis (0)] |
Open Access: This article is an open-access article that was selected by an in-house editor and fully peer-reviewed by external reviewers. It is distributed in accordance with the Creative Commons Attribution NonCommercial (CC BY-NC 4.0) license, which permits others to distribute, remix, adapt, build upon this work non-commercially, and license their derivative works on different terms, provided the original work is properly cited and the use is non-commercial. See: https://creativecommons.org/Licenses/by-nc/4.0/