Copyright
©The Author(s) 2017.
World J Diabetes. Apr 15, 2017; 8(4): 135-142
Published online Apr 15, 2017. doi: 10.4239/wjd.v8.i4.135
Published online Apr 15, 2017. doi: 10.4239/wjd.v8.i4.135
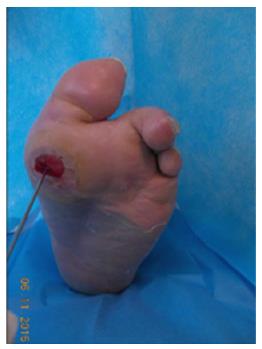
Figure 1 Positive probe-to-bone test for first metatarsal head.
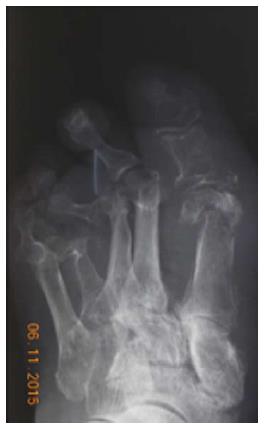
Figure 2 X-ray showing destruction of first metatarsal head.
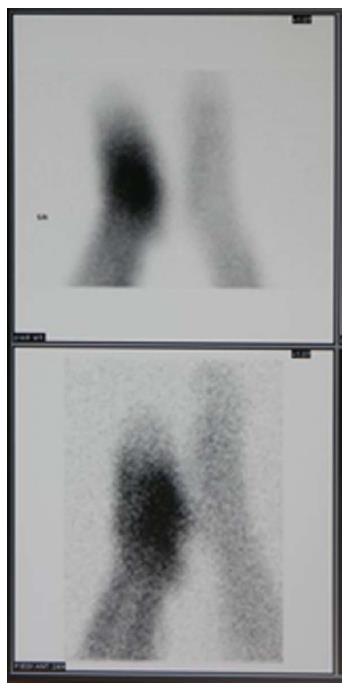
Figure 3 Leucocyte scan images showing area of increased uptake strongly suggestive of osteomyelitis in left mid and hindfoot.
Figure 4 Positron emission tomography images demonstrating diffuse increased of 18F-2-fluoro-2-deoxy-D-glucose uptake of the right foot suggestive of severe osteomyelitis.
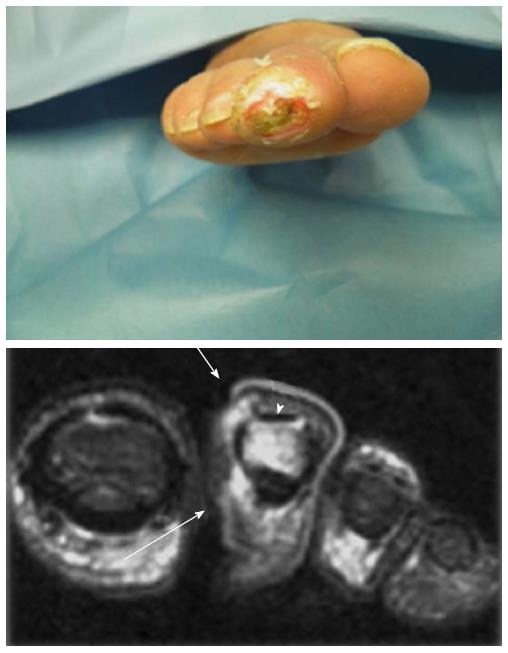
Figure 5 Osteomyelitis of second toe (distal phalanx) revealed by magnetic resonance imaging.
The arrows and the arrowhead show the bone involvement of distal phalanx (second toe).
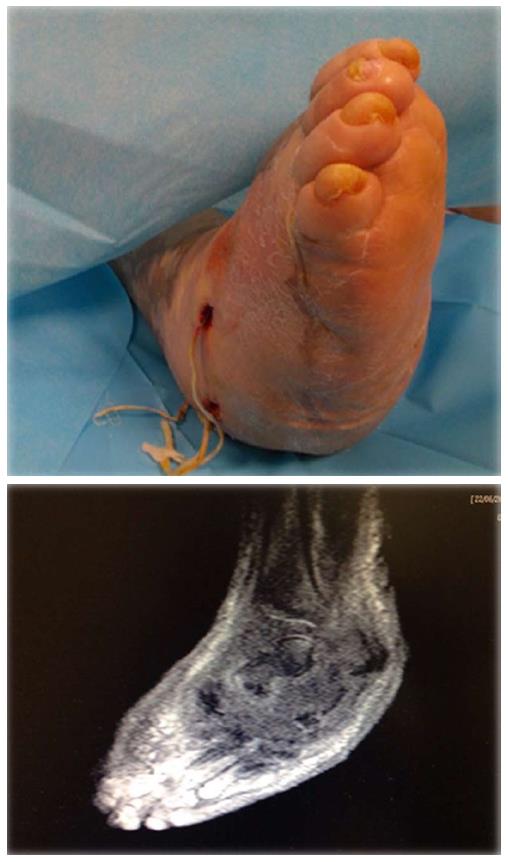
Figure 6 Severe osteomyelitis involving midfoot, hindfoot and ankle detected by magnetic resonance imaging.
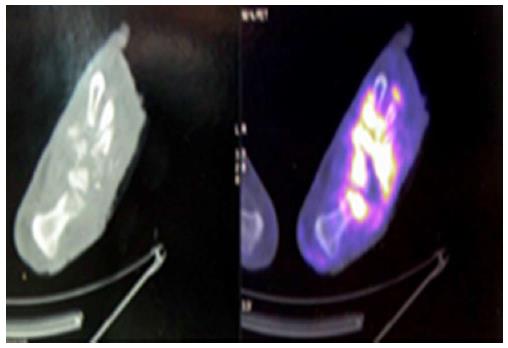
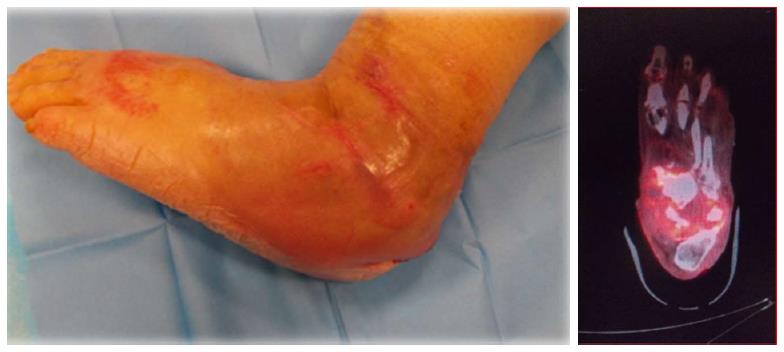
Figure 7 Severe osteomyelitis of forefoot, mid and hindfoot by positron emission tomography-computed tomography.
- Citation: Giurato L, Meloni M, Izzo V, Uccioli L. Osteomyelitis in diabetic foot: A comprehensive overview. World J Diabetes 2017; 8(4): 135-142
- URL: https://www.wjgnet.com/1948-9358/full/v8/i4/135.htm
- DOI: https://dx.doi.org/10.4239/wjd.v8.i4.135


