Copyright
©2013 Baishideng Publishing Group Co.
World J Diabetes. Oct 15, 2013; 4(5): 227-230
Published online Oct 15, 2013. doi: 10.4239/wjd.v4.i5.227
Published online Oct 15, 2013. doi: 10.4239/wjd.v4.i5.227
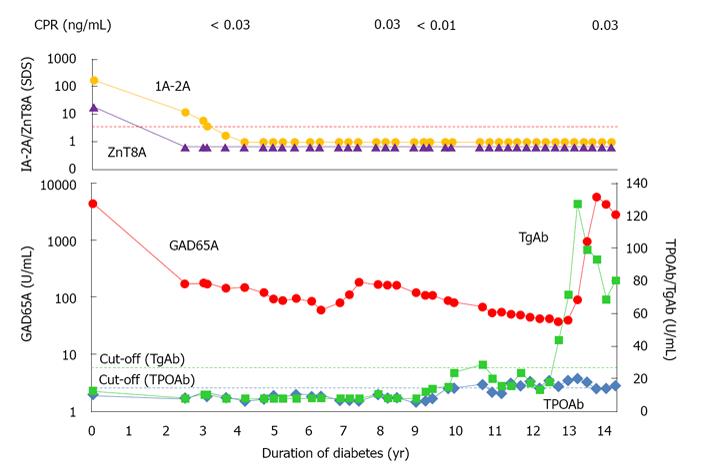
Figure 1 Time course of anti-islet autoantibodies and anti-thyroid antibodies.
Dotted lines indicate the cut-off values of antibodies. The levels of IA-2A and ZnT8A were expressed as SDS. IA-2A: Insulinoma-associated antigen-2 autoantibodies; ZnT8A: Zinc transporter-8 autoantibodies; SDS: Standard deviation score; GAD: Glutamic acid decarboxylase.
- Citation: Kawasaki E, Yasui JI, Tsurumaru M, Takashima H, Ikeoka T, Mori F, Akazawa S, Ueki I, Kobayashi M, Kuwahara H, Abiru N, Yamasaki H, Kawakami A. Sequential elevation of autoantibodies to thyroglobulin and glutamic acid decarboxylase in type 1 diabetes. World J Diabetes 2013; 4(5): 227-230
- URL: https://www.wjgnet.com/1948-9358/full/v4/i5/227.htm
- DOI: https://dx.doi.org/10.4239/wjd.v4.i5.227


