
















Copyright: ©Author(s) 2026.
World J Diabetes. Jul 15, 2026; 17(7): 119780
Published online Jul 15, 2026. doi: 10.4239/wjd.119780
Published online Jul 15, 2026. doi: 10.4239/wjd.119780
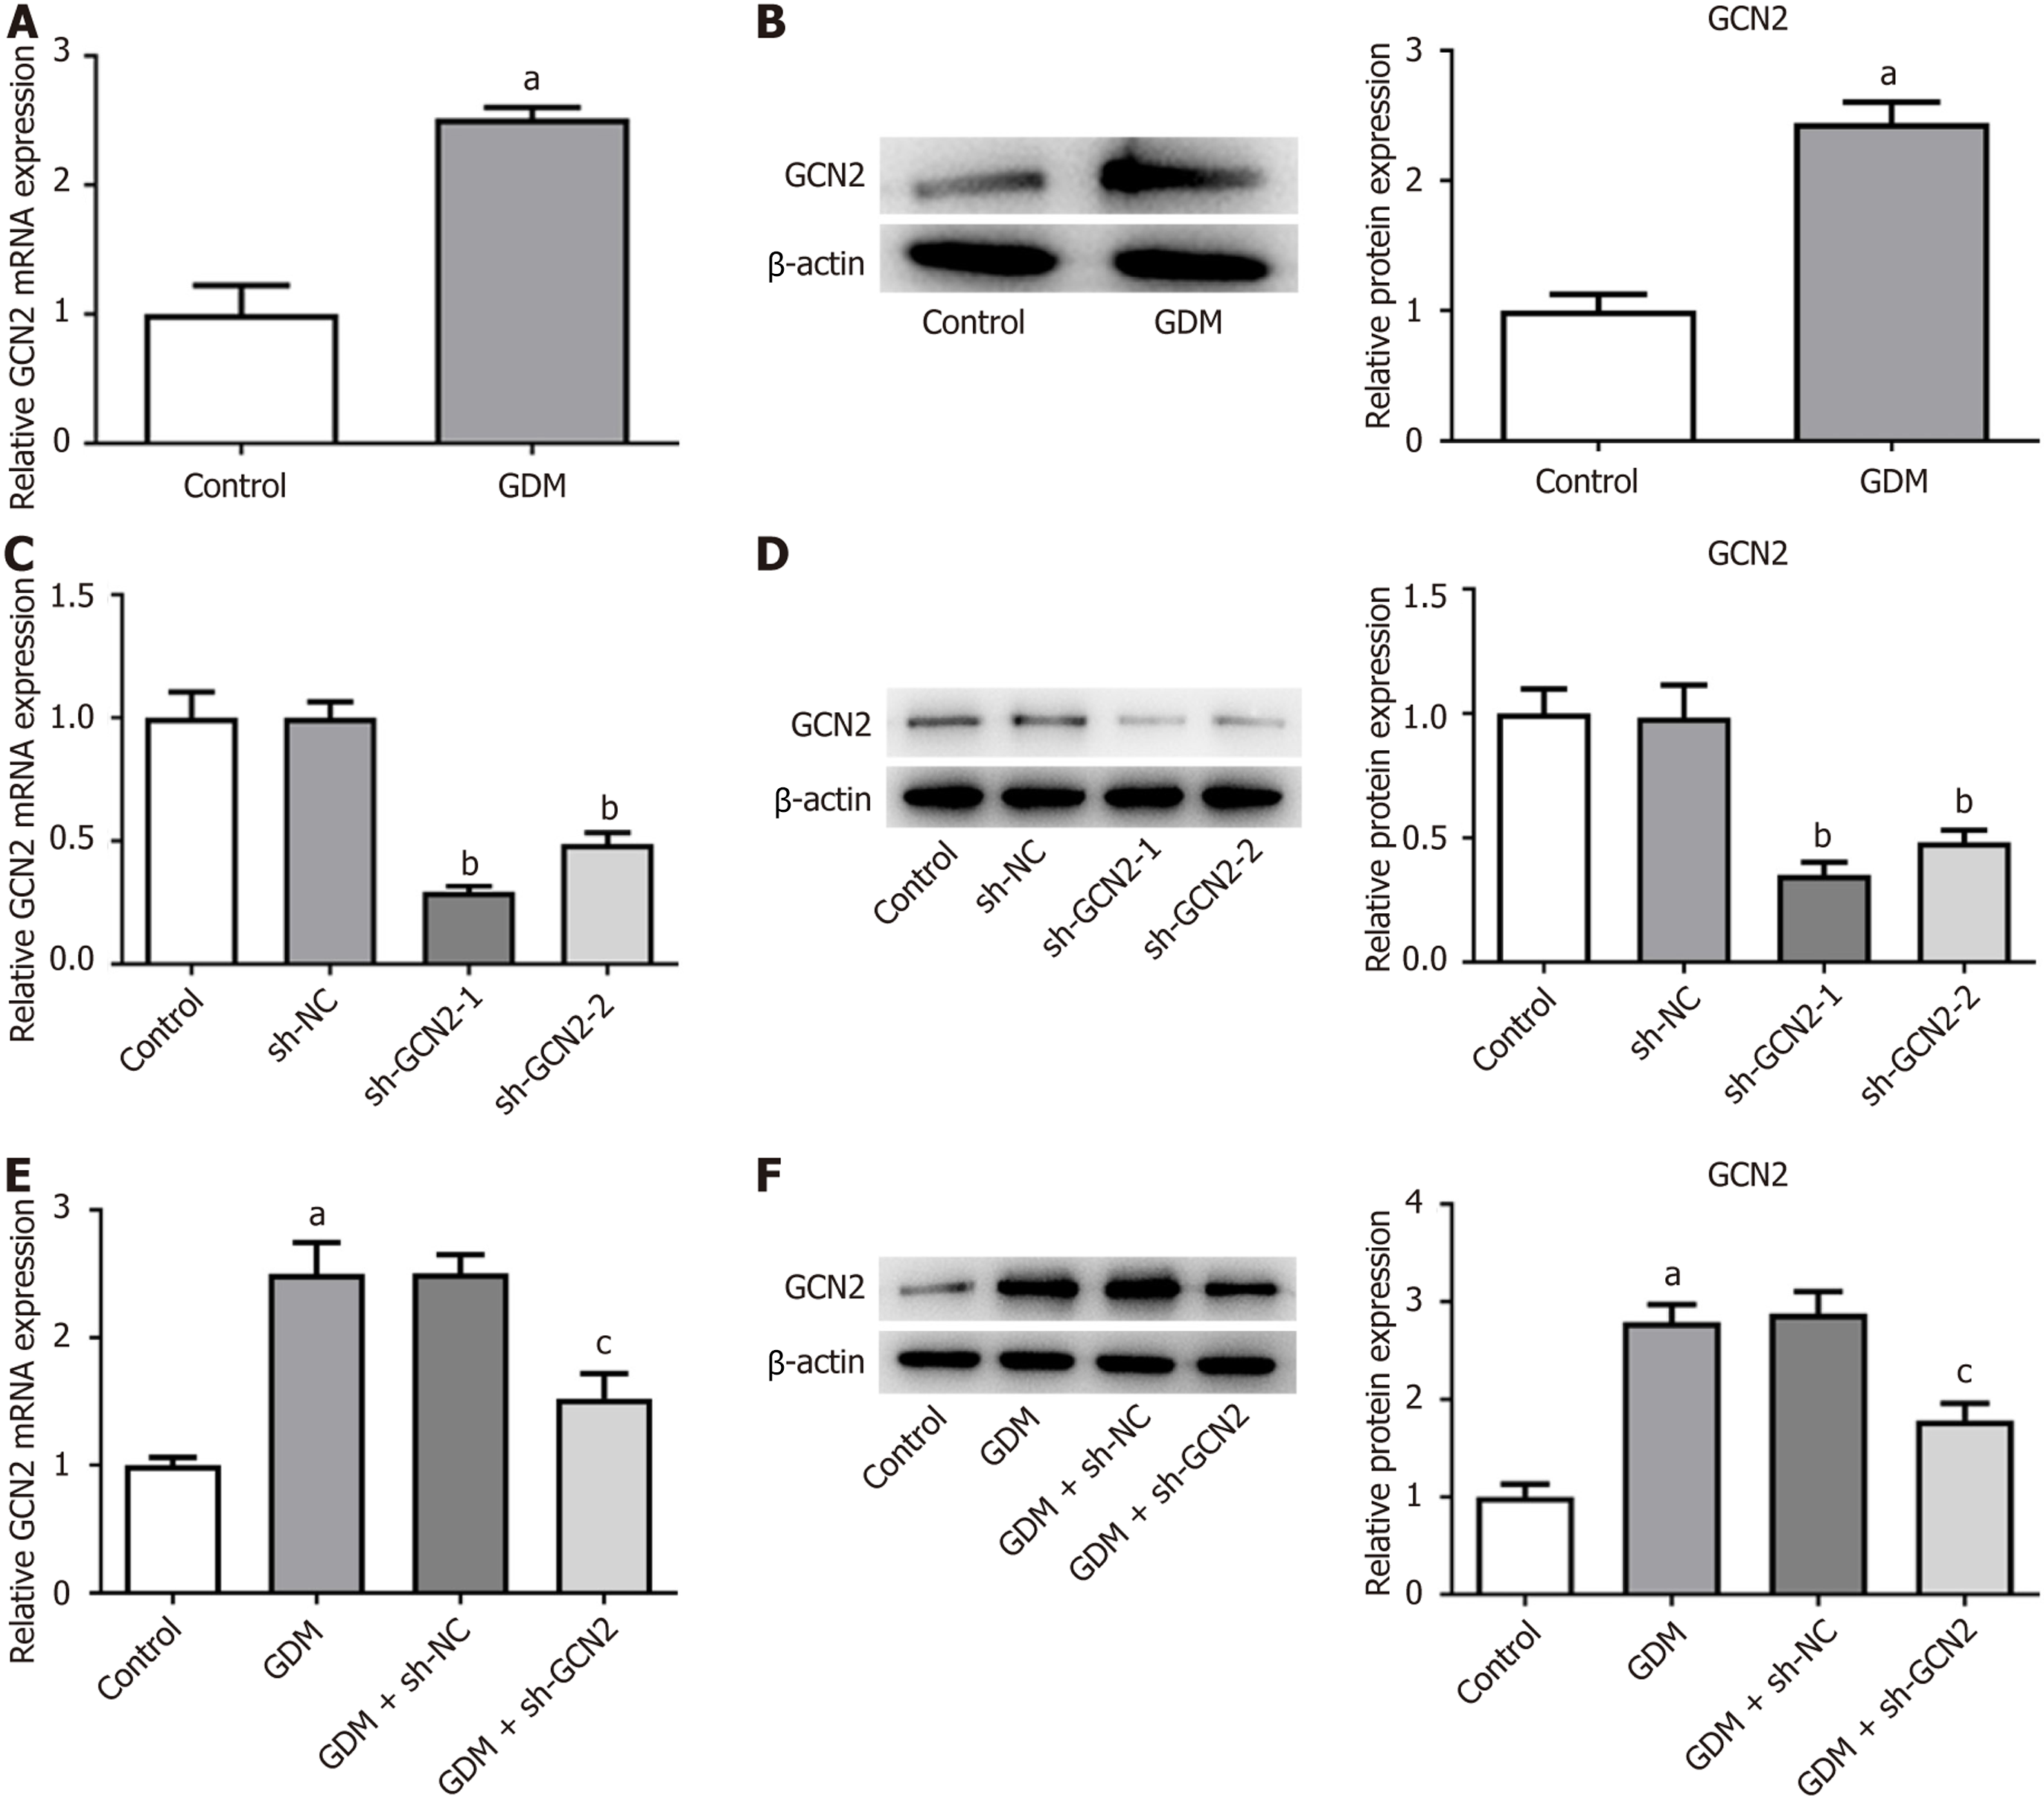
Figure 1 General control nonderepressible 2 is upregulated in placental tissues of gestational diabetes mellitus mice.
A and B: Reverse transcription quantitative PCR (RT-qPCR; A) and Western blotting analysis (B) of general control nonderepressible 2 (GCN2) expression; C and D: RT-qPCR (C) and Western blotting analysis (D) of GCN2 knockdown efficiency; E and F: RT-qPCR (E) and Western blotting (F) analysis of GCN2 expression in placental tissues of gestational diabetes mellitus (GDM) mice. aP < 0.001 vs control; bP < 0.001 vs sh-negative control (NC); cP < 0.001 vs GDM + sh-NC. GCN2: General control non
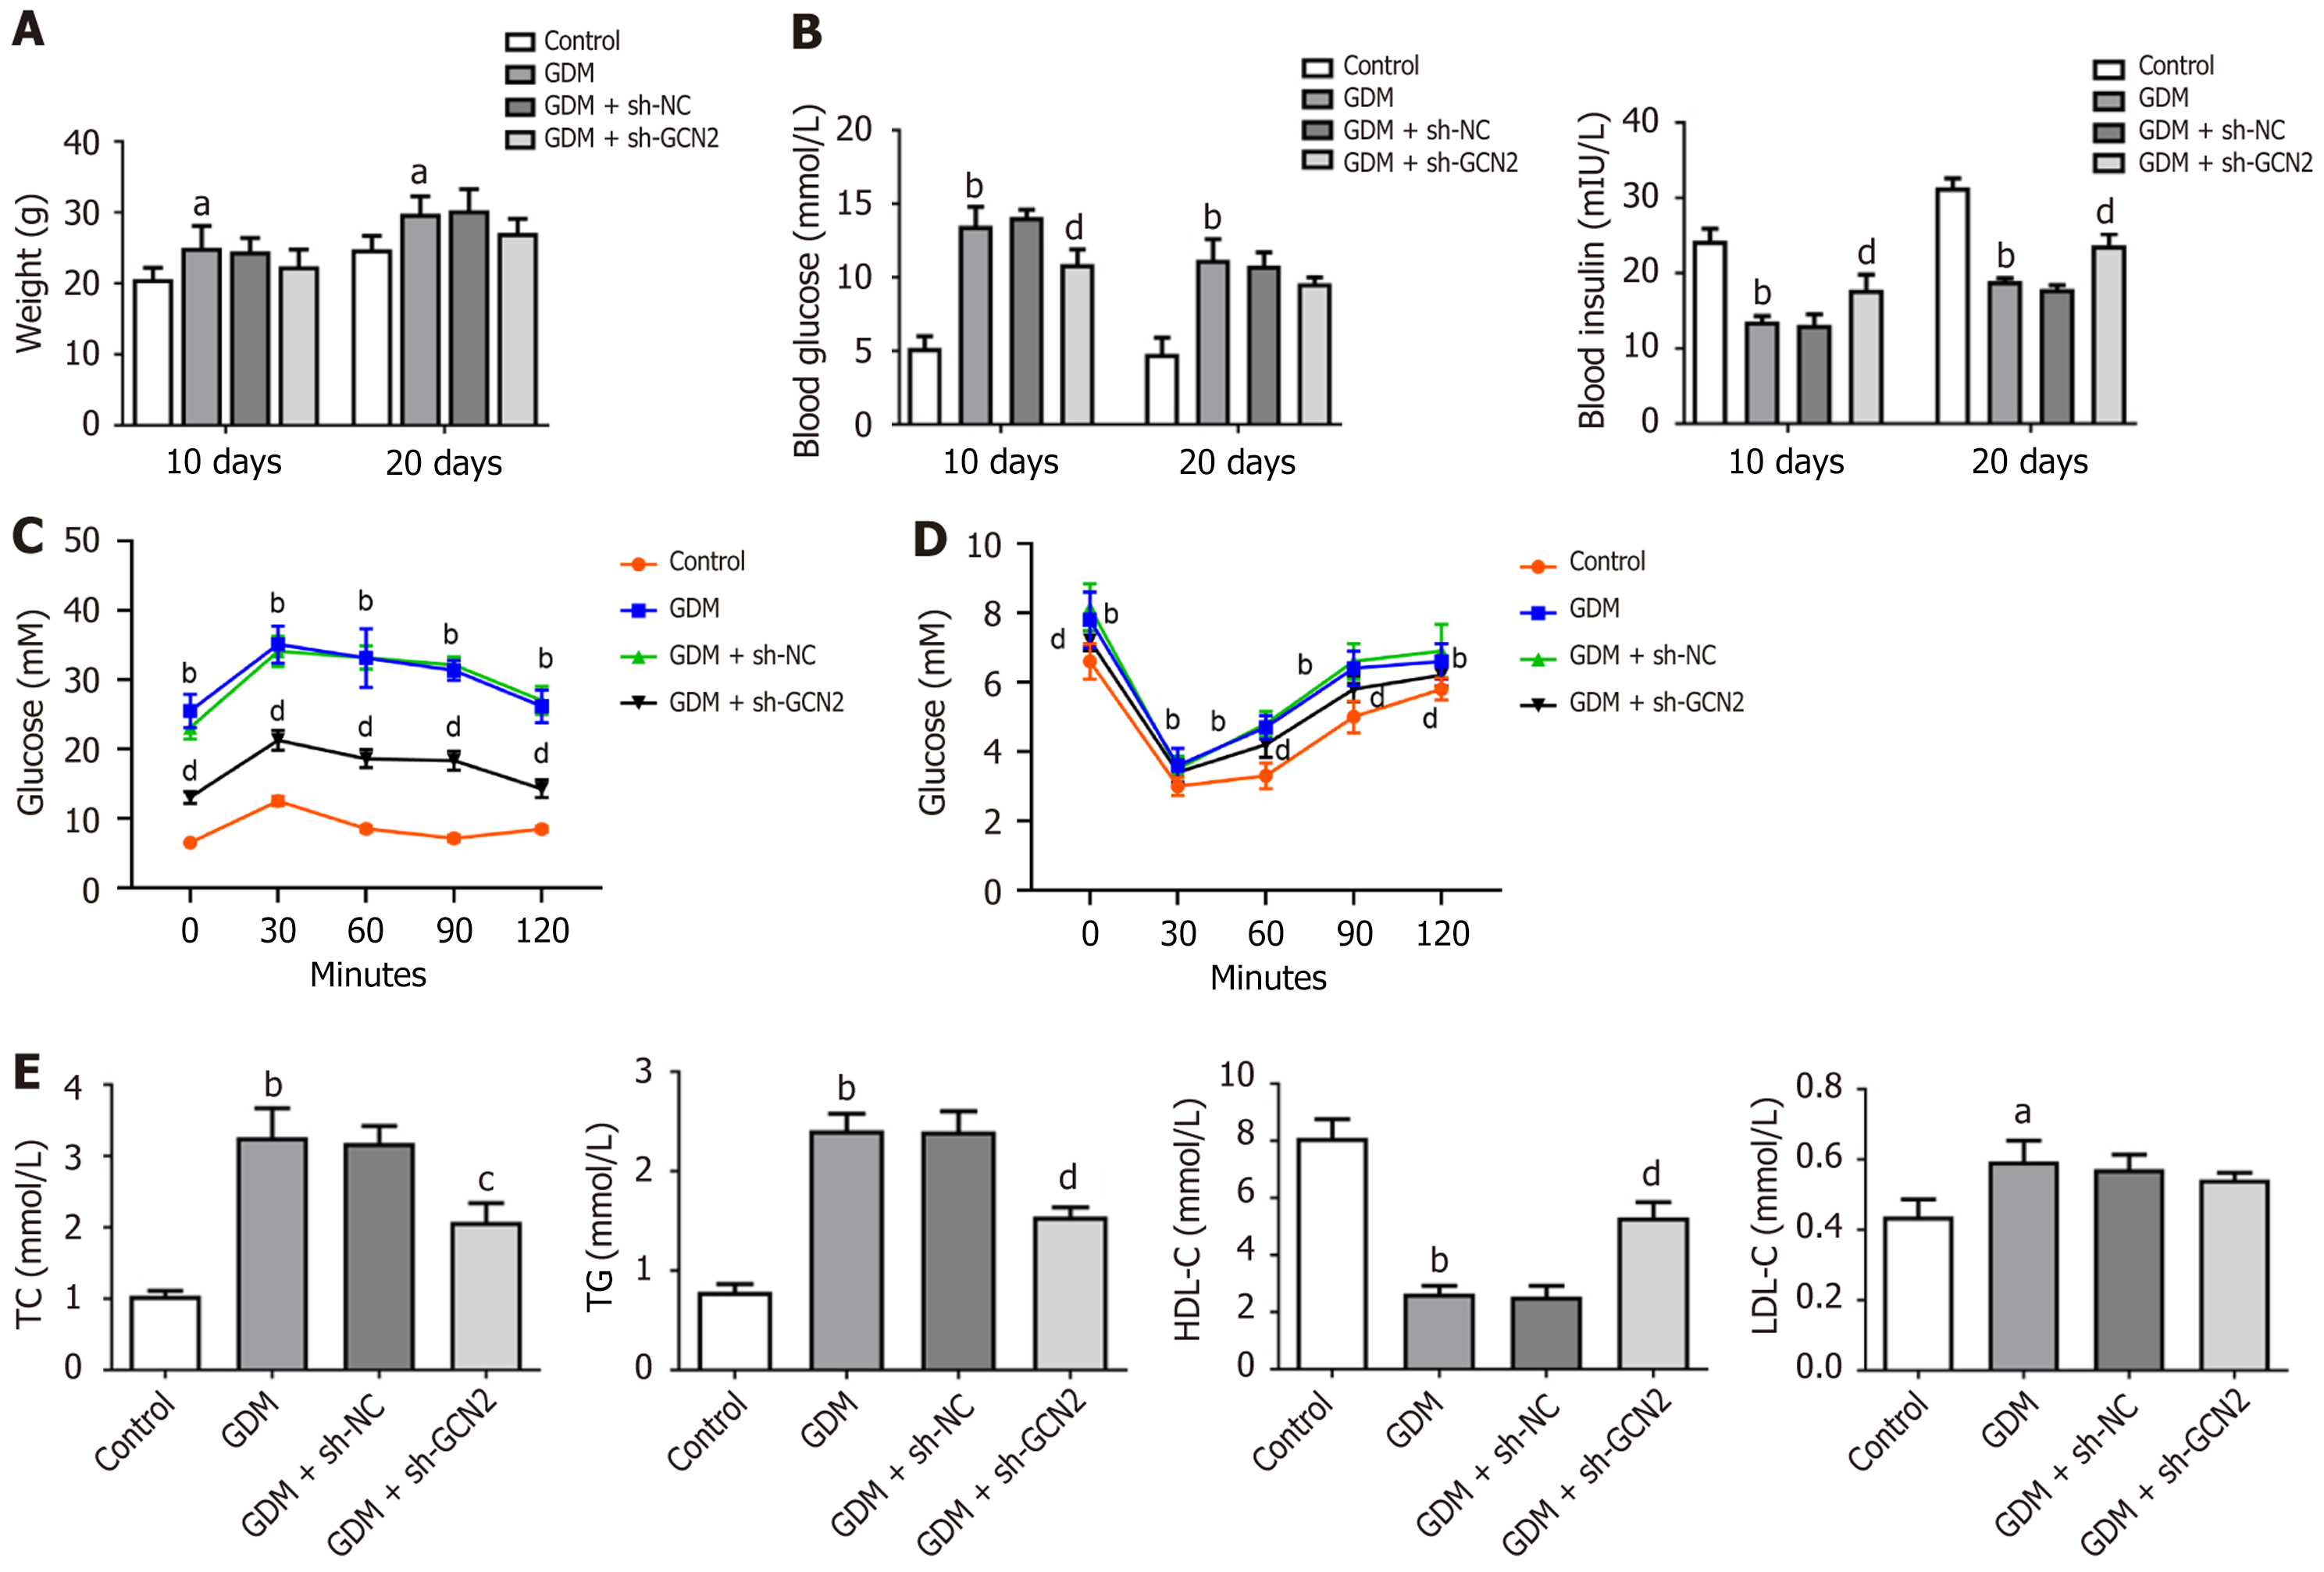
Figure 2 General control nonderepressible 2 knockdown improved metabolic parameters in gestational diabetes mellitus mice.
A: Body weight; B: Blood glucose and insulin levels; C: Glucose tolerance test; D: Insulin tolerance test; E: Plasma lipid levels. aP < 0.05 vs control; bP < 0.001 vs control; cP < 0.01 vs gestational diabetes mellitus (GDM) + sh-negative control; dP < 0.001 vs GDM + sh-negative control. GCN2: General control nonderepressible 2; GDM: Gestational diabetes mellitus; NC: Negative control; TC: Total cholesterol; TG: Triglyceride; LDL-C: Low-density lipoprotein cholesterol; HDL-C: High-density lipoprotein cholesterol.
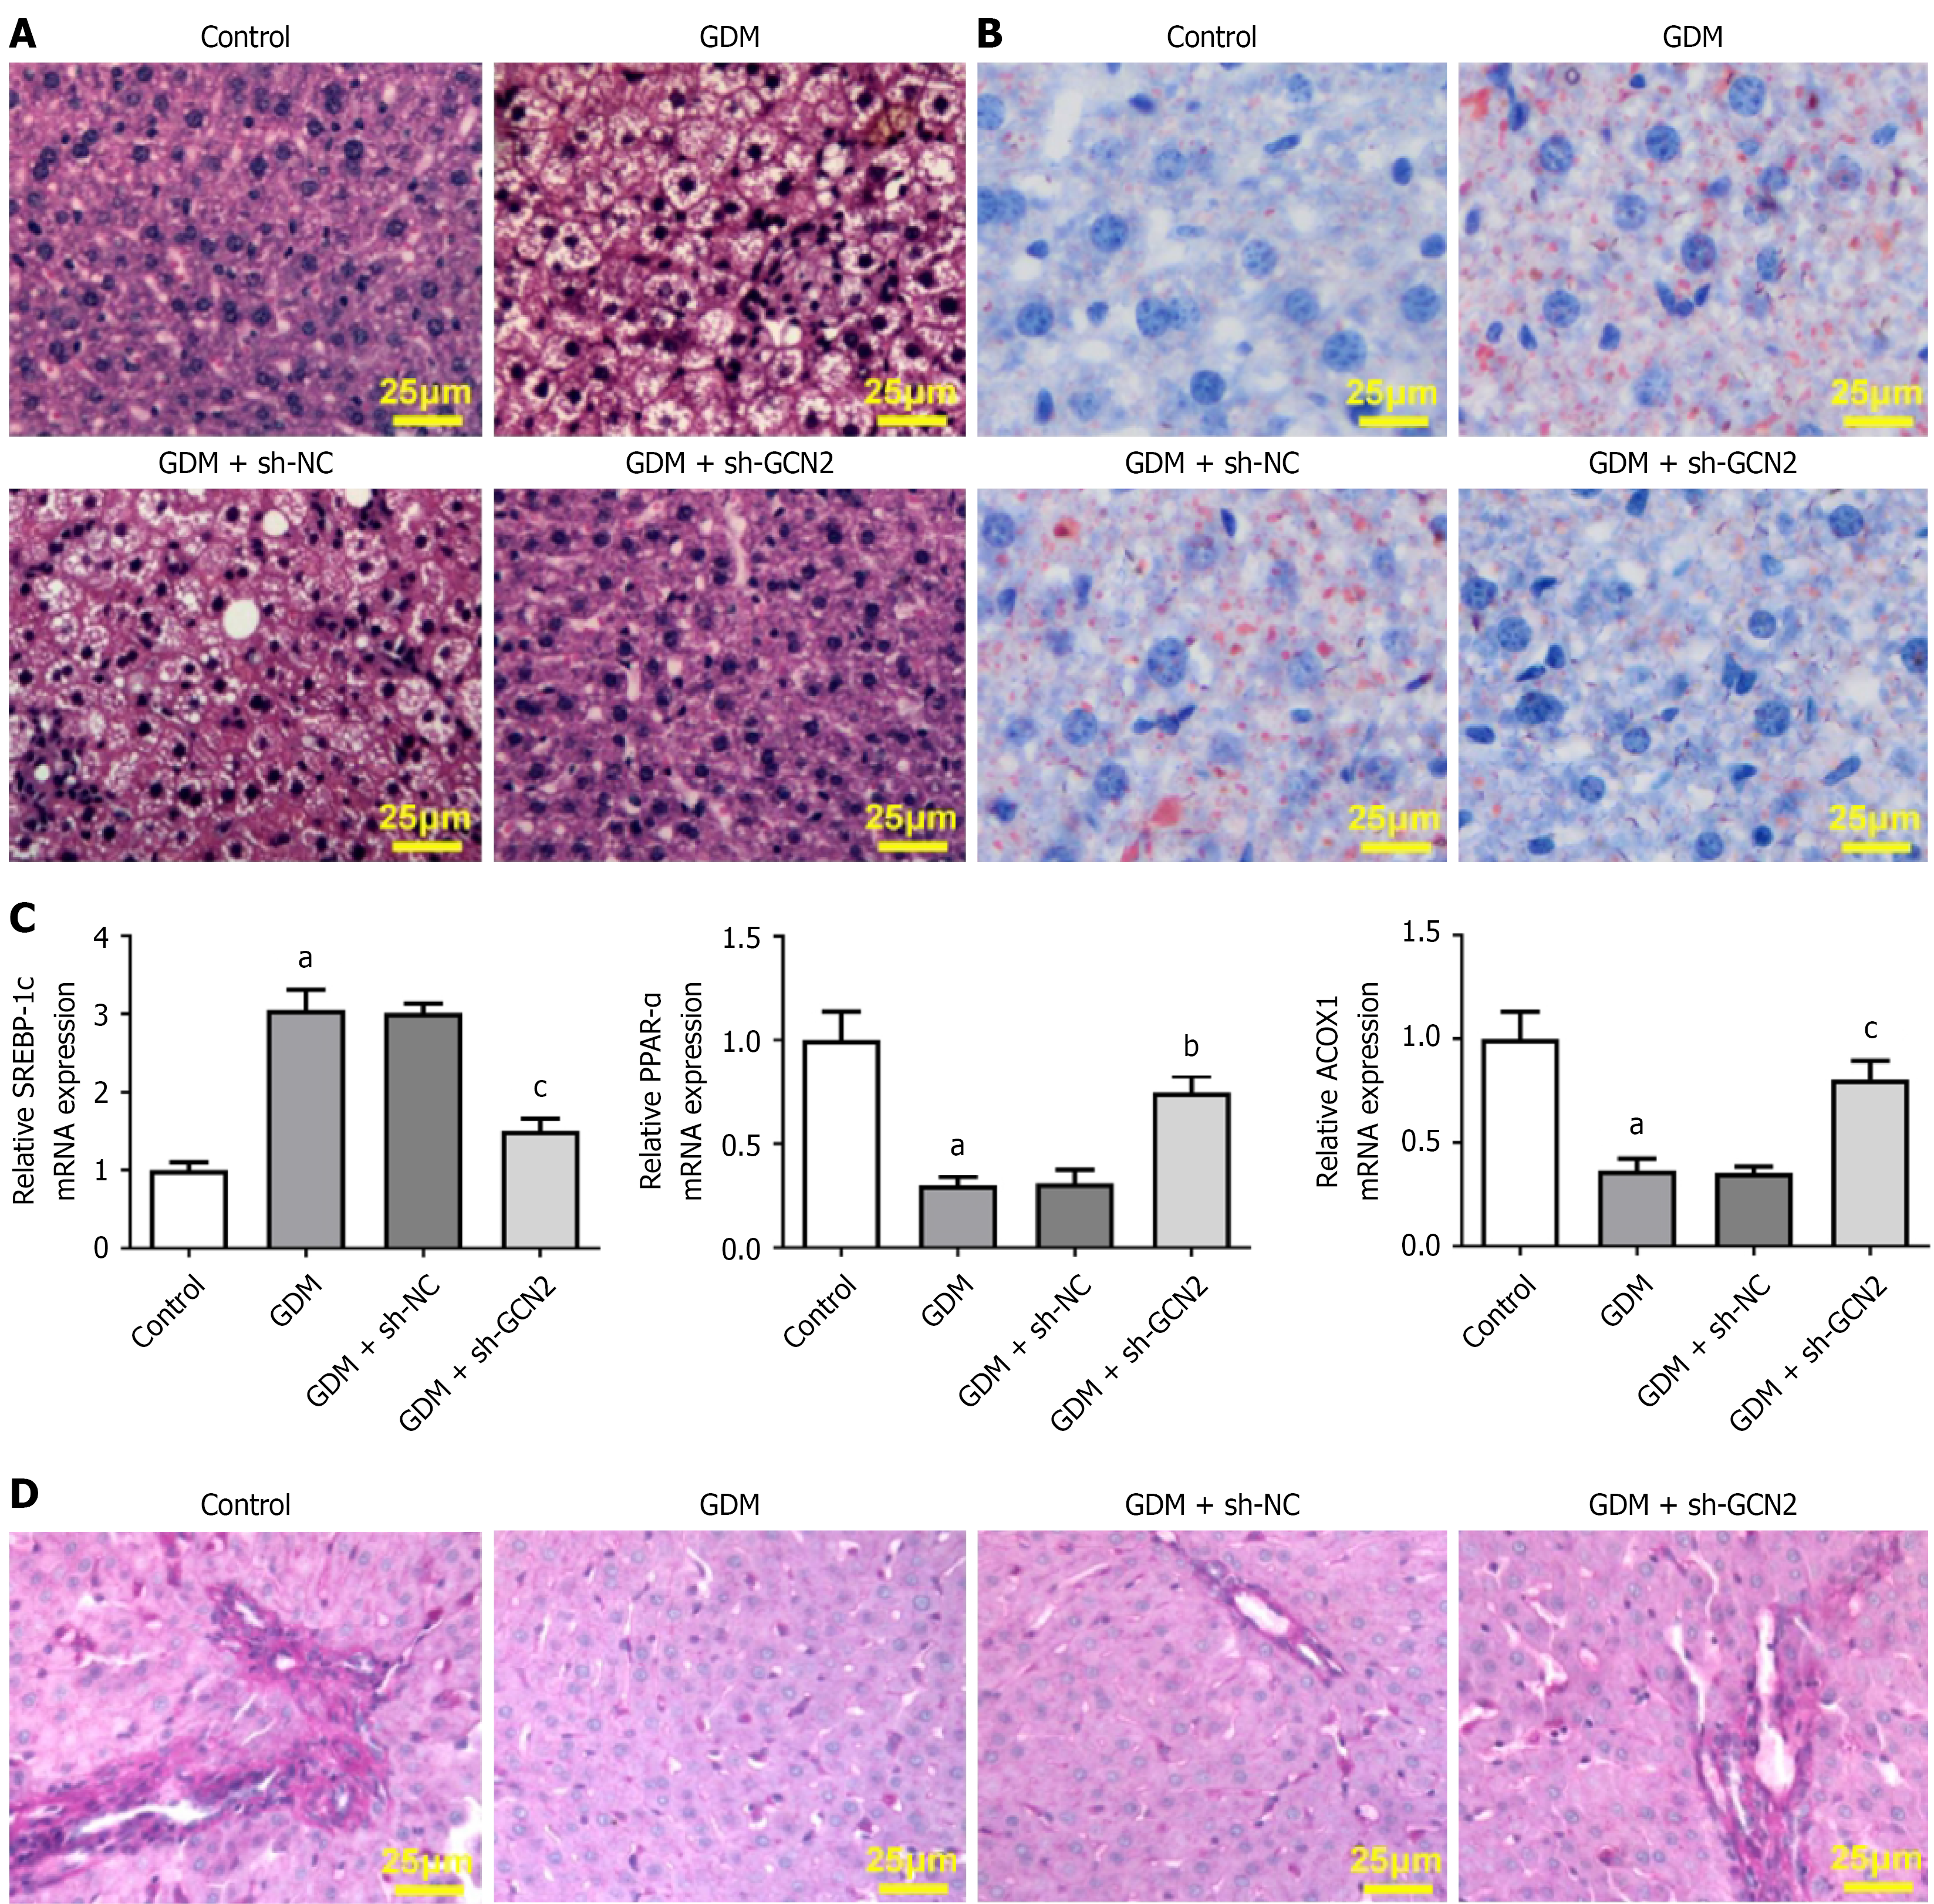
Figure 3 General control nonderepressible 2 knockdown reduced hepatic lipid deposition and restored glycogen accumulation in ges
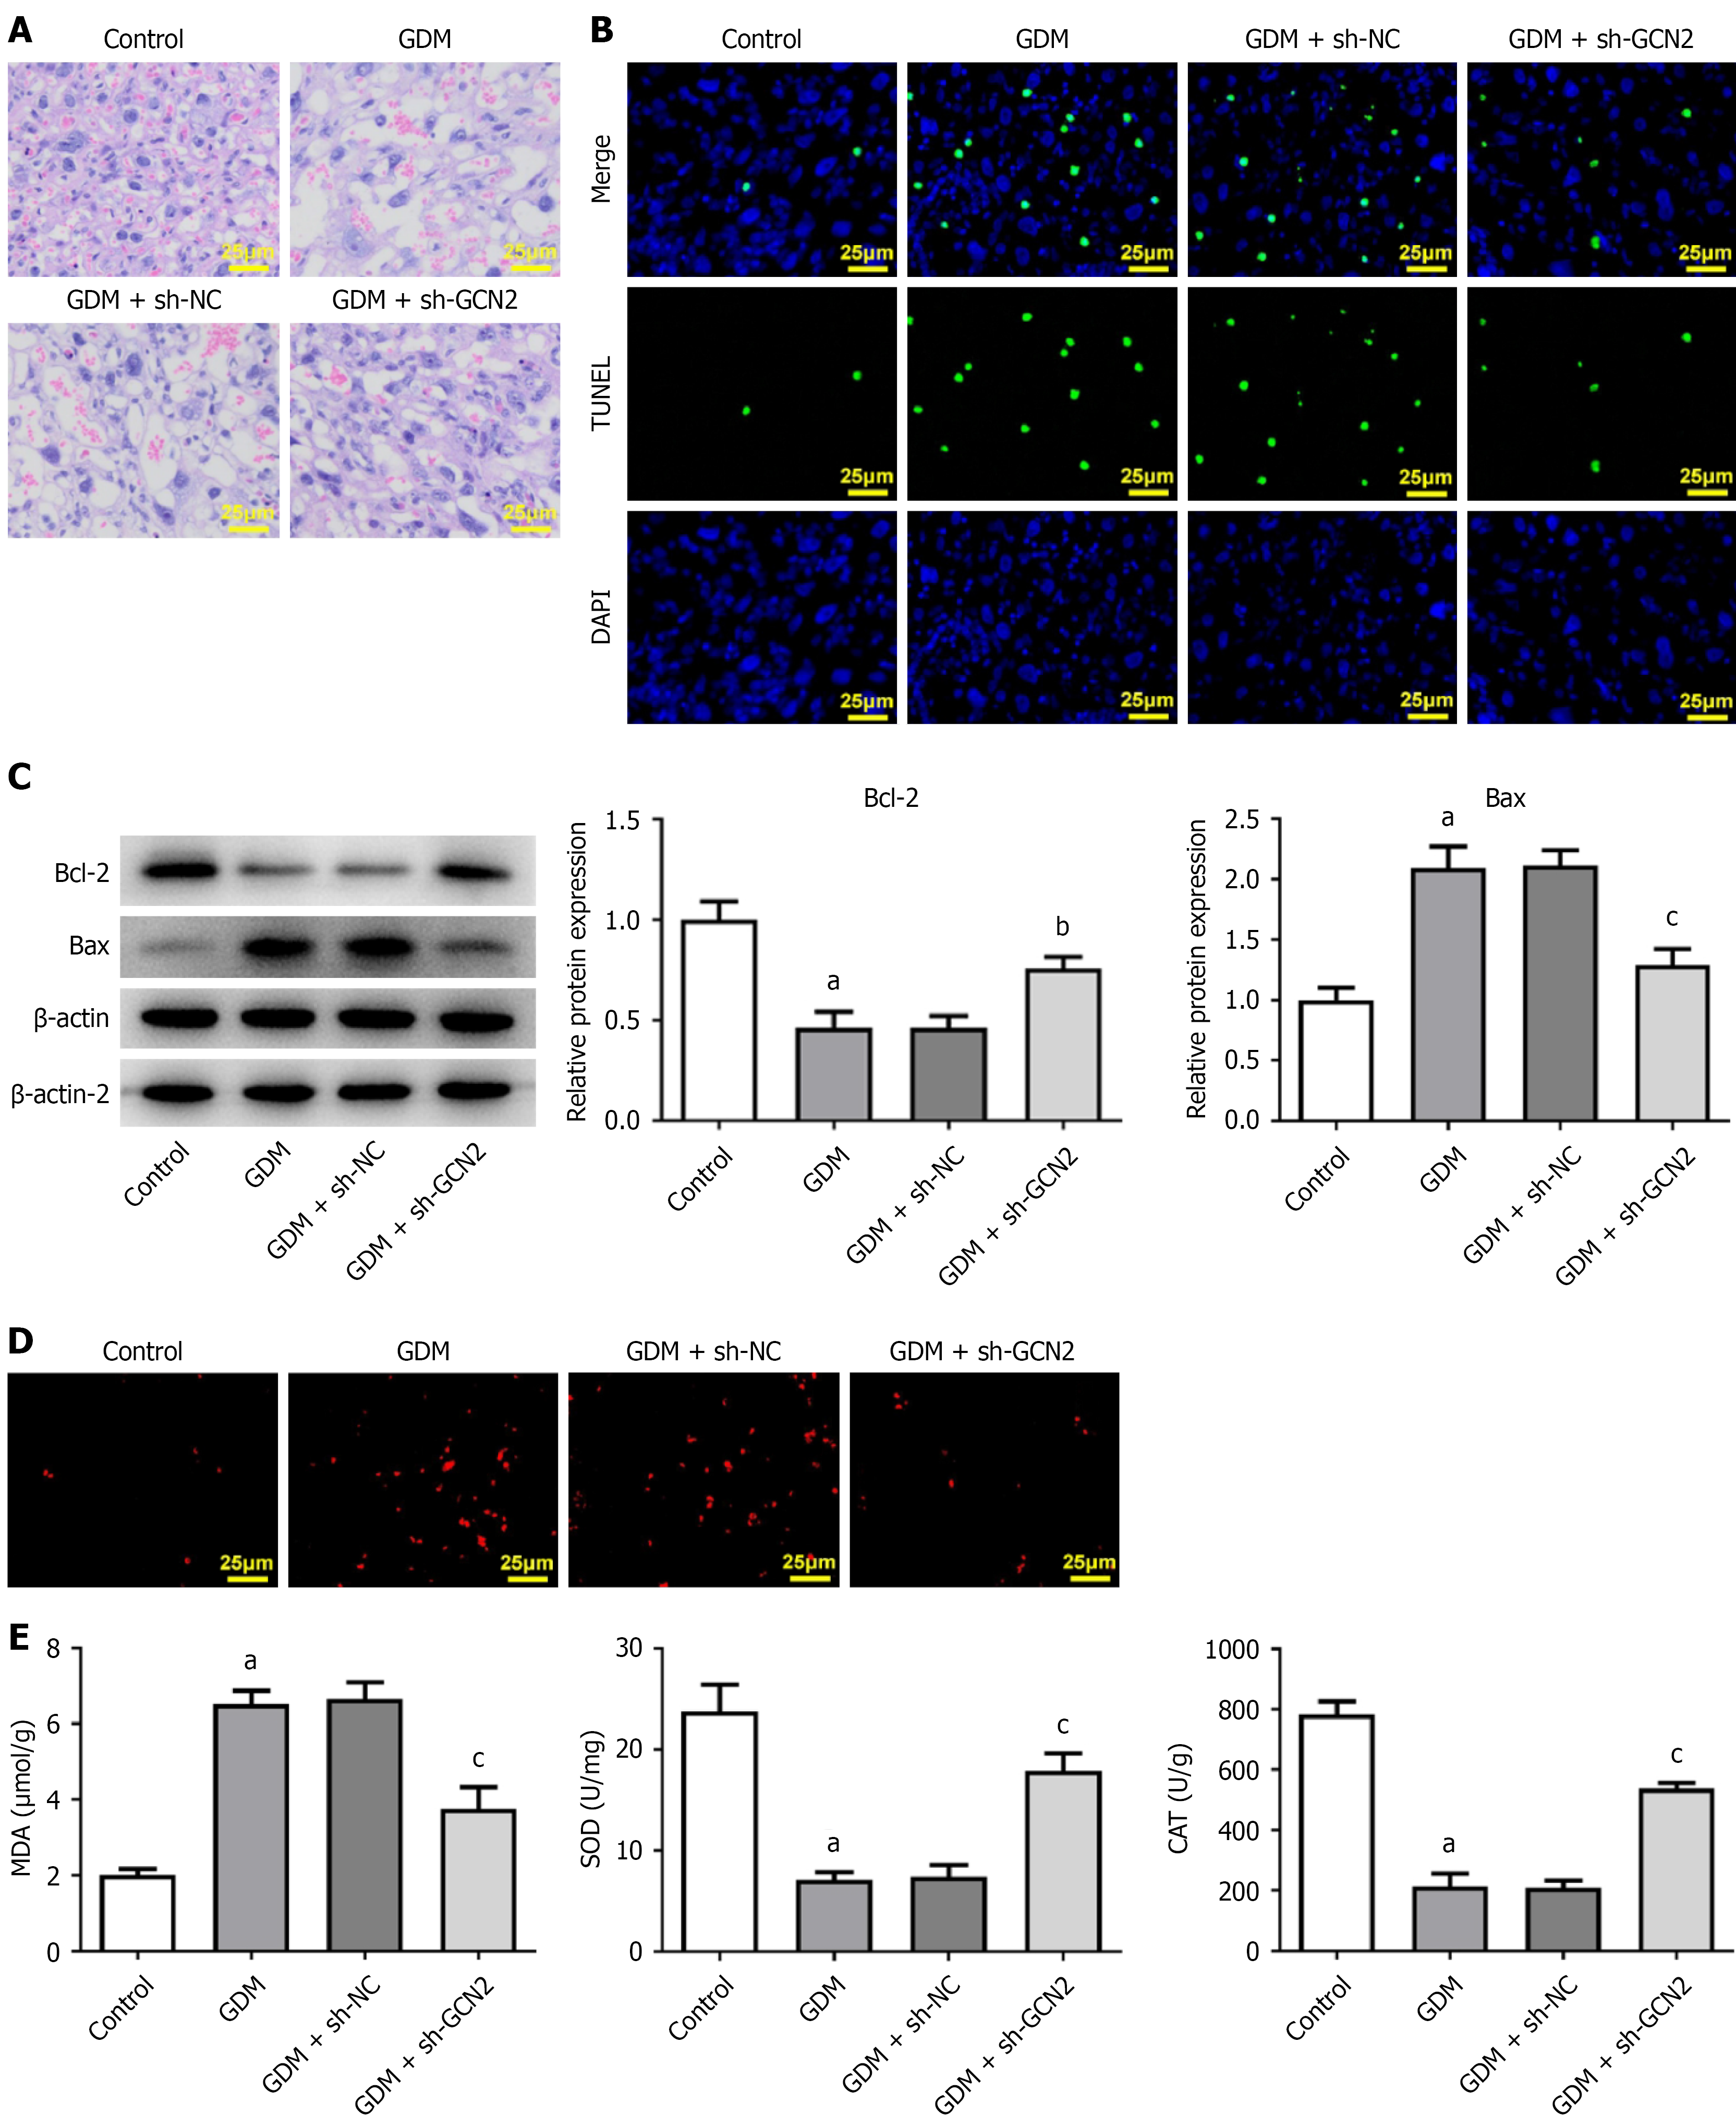
Figure 4 General control nonderepressible 2 knockdown attenuated apoptosis and oxidative stress in placental tissues of gestational diabetes mellitus mice.
A: Histological changes in placental tissues; B: Apoptosis level in placental tissues as detected by terminal deoxynucleotidyl transferase-mediated dUTP nick end labeling staining; C: Expression levels of apoptosis-related proteins determined by Western blotting; D: Reactive oxygen species production assessed by dihydroethidium staining; E: Oxidative stress-related indices including malondialdehyde, superoxide dismutase, and catalase. aP < 0.001 vs control; bP < 0.01 vs gestational diabetes mellitus (GDM) + sh-negative control (NC); cP < 0.001 vs GDM + sh-NC. GCN2: General control nonderepressible 2; GDM: Gestational diabetes mellitus; NC: Negative control; MDA: Malondialdehyde; SOD: Superoxide dismutase; CAT: Catalase.
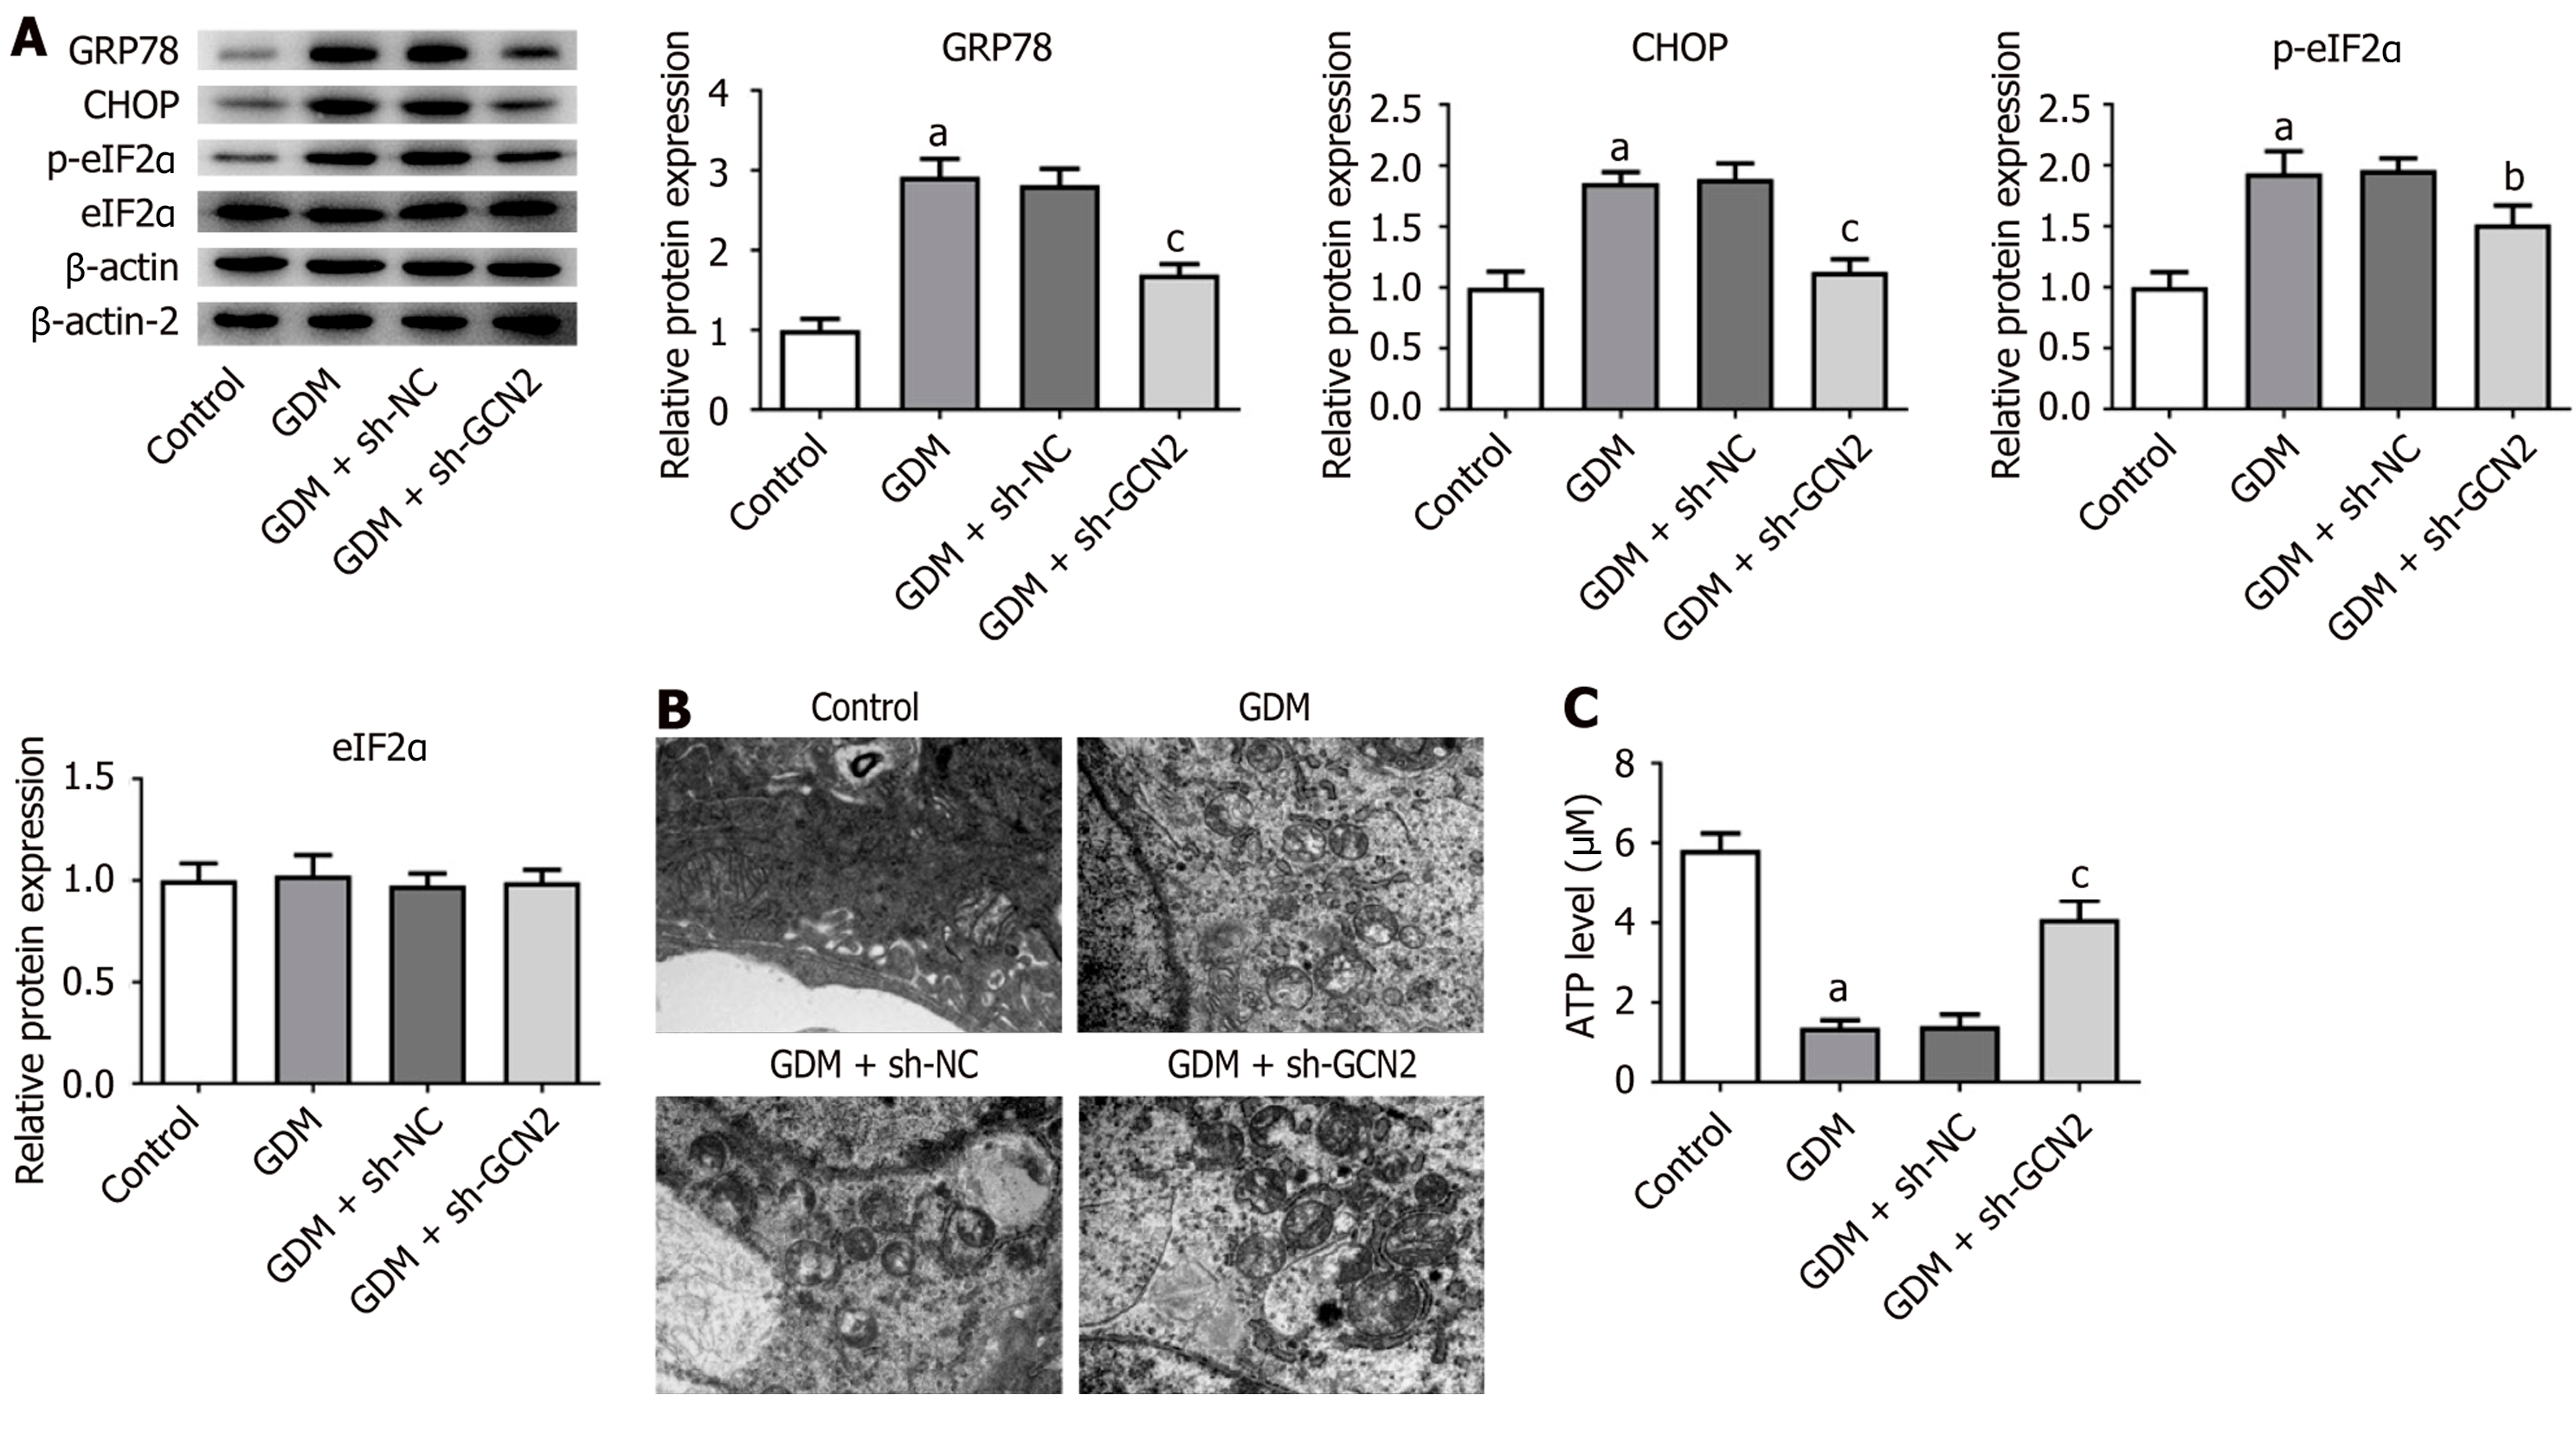
Figure 5 General control nonderepressible 2 knockdown alleviated endoplasmic reticulum stress-associated mitochondrial dysfunction in placental tissues of gestational diabetes mellitus mice.
A: Expression levels of endoplasmic reticulum stress-related proteins determined by Western blotting; B: Mitochondrial ultrastructural changes observed by transmission electron microscopy; C: ATP content in placental tissues. aP < 0.001 vs control; bP < 0.05 vs gestational diabetes mellitus (GDM) + sh-negative control (NC); cP < 0.001 vs GDM + sh-NC. eIF2α: Eukaryotic initiation factor 2α; GCN2: General control nonderepressible 2; GDM: Gestational diabetes mellitus; NC: Negative control.
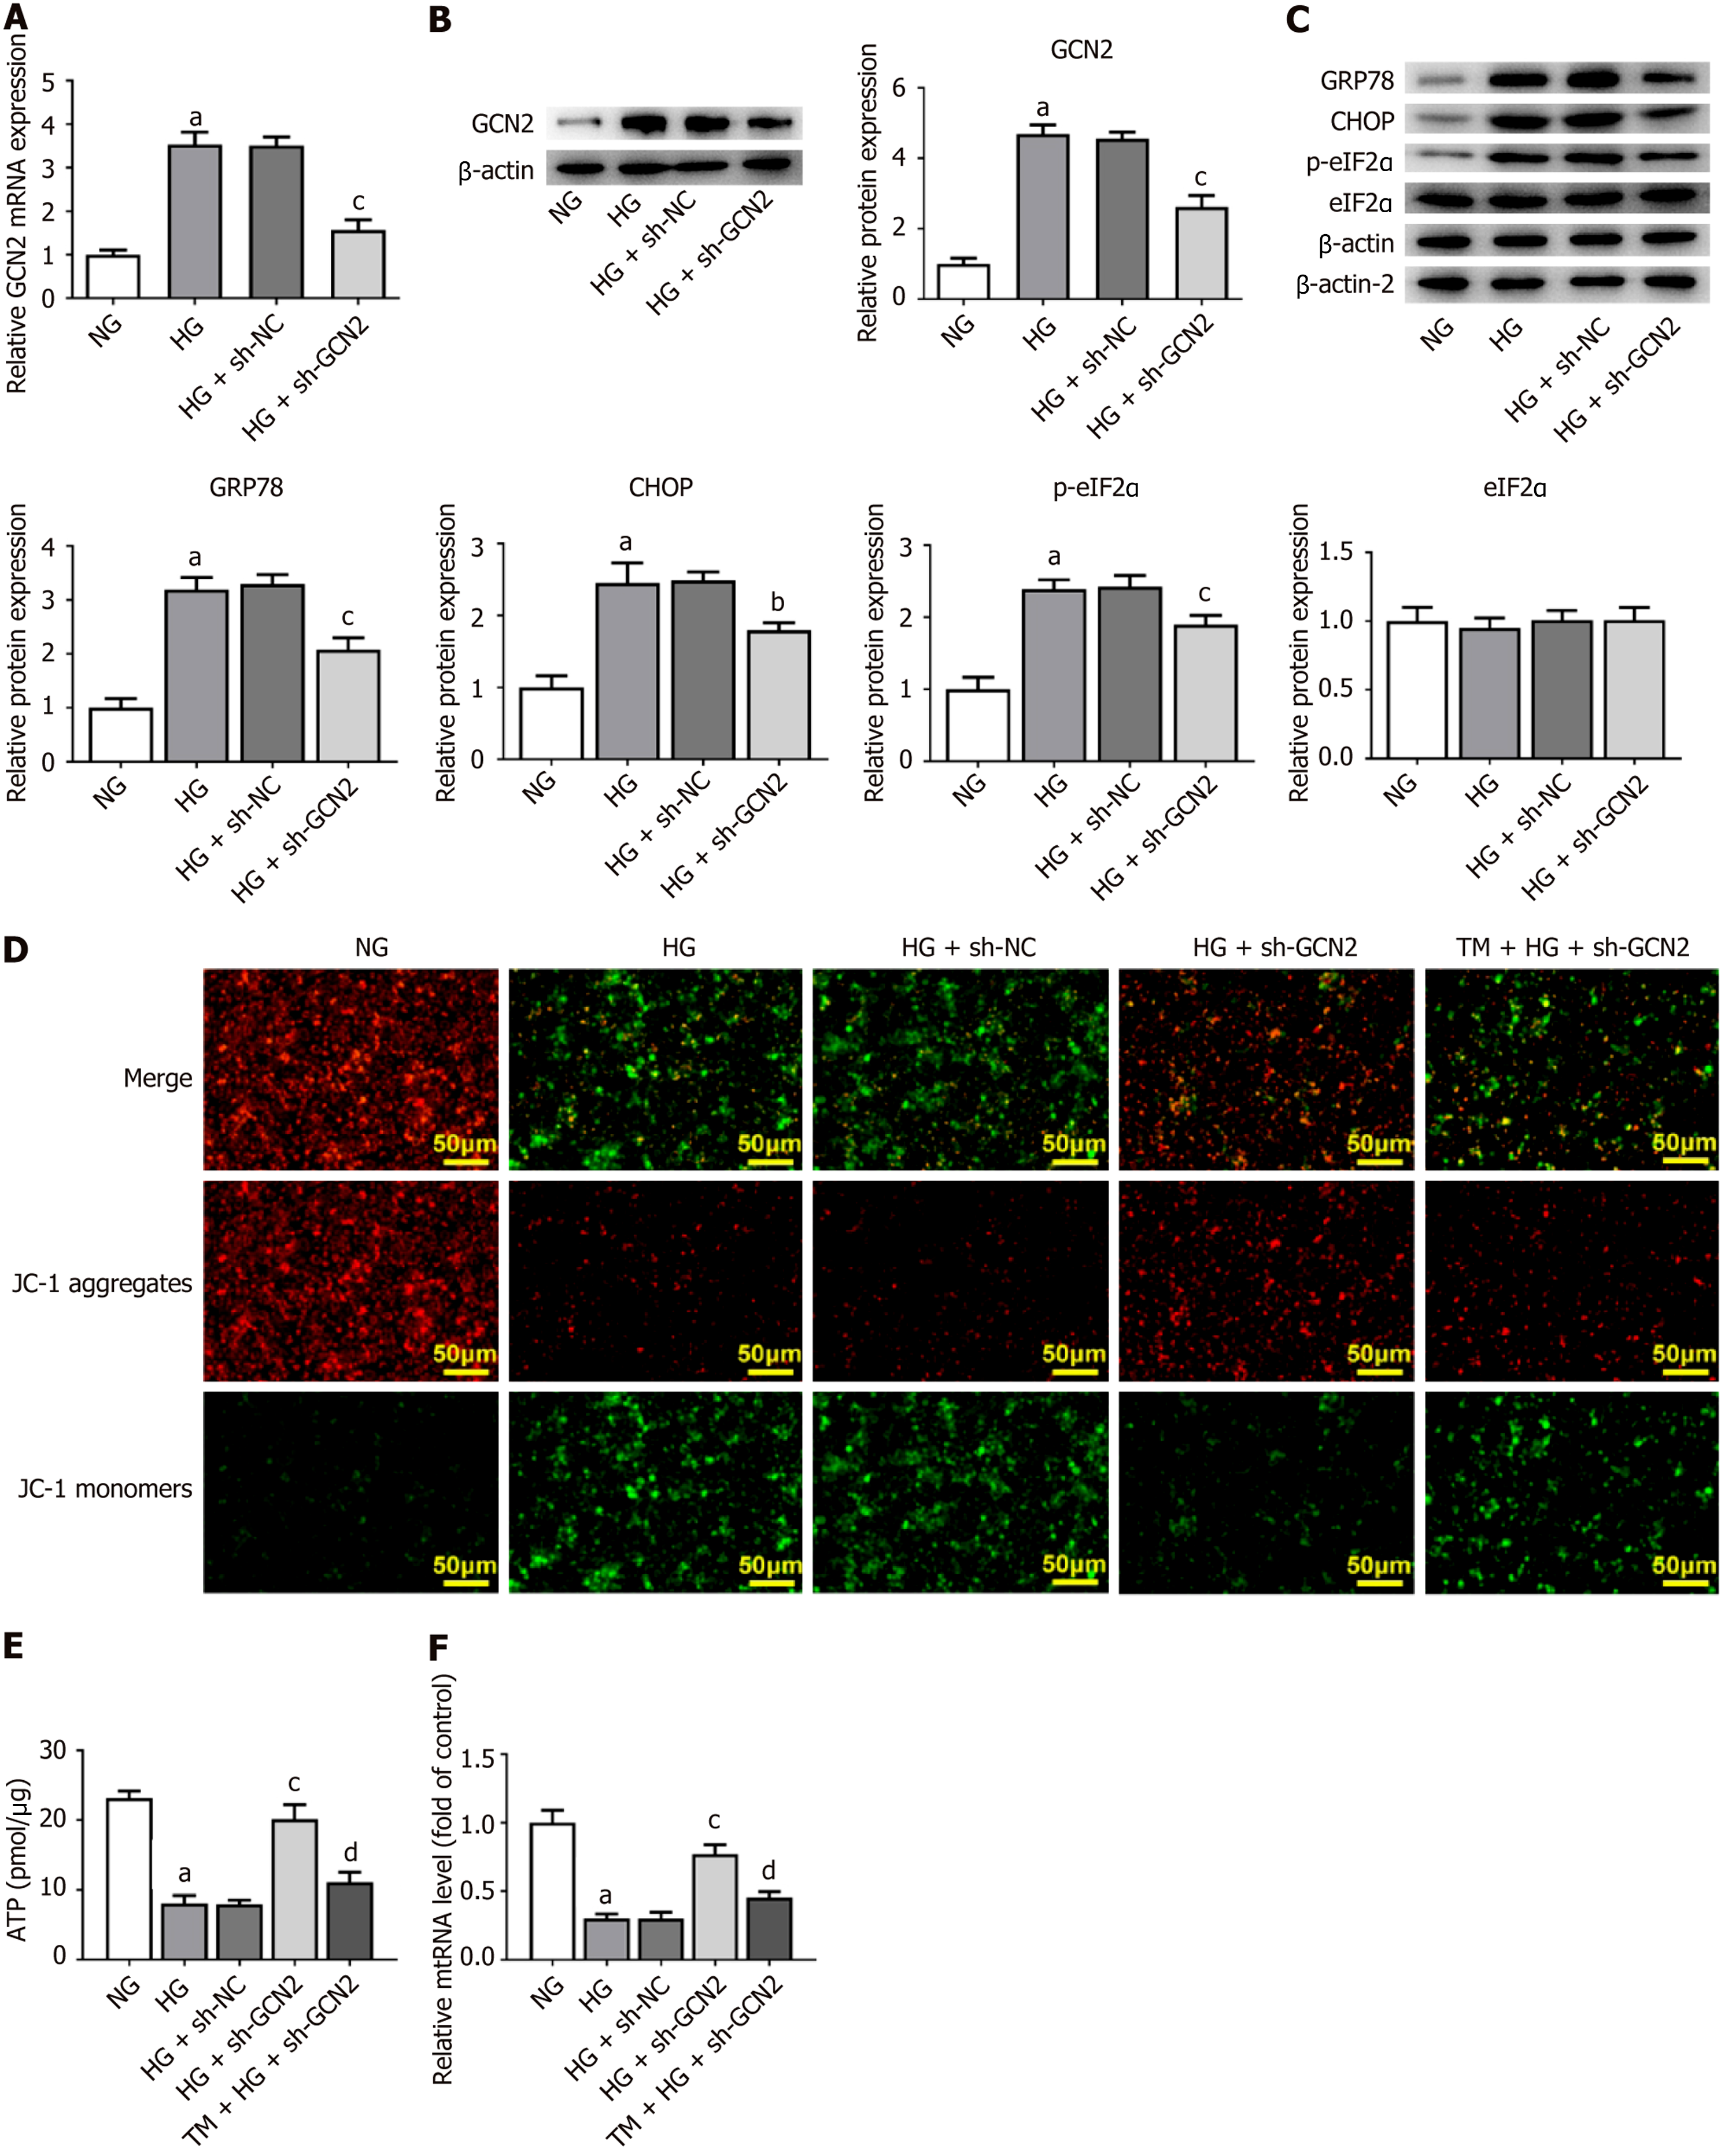
Figure 6 General control nonderepressible 2 absence inactivated endoplasmic reticulum stress to mitigate mitochondrial dysfunction in high glucose-exposed HTR-8/SVneo cells.
A and B: General control nonderepressible 2 (GCN2) expression at mRNA and protein levels determined by reverse transcription quantitative PCR (RT-qPCR) and Western blotting; C: Expression levels of endoplasmic reticulum stress-related proteins; D: Mitochondrial membrane potential assessed by JC-1 staining; E: ATP content in cells; F: The mtDNA content determined by RT-qPCR. aP < 0.001 vs normal glucose; bP < 0.01 vs high glucose (HG) + sh-negative control (NC); cP < 0.001 vs HG + sh-NC; dP < 0.001 vs HG + sh-GCN2. GCN2: General control nonderepressible 2; GDM: Gestational diabetes mellitus; NC: Negative control; eIF2α: Eukaryotic initiation factor 2α; NG: Normal glucose; HG: High glucose.
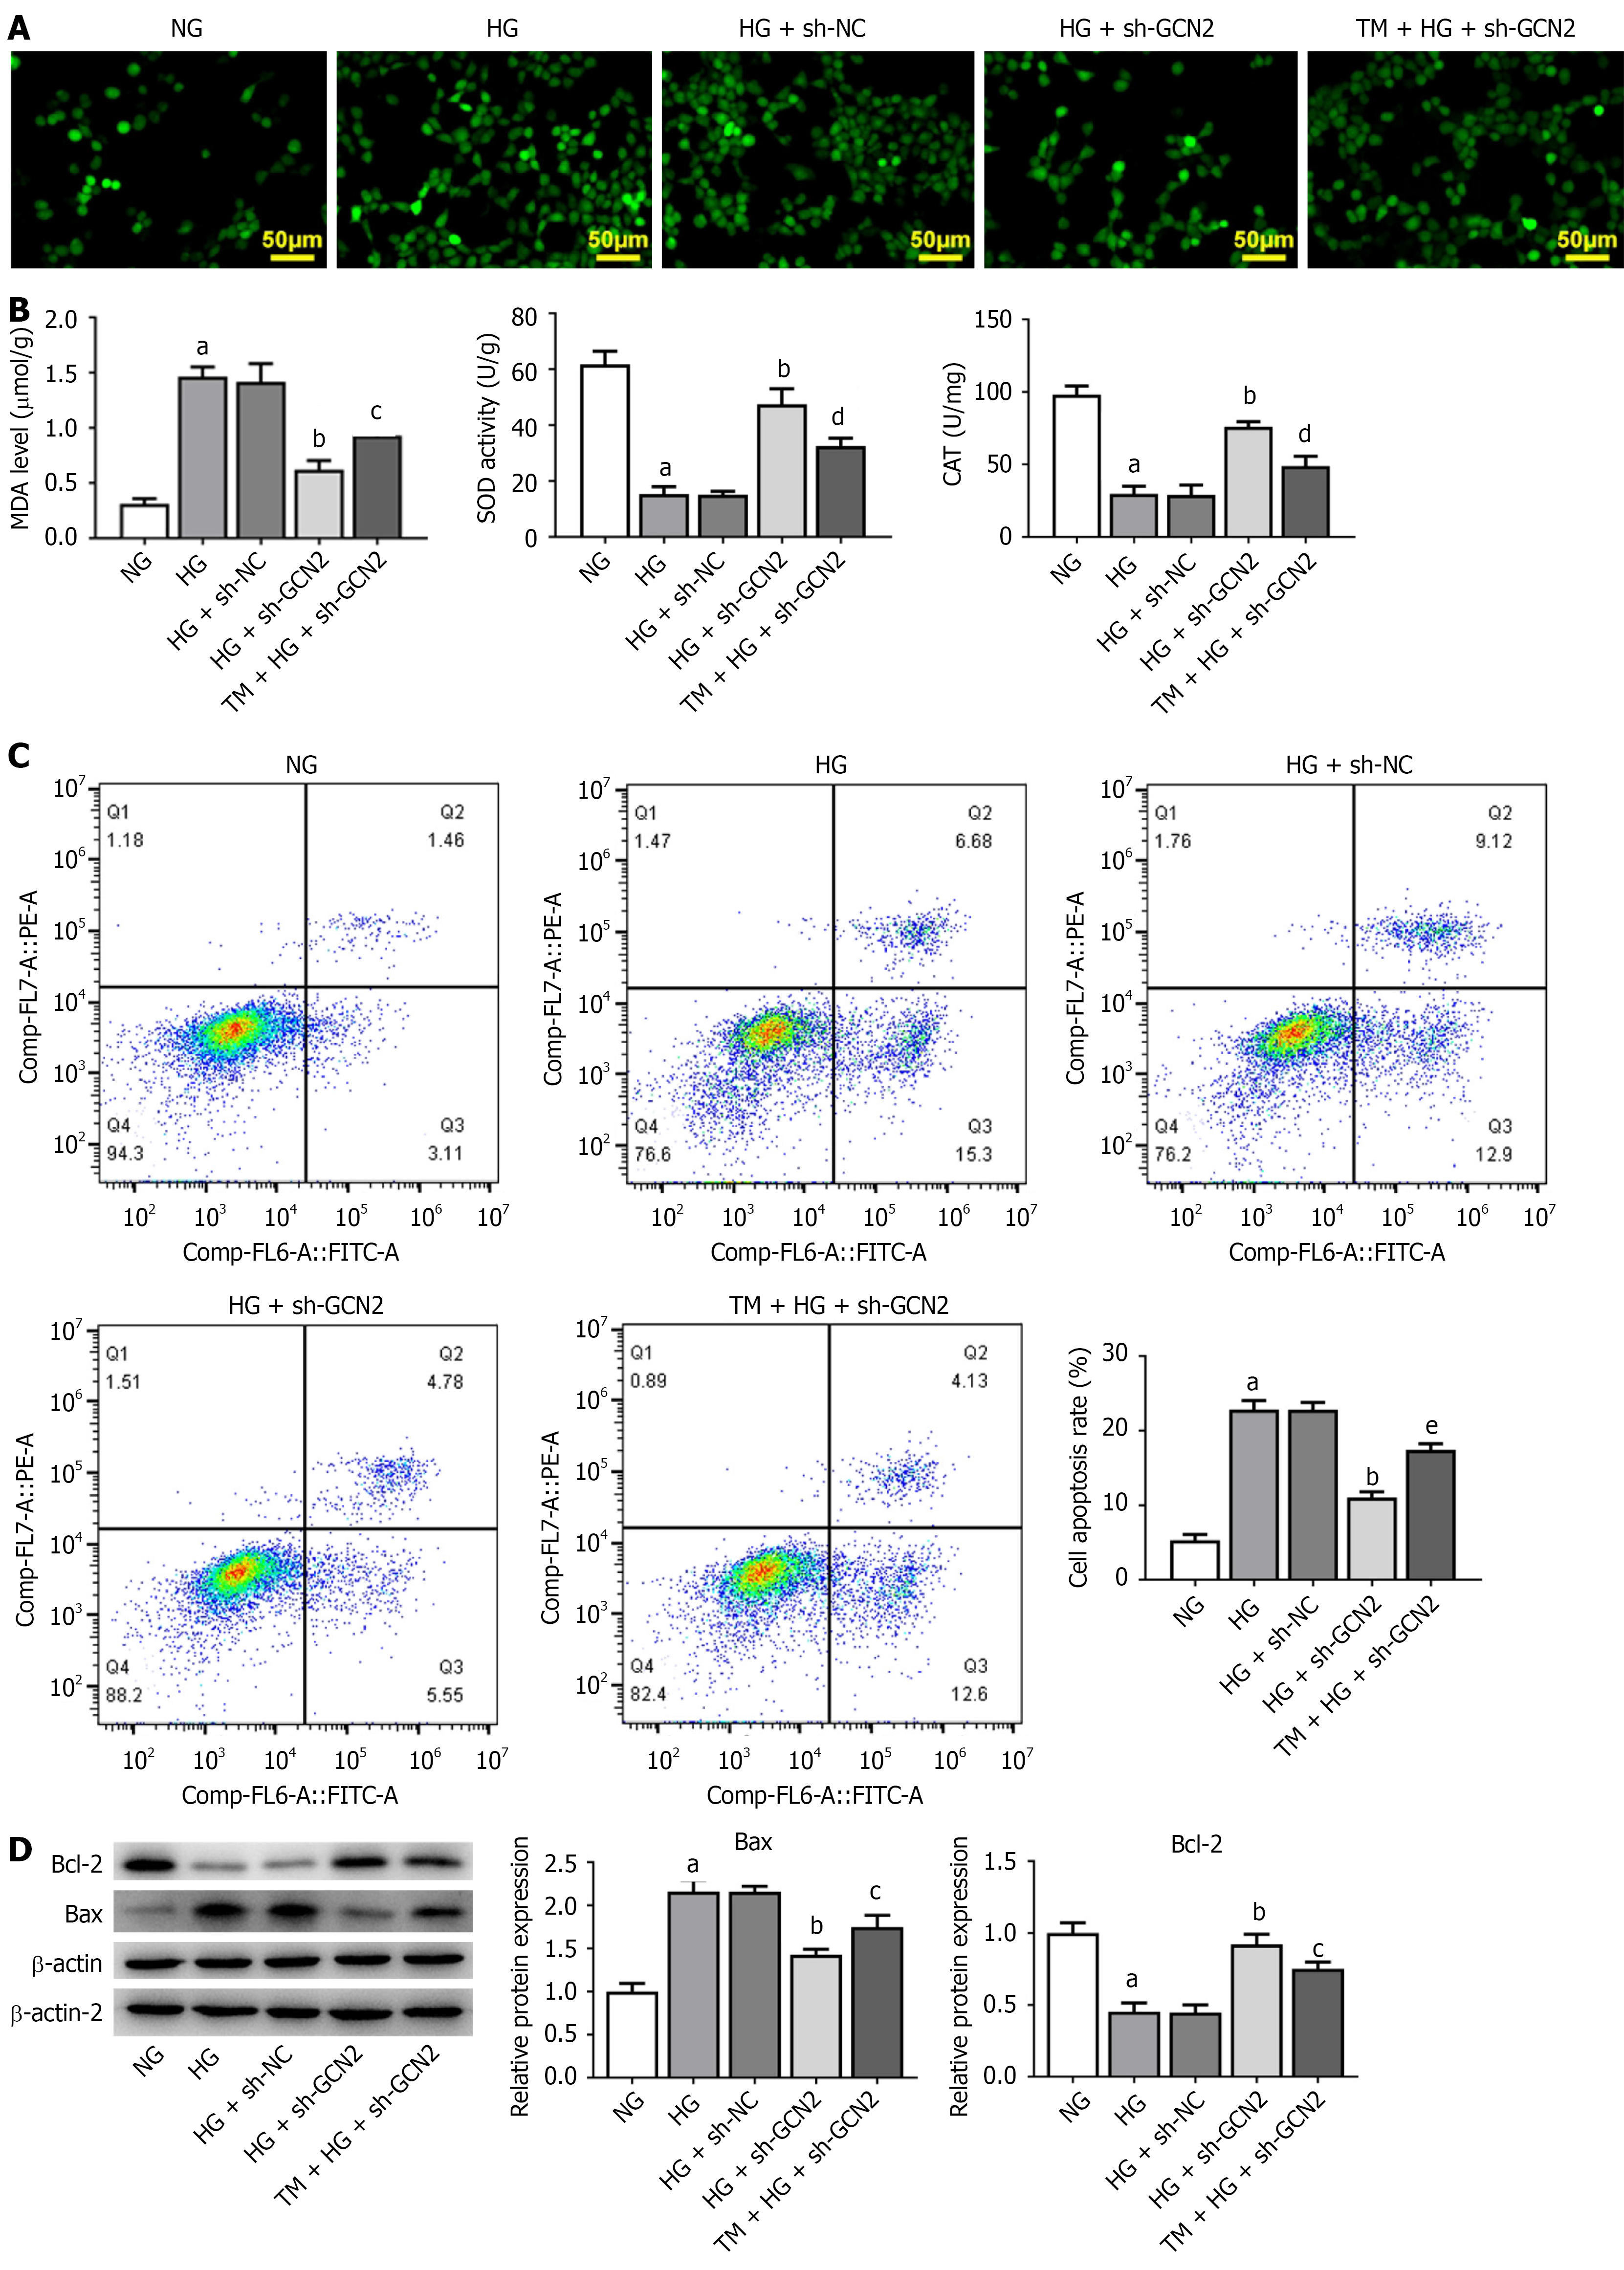
Figure 7 General control nonderepressible 2 absence inactivated endoplasmic reticulum stress to retard the apoptosis and oxidative damage in high glucose-exposed HTR-8/SVneo cells.
A: Reactive oxygen species production assessed by 2′,7′-dichlorodihydrofluorescein diacetate staining; B: Oxidative stress-related indices including malondialdehyde, superoxide dismutase and catalase; C: Apoptosis level determined by flow cytometry; D: Expression levels of apoptosis-related proteins. aP < 0.001 vs normal glucose; bP < 0.001 vs high glucose (HG) + sh-negative control; cP < 0.05 vs HG + sh-GCN2; dP < 0.01 vs HG + sh-GCN2; eP < 0.001 vs HG + sh-GCN2. NG: Normal glucose; HG: High glucose; MDA: Malondialdehyde; NC: Negative control; GCN2: General control nonderepressible 2; TM: Tunicamycin; SOD: Superoxide dismutase; CAT: Catalase.
- Citation: Li W, Wang YR, Wang SL. Assessment of the role of general control nonderepressible 2 in gestational diabetes mellitus progression and the underlying mechanisms. World J Diabetes 2026; 17(7): 119780
- URL: https://www.wjgnet.com/1948-9358/full/v17/i7/119780.htm
- DOI: https://dx.doi.org/10.4239/wjd.119780