
















Copyright: ©Author(s) 2026.
World J Diabetes. Oct 15, 2026; 17(10): 125355
Published online Oct 15, 2026. doi: 10.4239/wjd.125355
Published online Oct 15, 2026. doi: 10.4239/wjd.125355
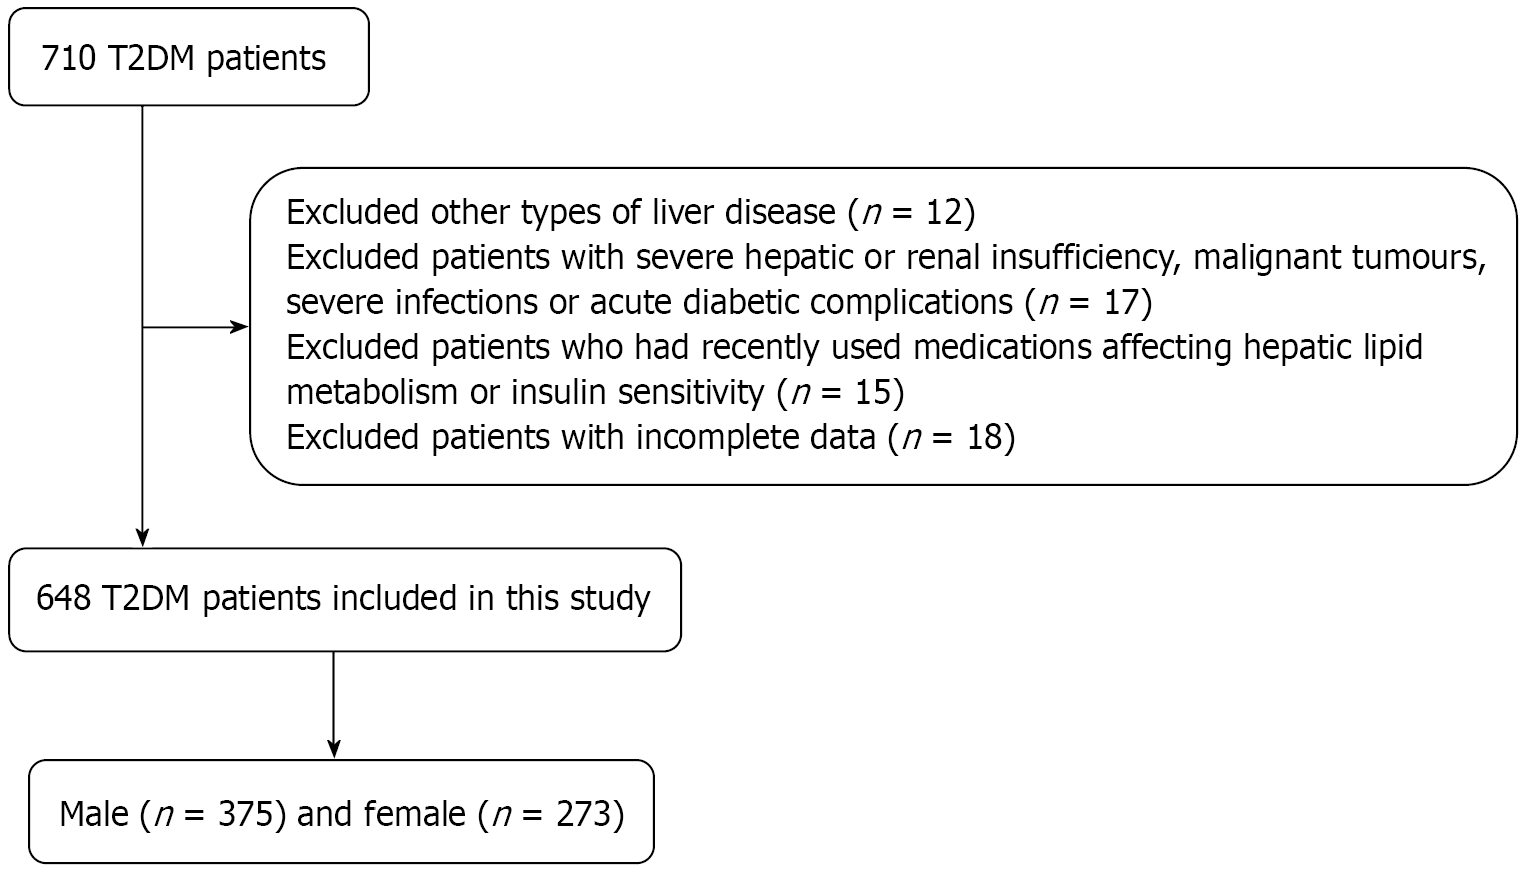
Figure 1 Flowchart of the population included in our study.
T2DM: Type 2 diabetes mellitus.
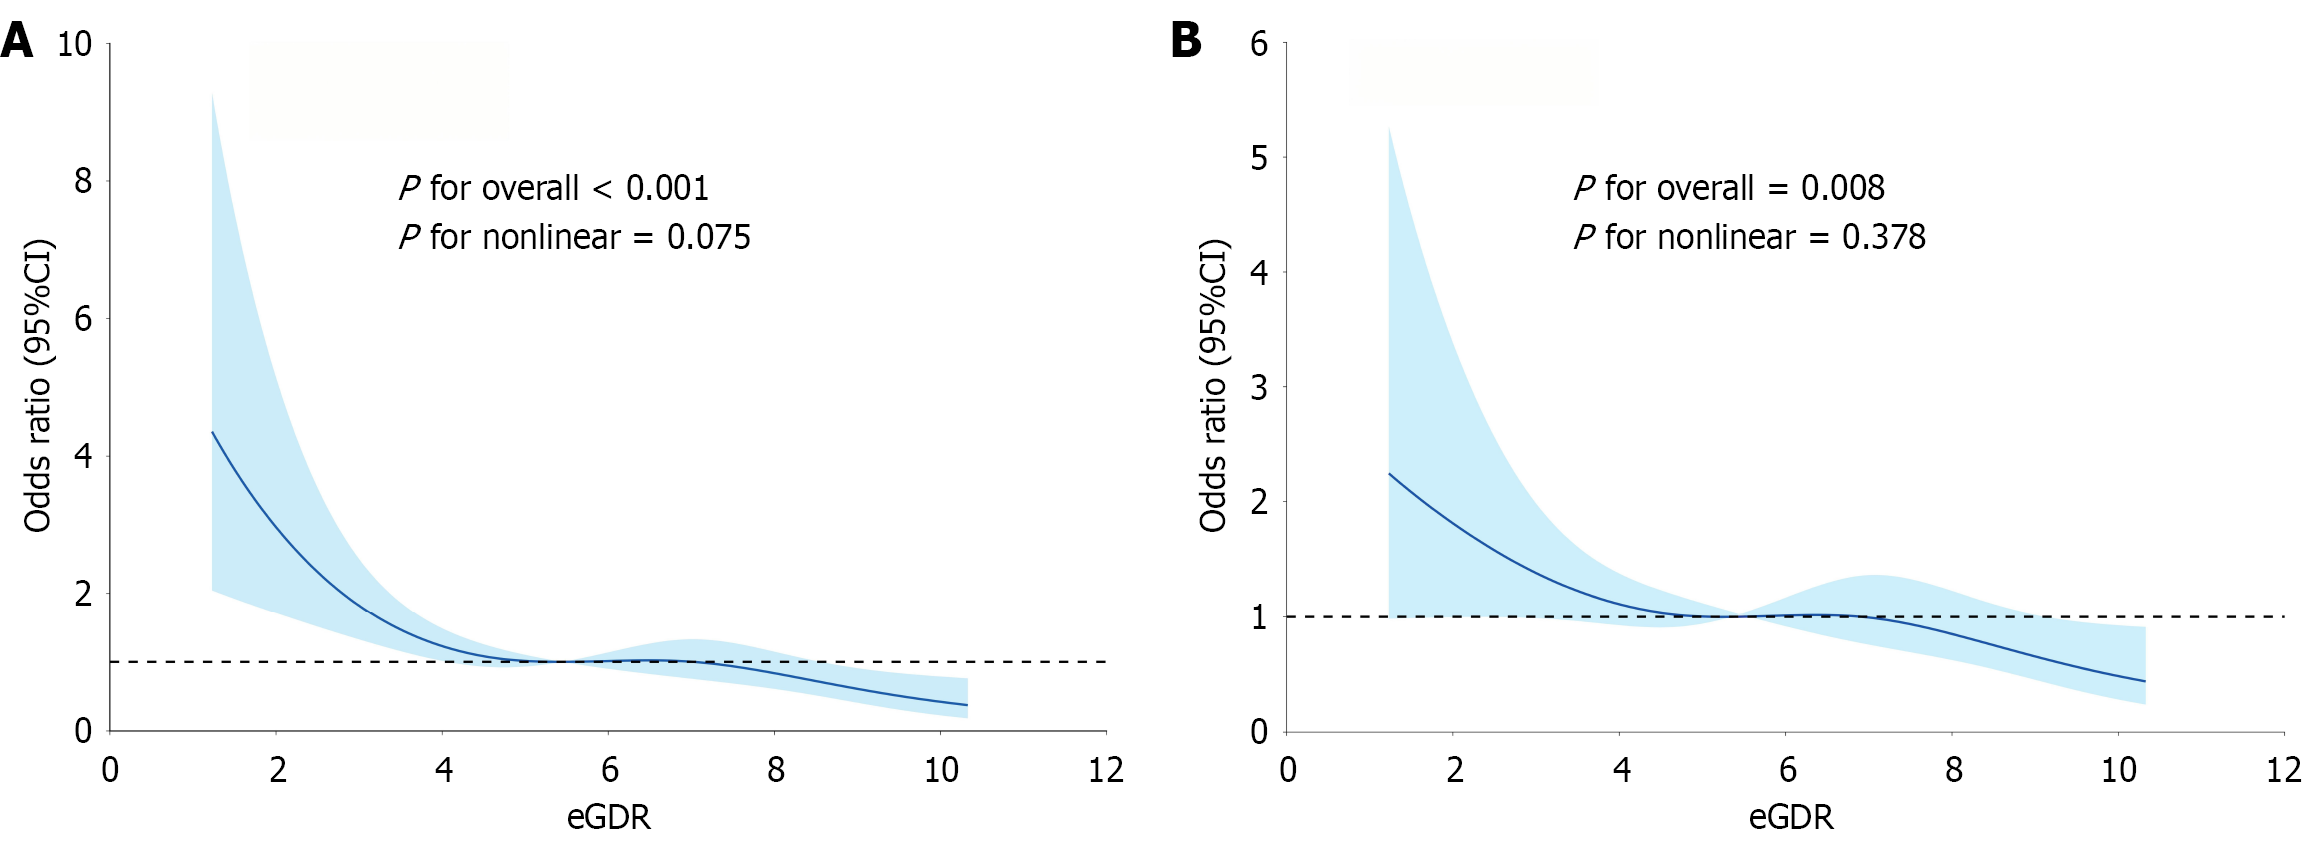
Figure 2 Restrictive cubic spline analysis of the association between estimated glucose disposal rate and metabolic dysfunction-associated steatotic liver disease in overall populations.
A: A crude model with no adjustment for any confounding factors; B: Adjust for several confounding factors. Adjust: Sex, duration, age, total cholesterol, triglyceride, low-density lipoprotein cholesterol, high-density lipoprotein cholesterol, alanine aminotransferase, aspartate transaminase, blood urea nitrogen, serum creatinine, uric acid, homocysteine, white blood cell, and platelet. CI: Confidence interval; eGDR: Estimated glucose disposal rate.
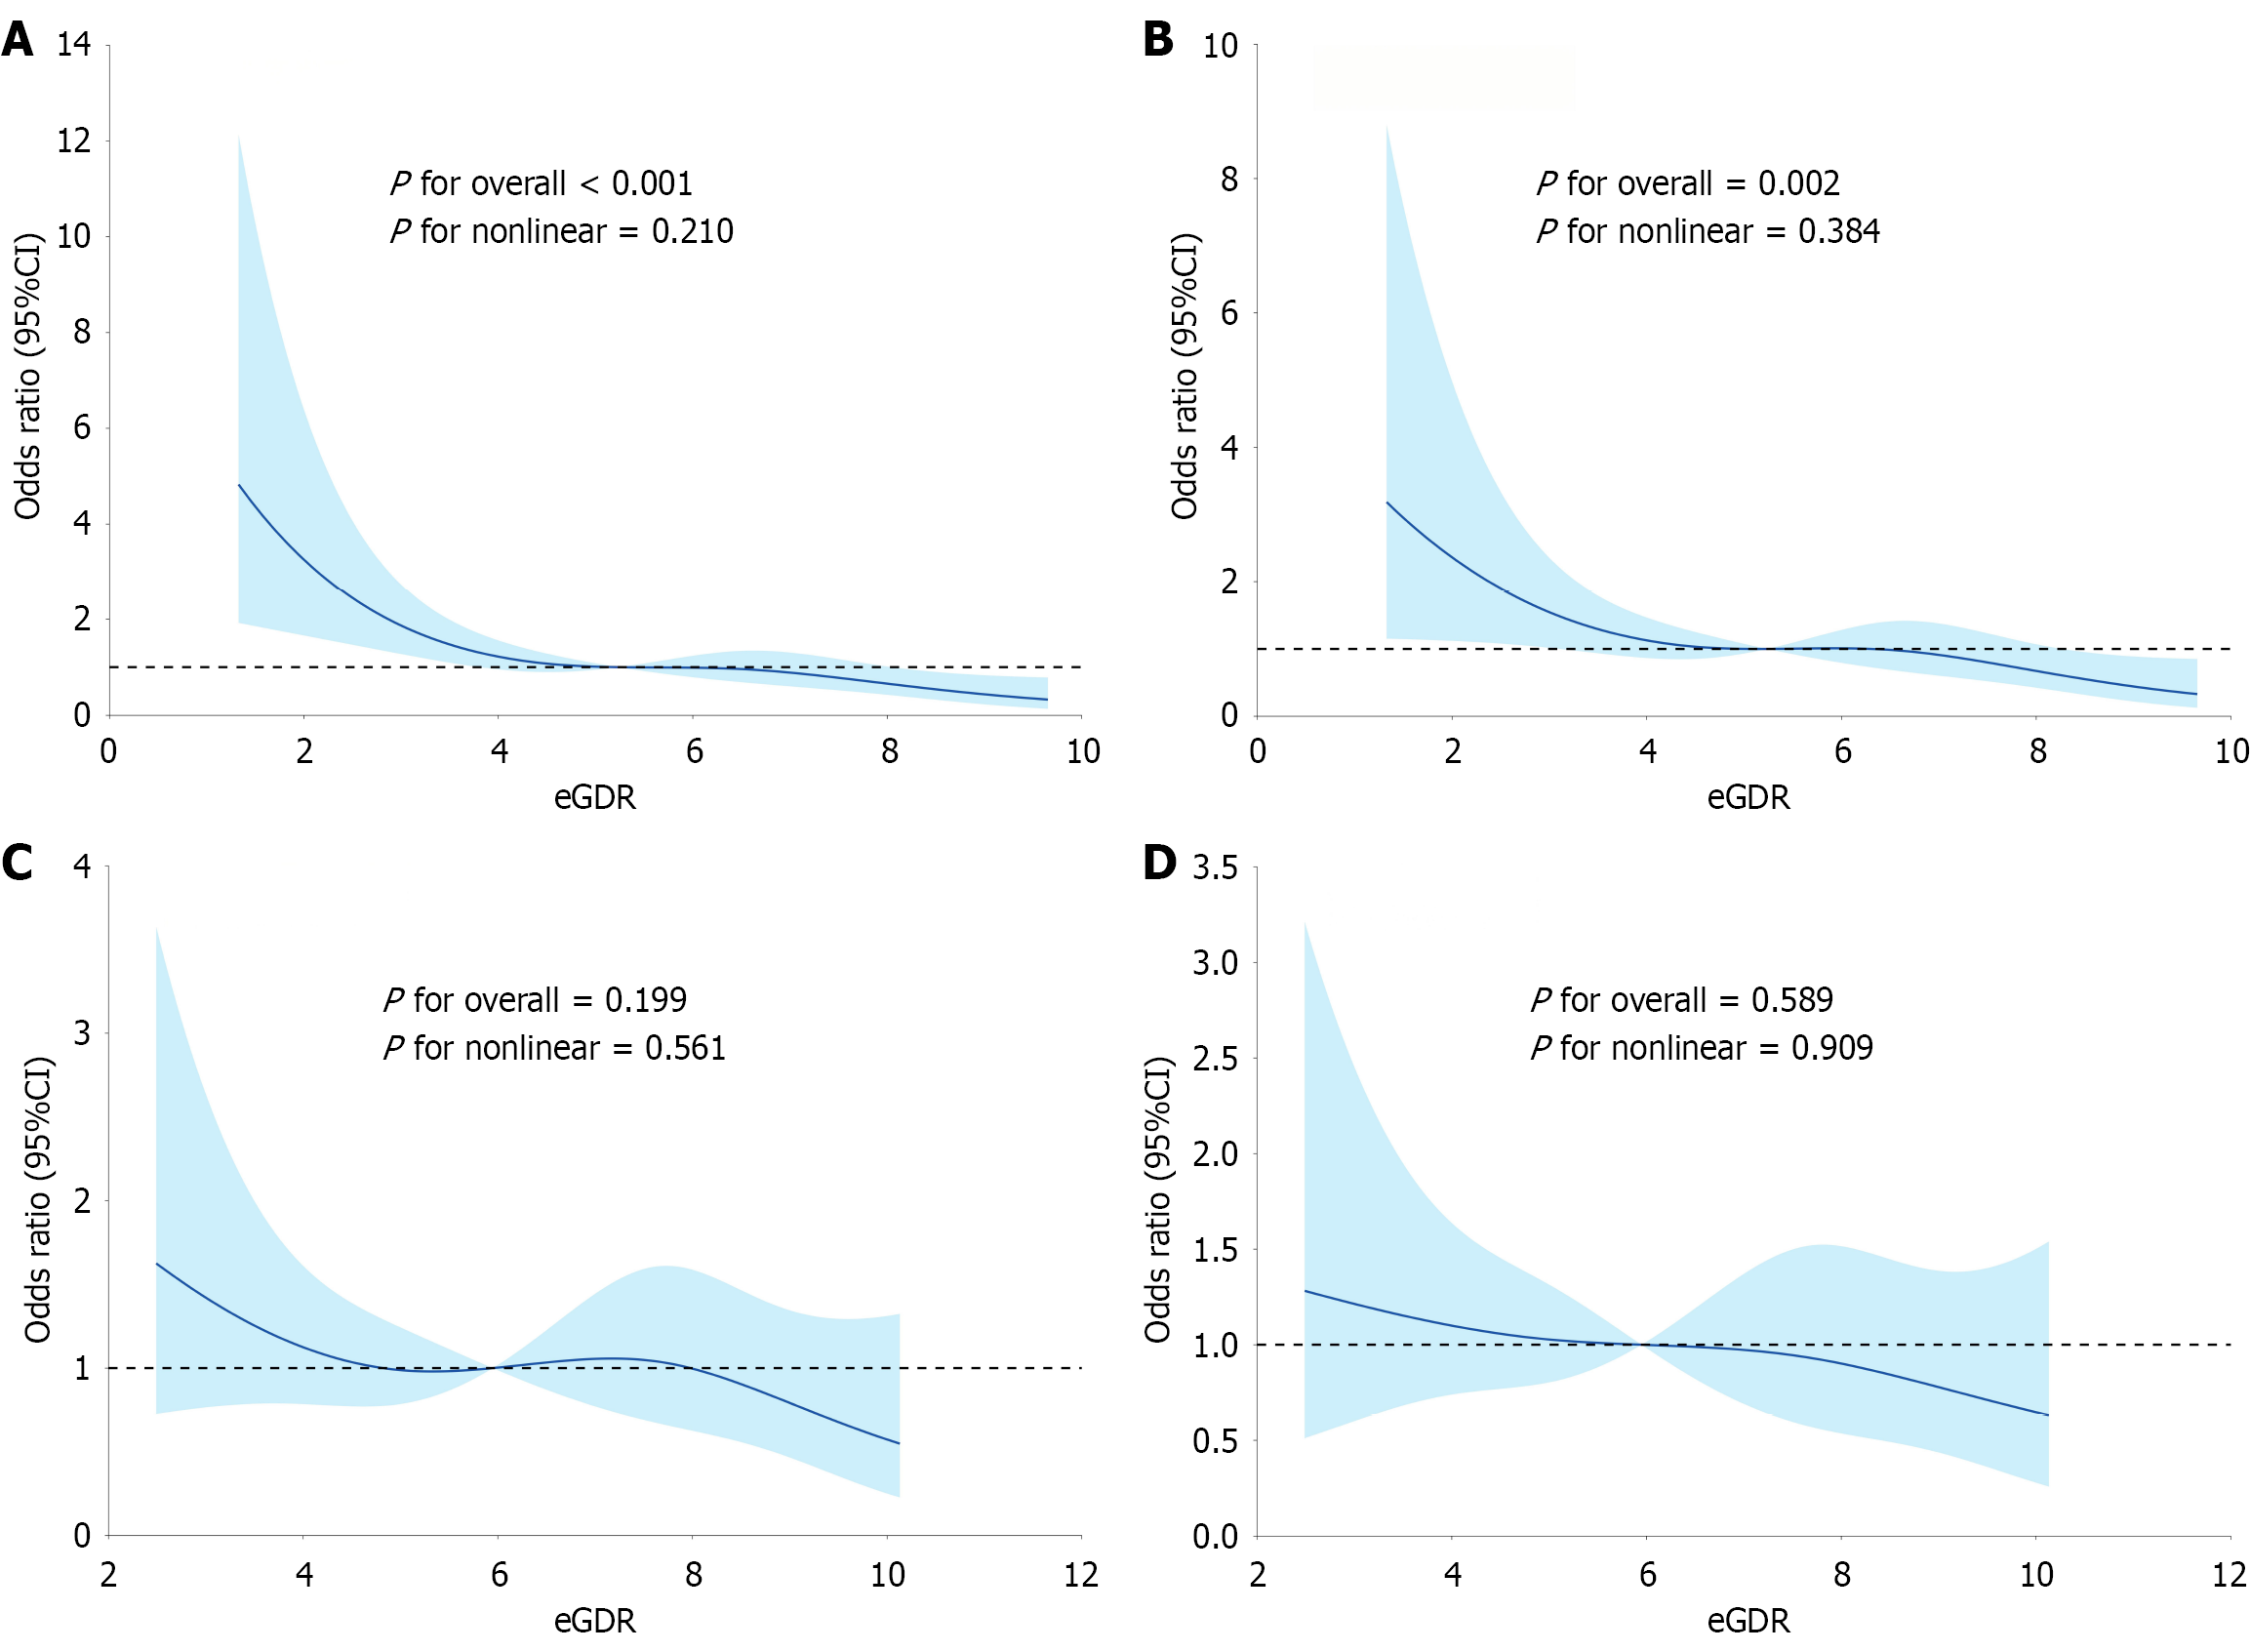
Figure 3 Restrictive cubic spline analysis of the association between estimated glucose disposal rate and metabolic dysfunction-associated steatotic liver disease in gender-stratified populations.
A: A crude model with no adjustment for any confounding factors in the males population; B: Adjust for several confounding factors in the males population; C: A crude model with no adjustment for any confounding factors in the females population; D: Adjust for several confounding factors in the females population. Adjust: Sex, duration, age, total cholesterol, triglyceride, low-density lipoprotein cholesterol, high-density lipoprotein cholesterol, alanine aminotransferase, aspartate transaminase, blood urea nitrogen, serum creatinine, uric acid, homocysteine, white blood cell, and platelet. CI: Confidence interval; eGDR: Estimated glucose disposal rate.
- Citation: Yin JT, Lu YX, Li ZM, Niu S. Association between estimated glucose disposal rate and metabolic dysfunction-associated steatotic liver disease in type 2 diabetes mellitus patients. World J Diabetes 2026; 17(10): 125355
- URL: https://www.wjgnet.com/1948-9358/full/v17/i10/125355.htm
- DOI: https://dx.doi.org/10.4239/wjd.125355