
















Copyright: ©Author(s) 2026.
World J Diabetes. Oct 15, 2026; 17(10): 124659
Published online Oct 15, 2026. doi: 10.4239/wjd.124659
Published online Oct 15, 2026. doi: 10.4239/wjd.124659
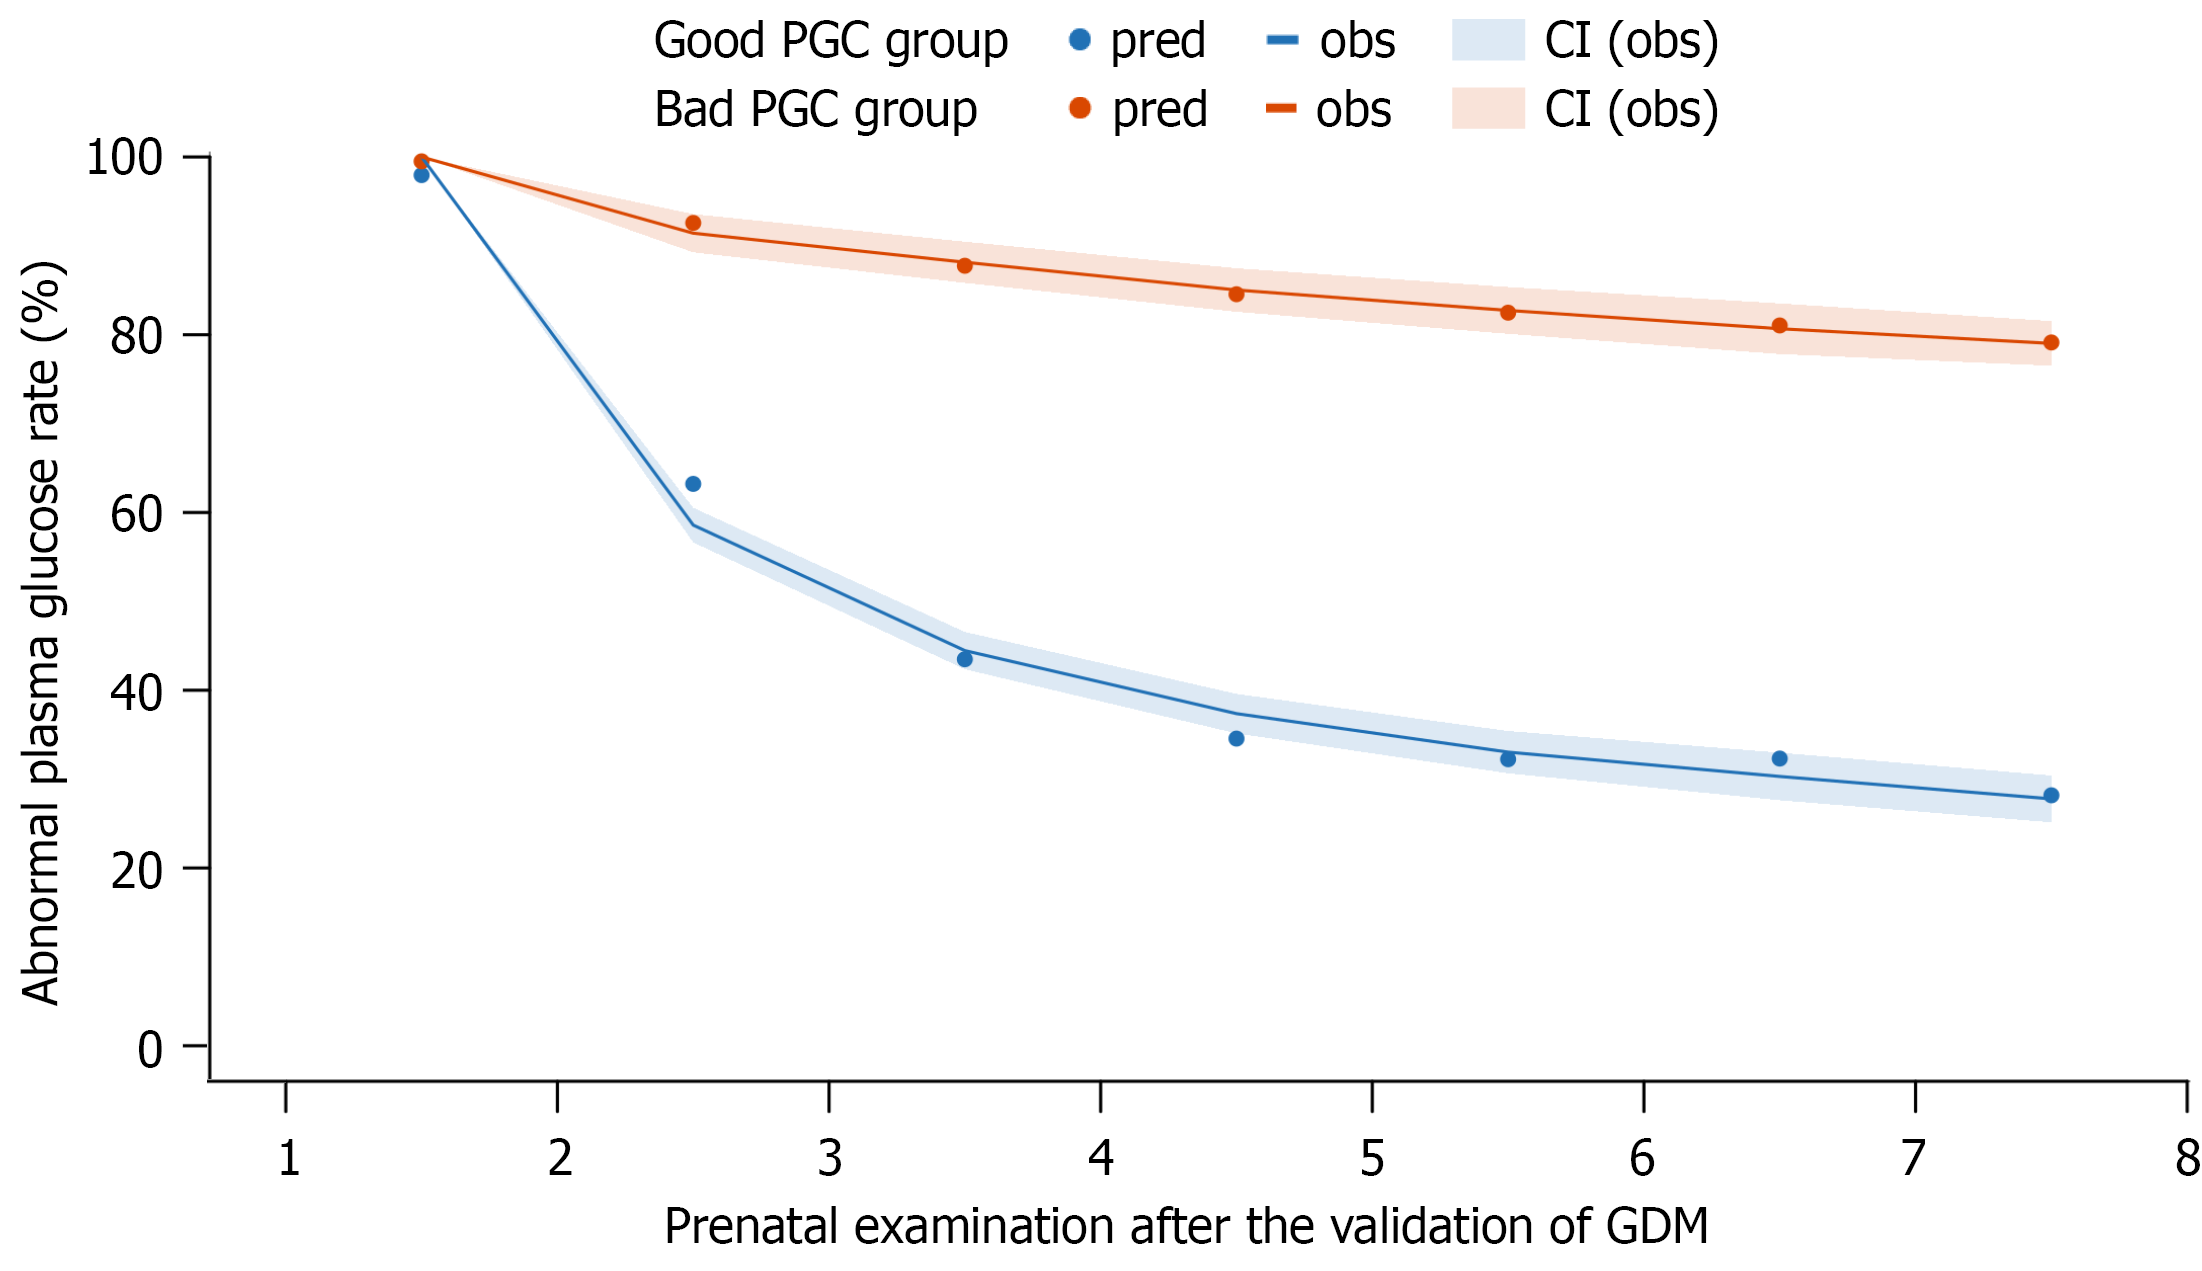
Figure 1 Trajectories of abnormal plasma glucose rate at each preset time-point from prenatal examination after the diagnosis of gestational diabetes mellitus.
PGC: Plasma glucose control; pred: Prediction; obs: Observation; CI: Confidence interval; GDM: Gestational diabetes mellitus.
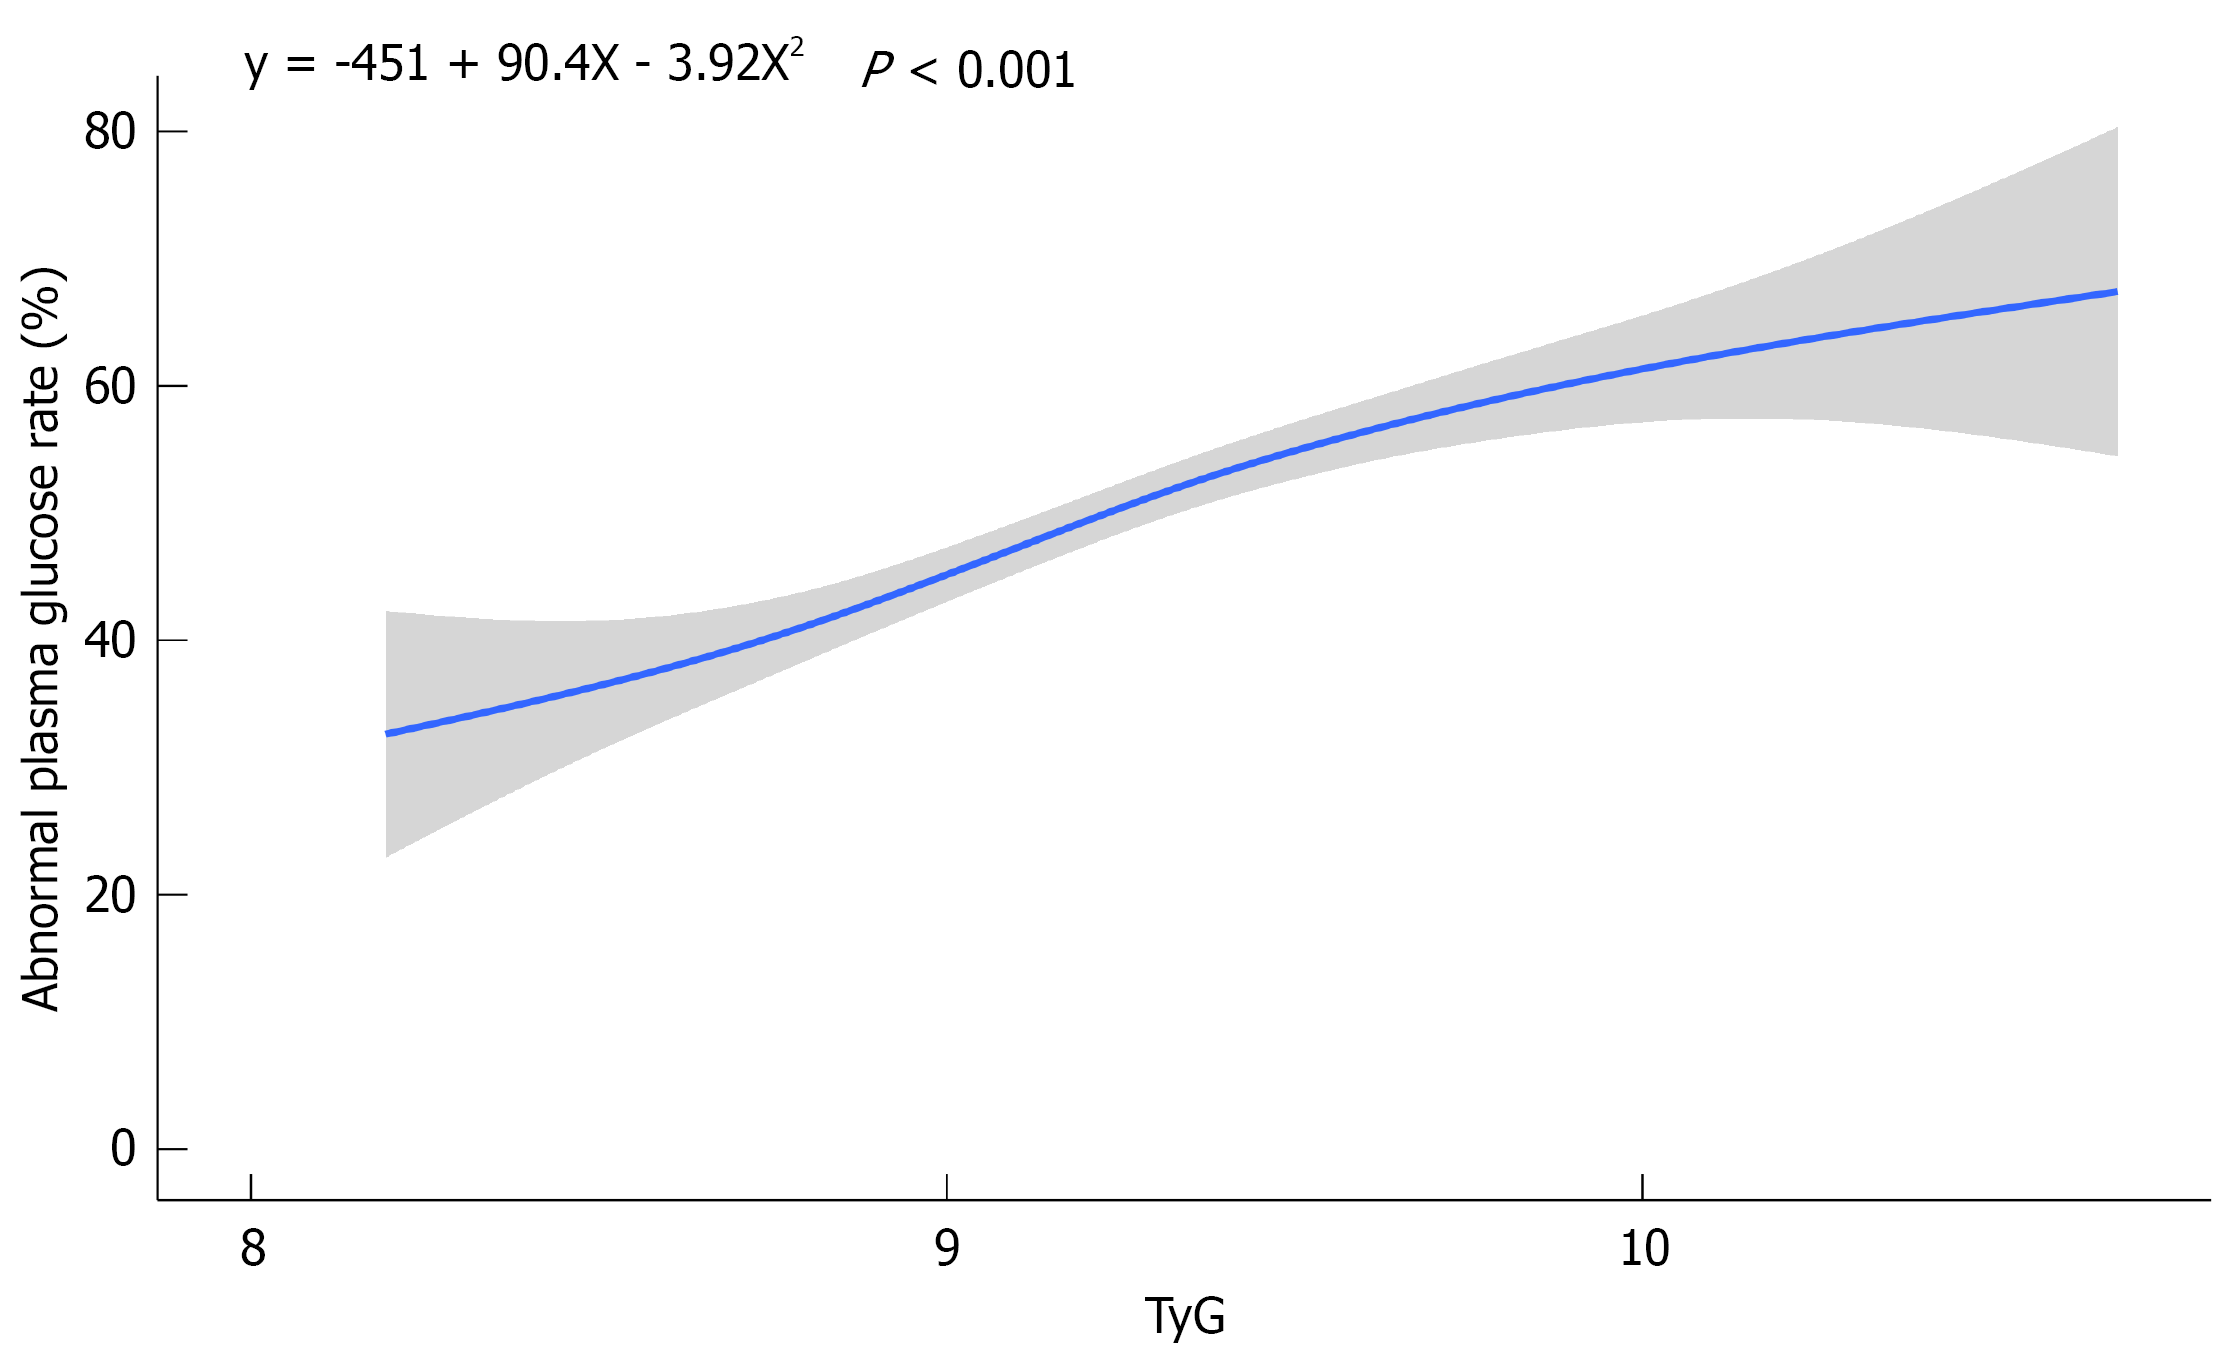
Figure 2 The association between triglyceride-glucose index and the abnormal plasma glucose rate among gestational diabetes mellitus women, with the analysis of binomial regression.
TyG: Triglyceride-glucose.
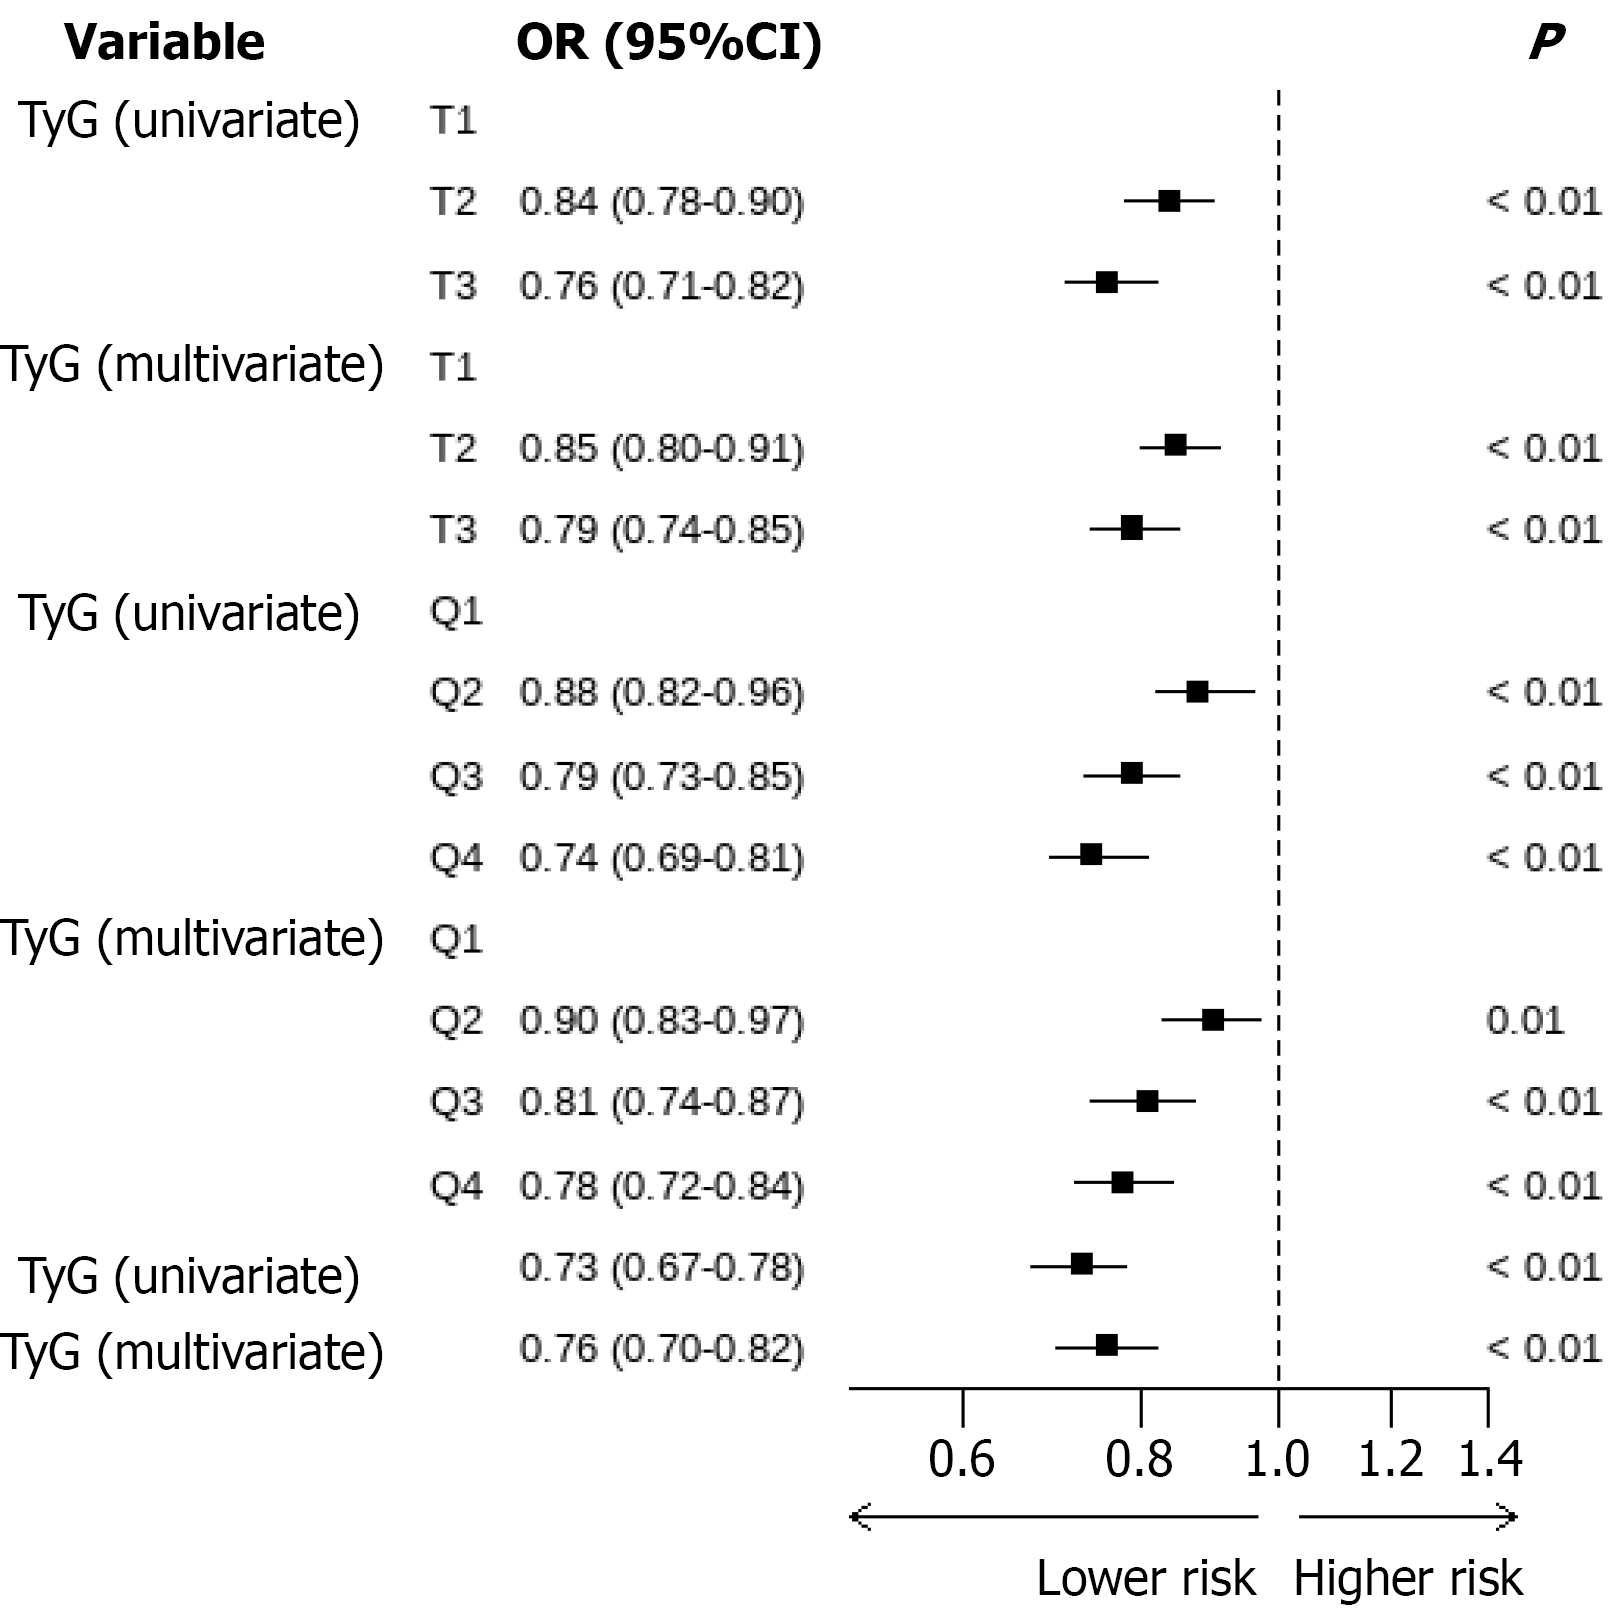
Figure 3 The association between the tertiles and quartiles of triglyceride-glucose index and good plasma glucose control among women with gestational diabetes mellitus based on the univariate and multivariate logistic regression models.
Multivariate logistic regression model adjusted for daily physical exercise time, education, and pre-pregnancy body mass index to access the rate of good plasma glucose control among women with gestational diabetes mellitus. OR: Odds ratio; TyG: Triglyceride-glucose.
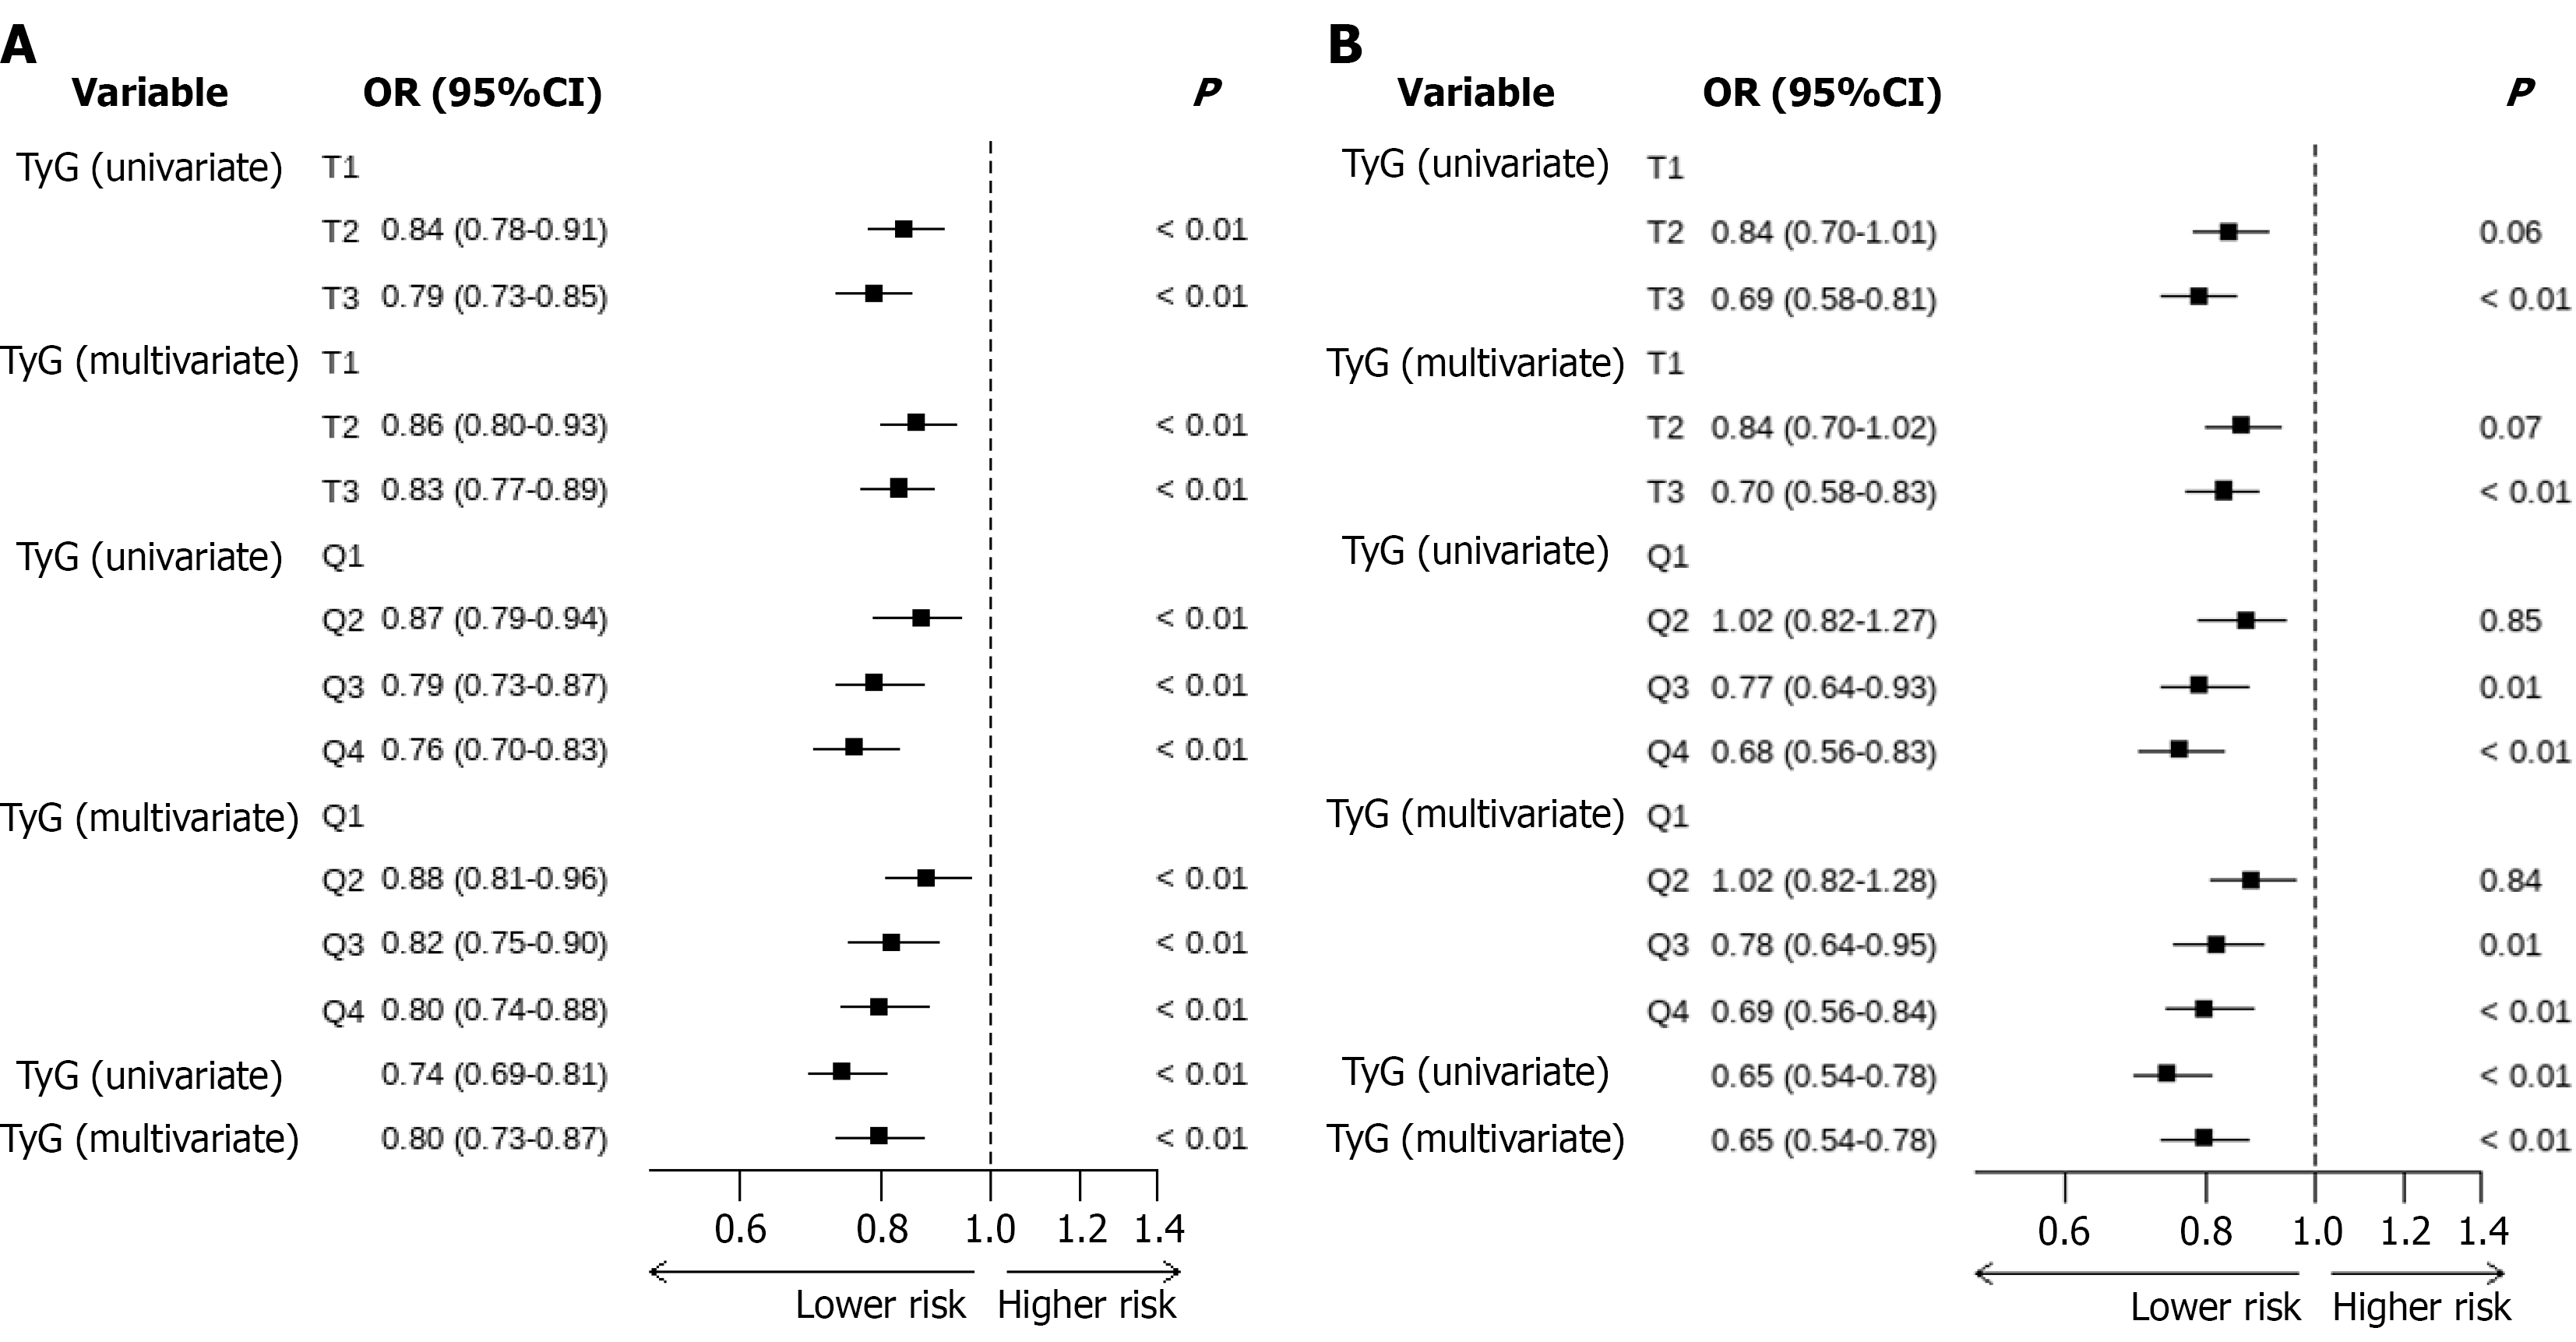
Figure 4 The influence of age for the association between the tertiles and quartiles of triglyceride-glucose index and good plasma glucose control among women with gestational diabetes mellitus based on the univariate and multivariate logistic regression models.
A: Subgroup with age < 35 years; B: Subgroup with age ≥ 35 years. Multivariate logistic regression model adjusted for daily physical exercise time, education, and pre-pregnancy body mass index to access the rate of good plasma glucose control among women with gestational diabetes mellitus. OR: Odds ratio; TyG: Triglyceride-glucose.
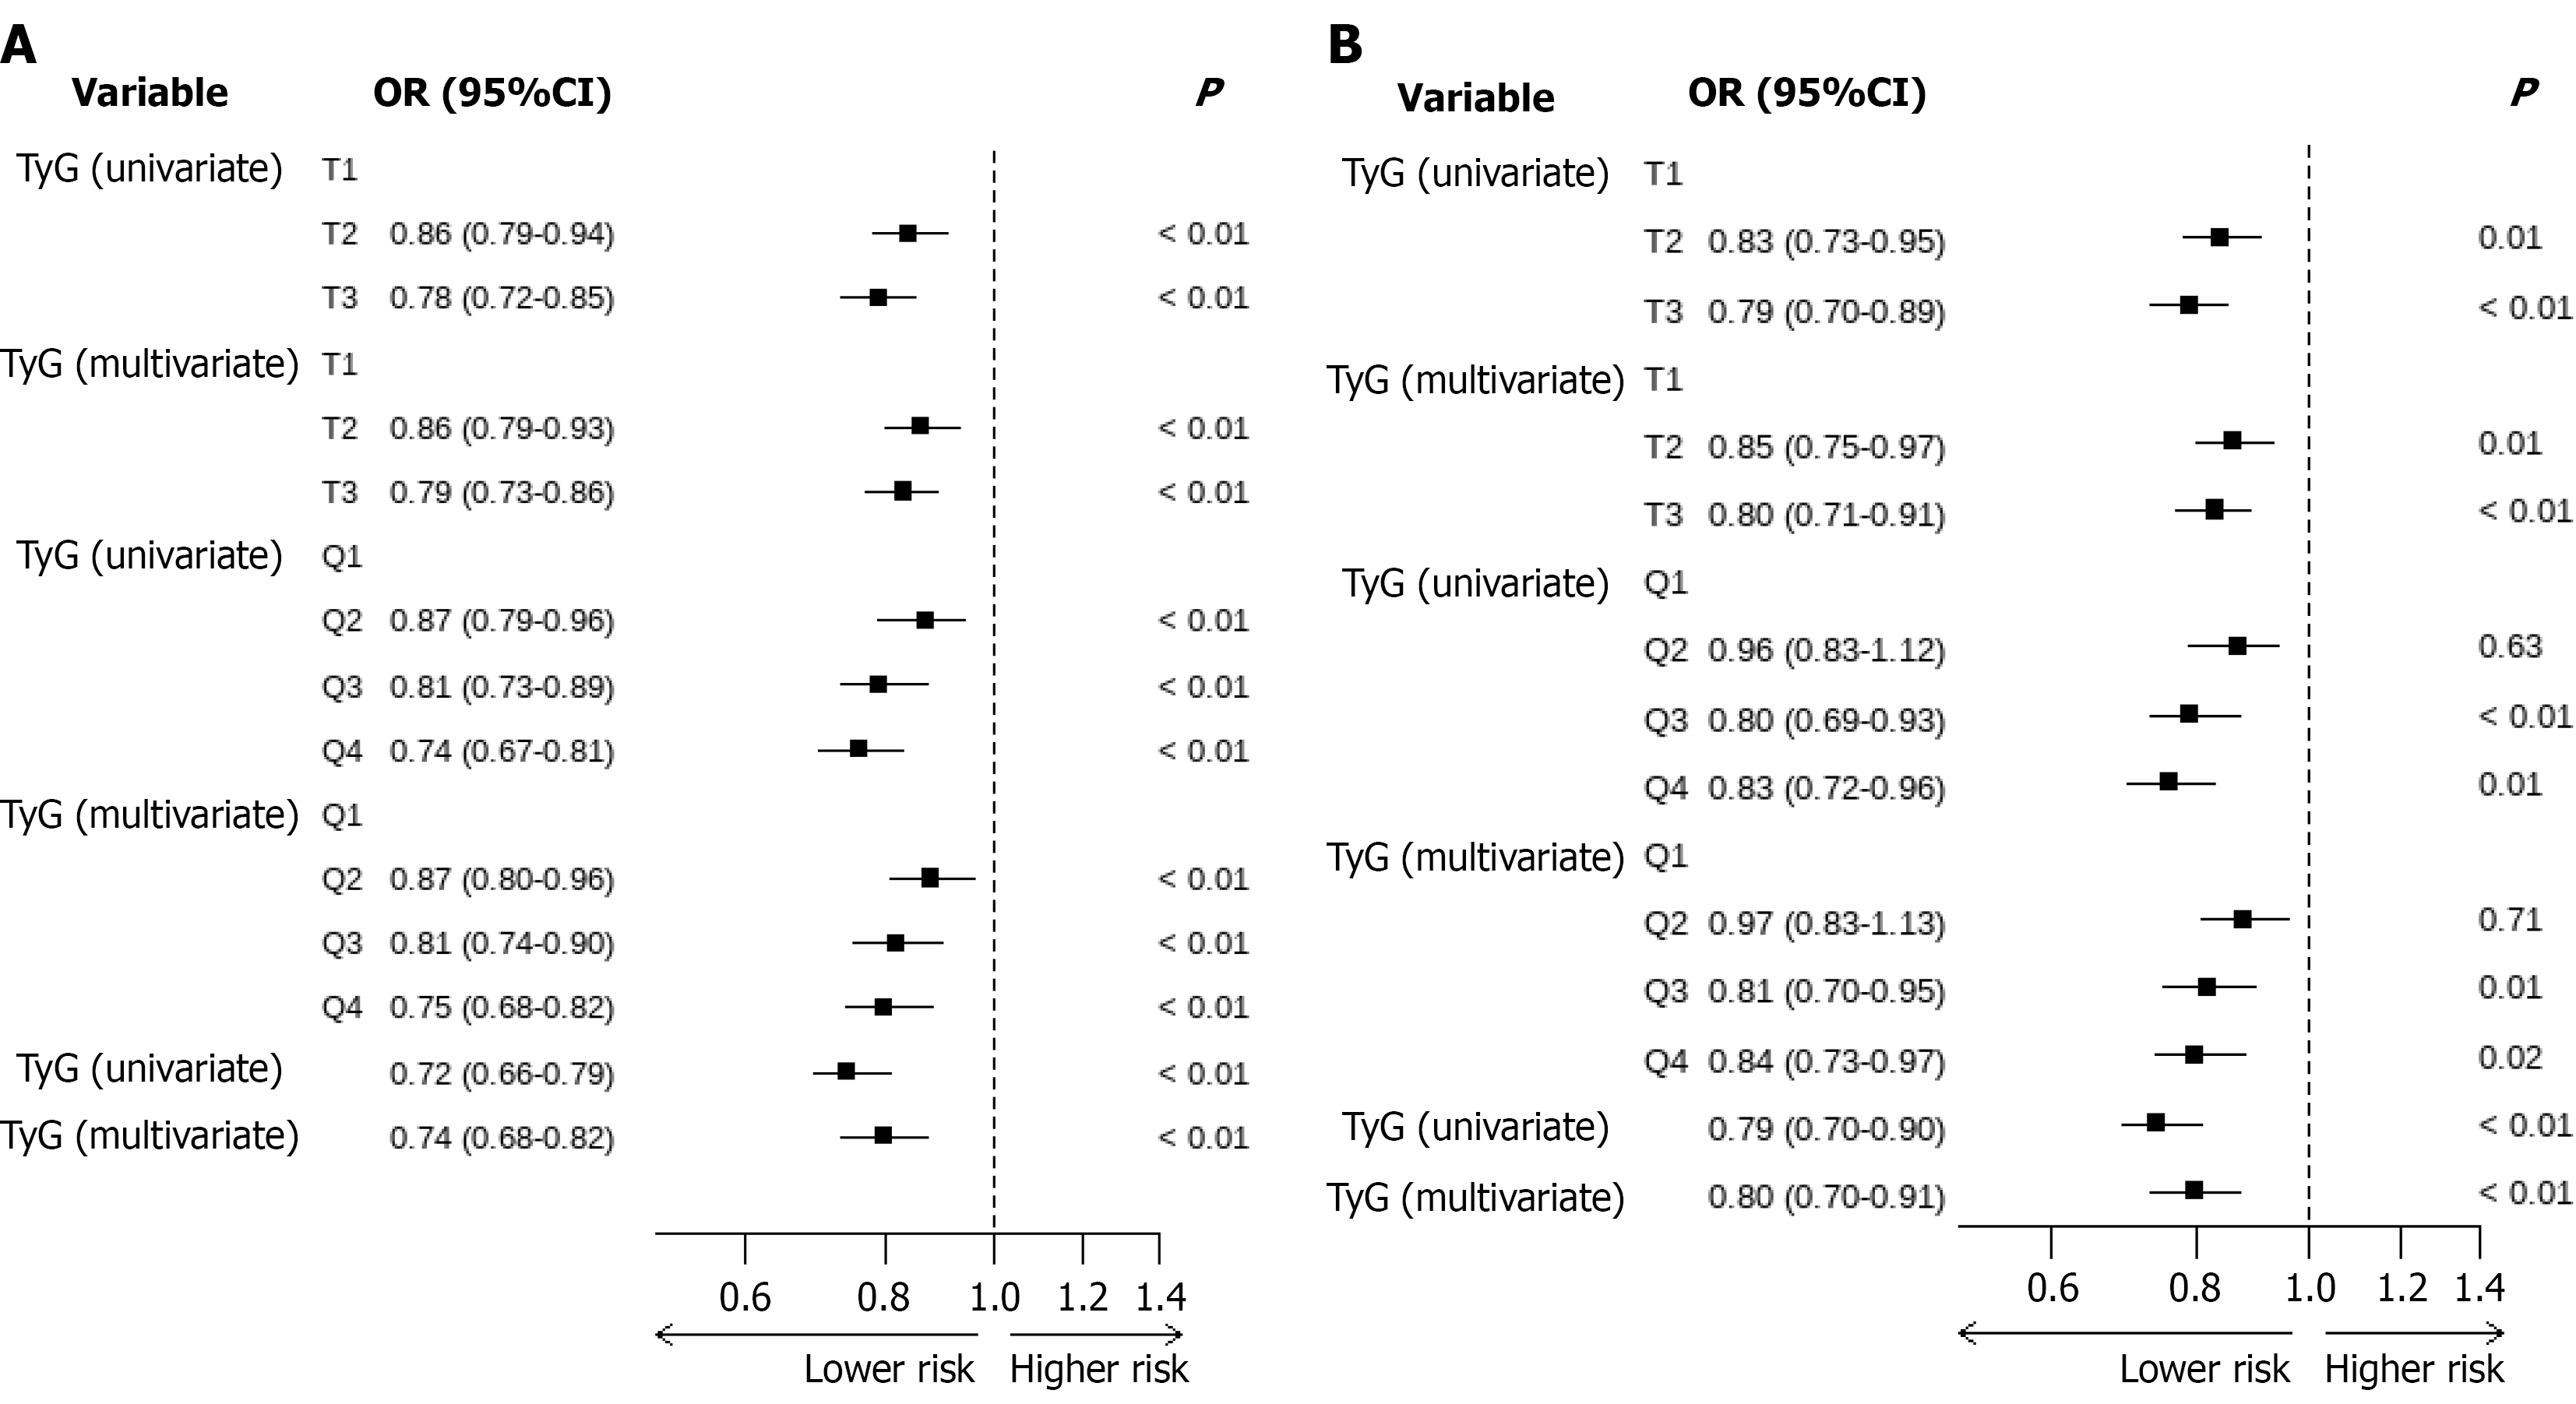
Figure 5 The influence of pre-pregnancy body mass index for the association between the tertiles and quartiles of triglyceride-glucose index and good plasma glucose control among women with gestational diabetes mellitus based on the univariate and multivariate logistic regression models.
A: Subgroup with pre-pregnancy body mass index < 24 kg/m2; B: Subgroup with pre-pregnancy body mass index ≥ 24 kg/m2. Multivariate logistic regression model adjusted for daily physical exercise time and education to access the rate of good plasma glucose control among women with gestational diabetes mellitus. OR: Odds ratio; TyG: Triglyceride-glucose.
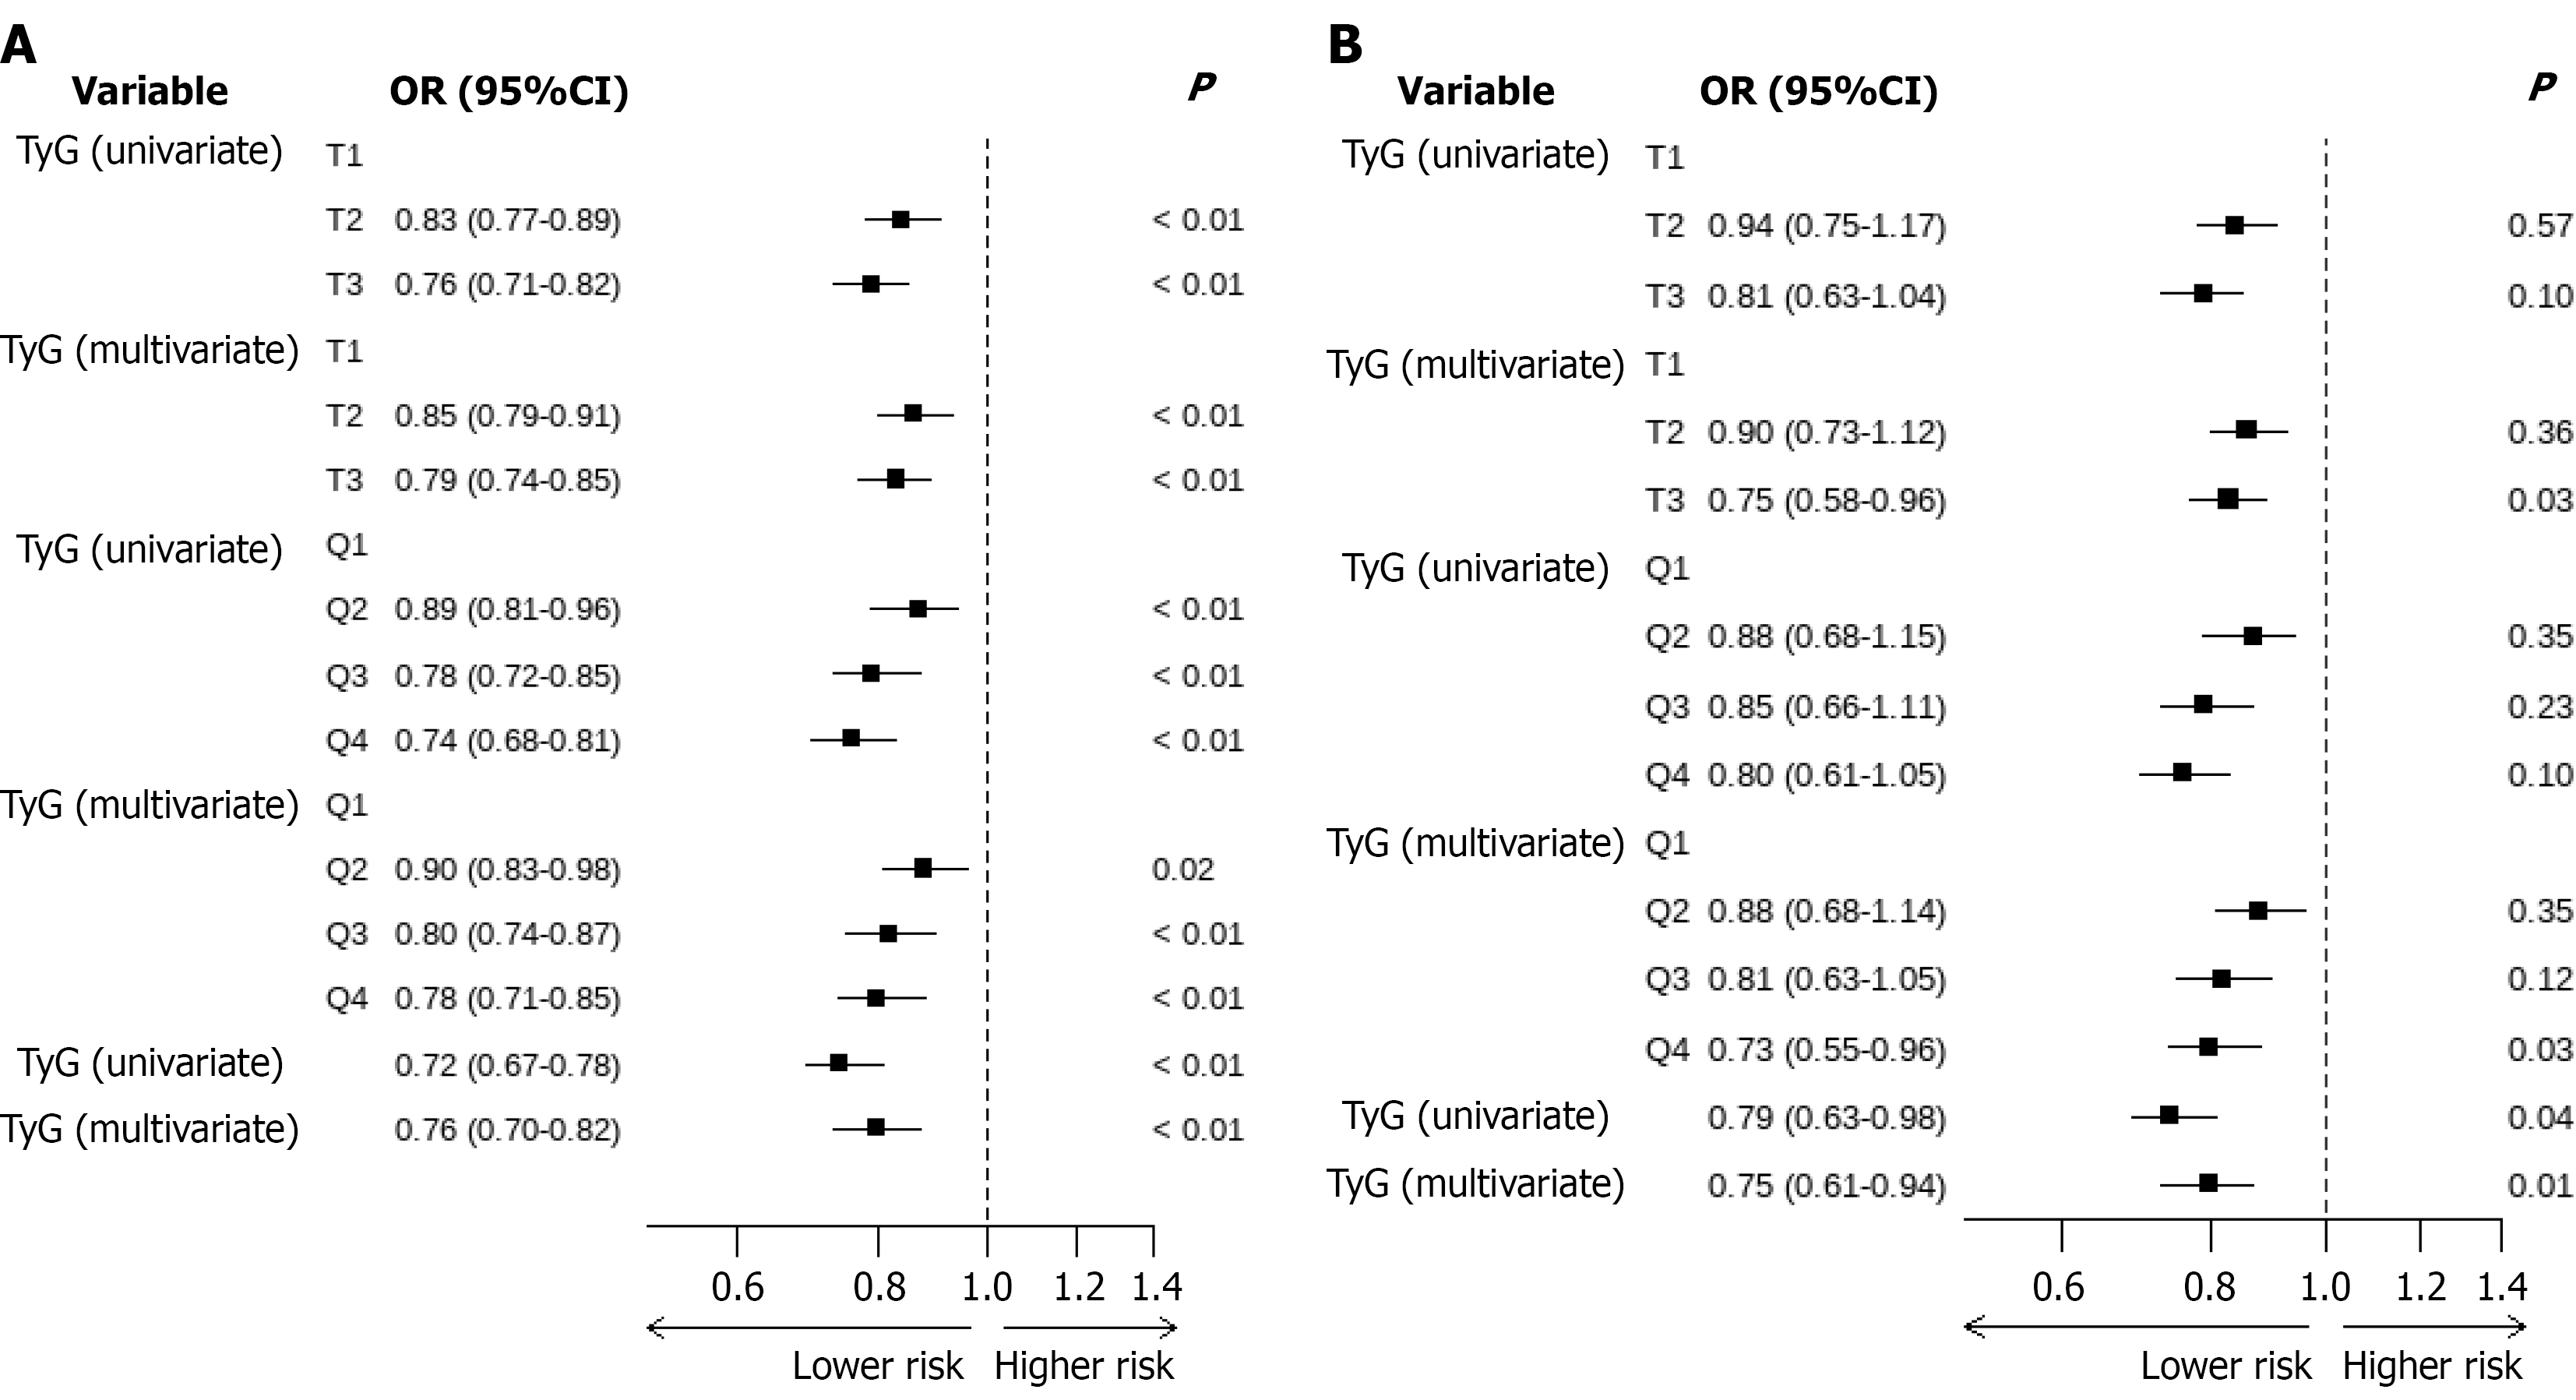
Figure 6 The influence of daily physical exercise time for the association between the tertiles and quartiles of triglyceride-glucose index and good plasma glucose control among women with gestational diabetes mellitus based on the univariate and multivariate logistic regression models.
A: Subgroup with daily physical exercise time < 120 minute/day; B: Subgroup with daily physical exercise time ≥ 120 minute/day. Multivariate logistic regression model adjusted for pre-pregnancy body mass index and education to access the rate of good plasma glucose control among women with gestational diabetes mellitus. OR: Odds ratio; TyG: Triglyceride-glucose.
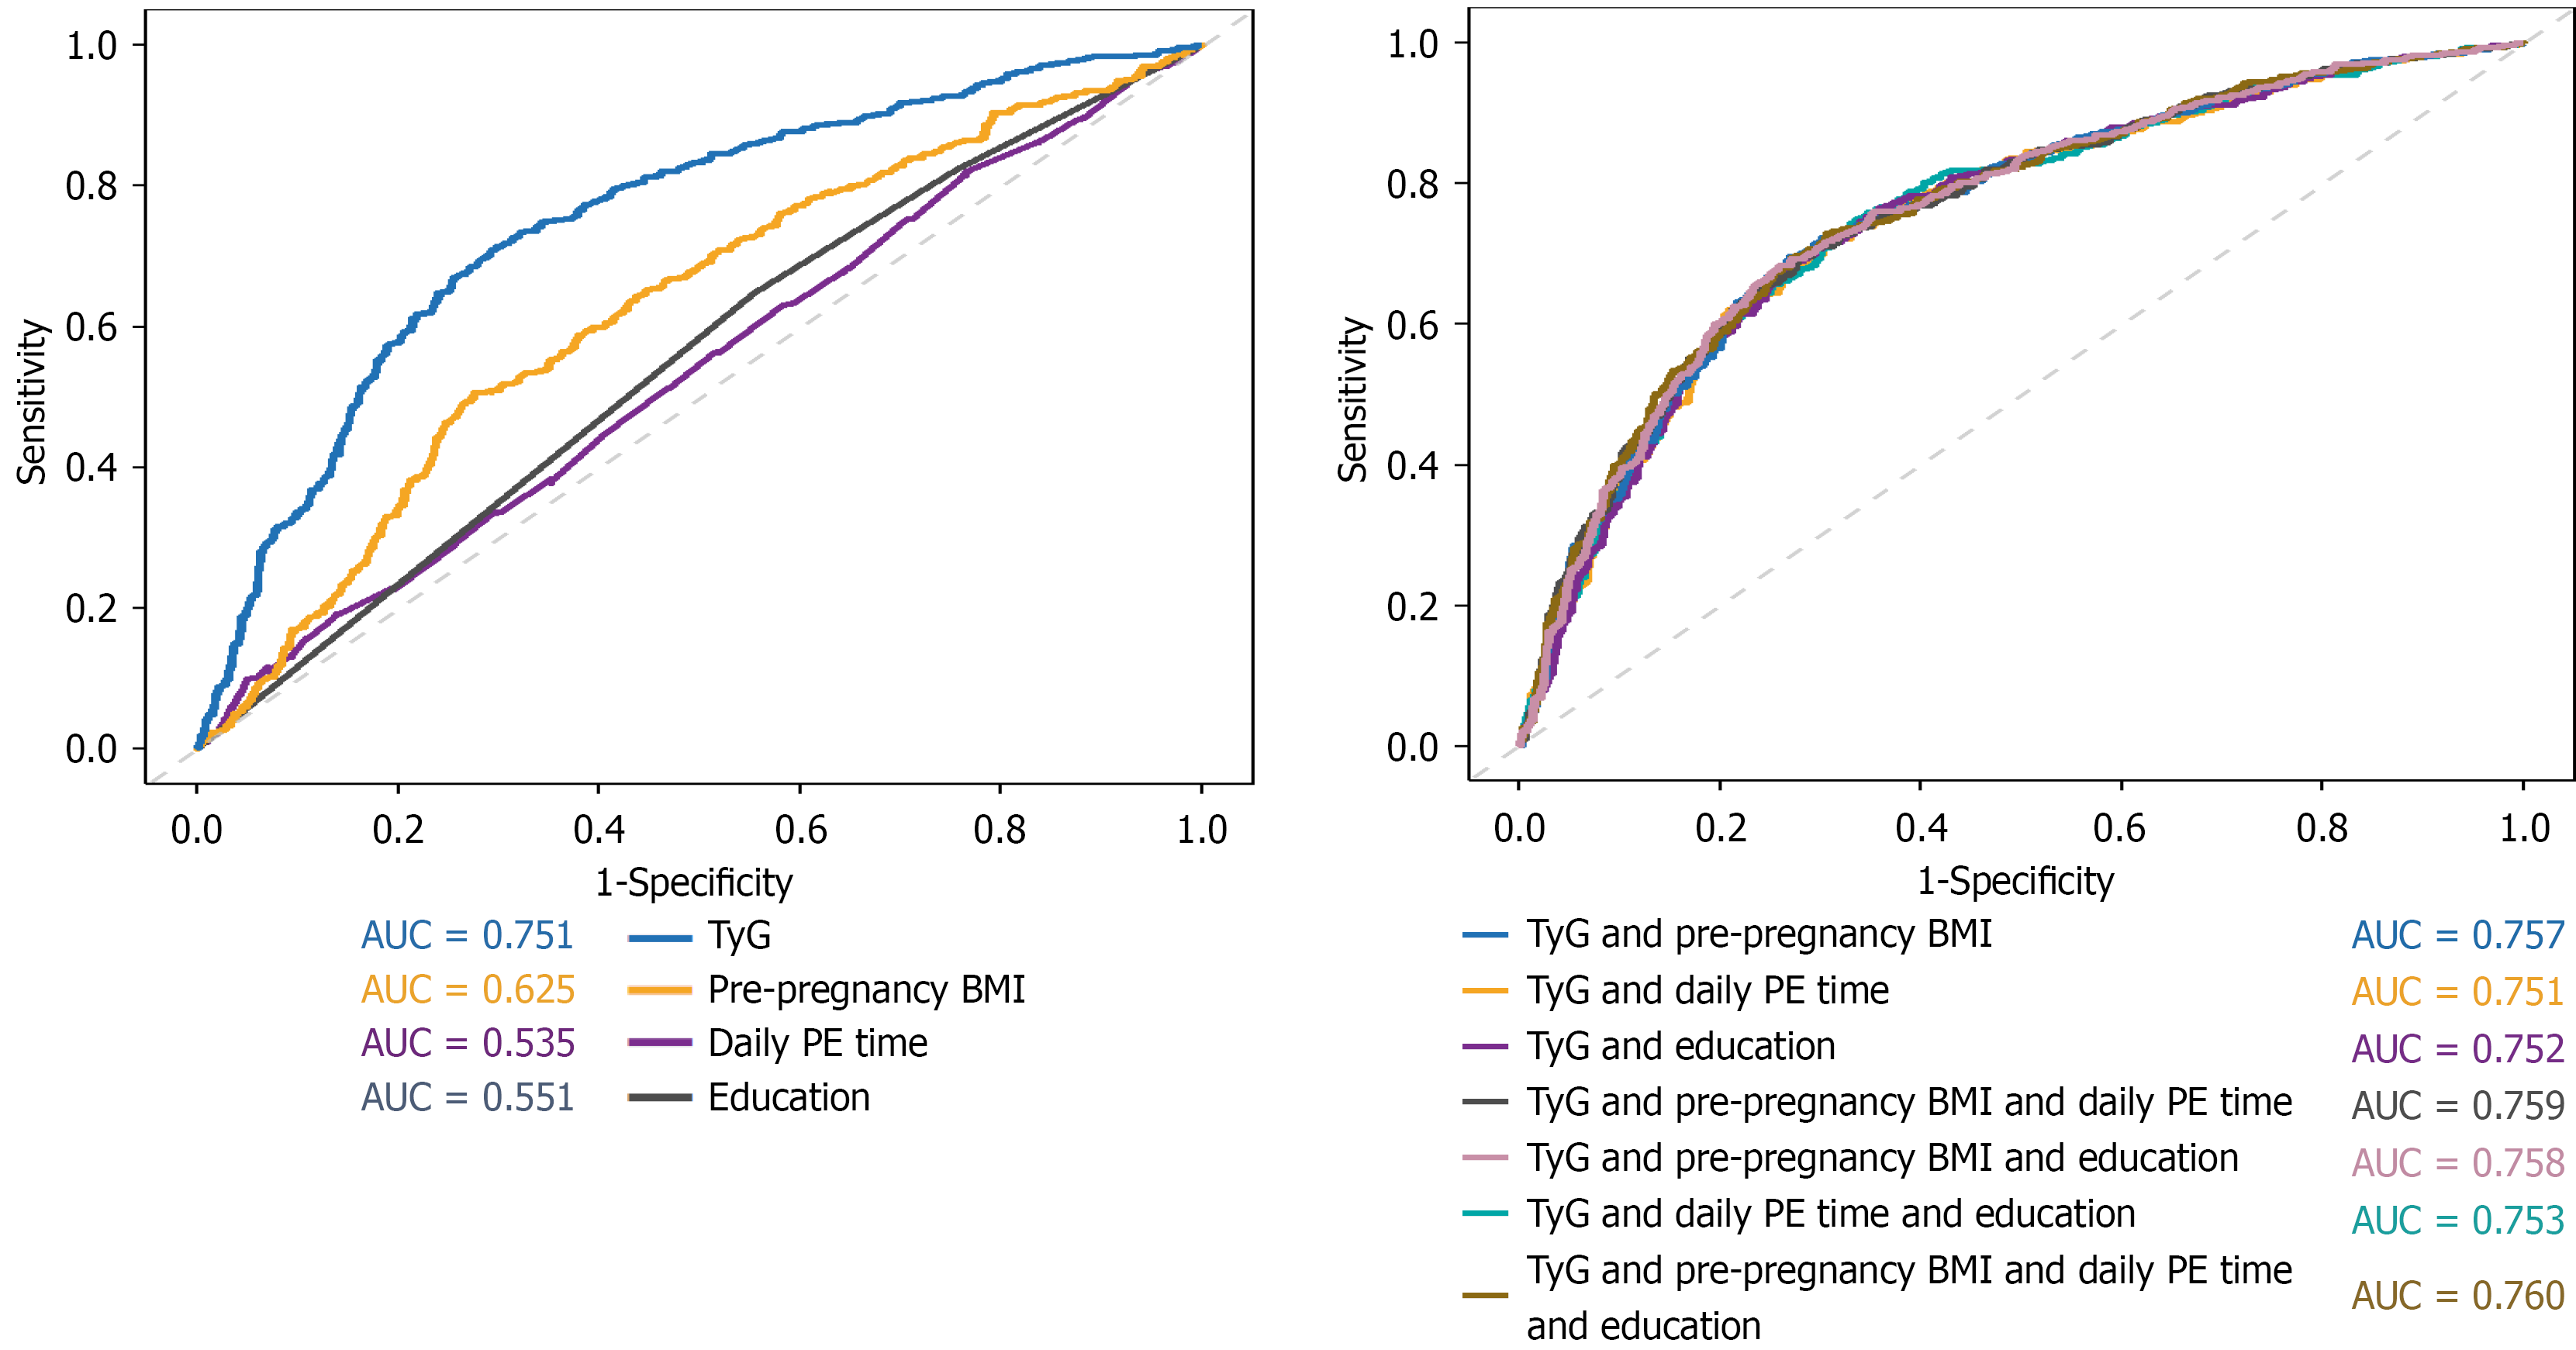
Figure 7 Receiver operating characteristic curves of four indicators for predicting plasma glucose control after the diagnosis of gestational diabetes mellitus.
AUC: Area under curve; TyG: Triglyceride-glucose; BMI: Body mass index; PE: Physical exercise.
- Citation: Zhang XQ, Cheng CX, Duan Z, Cai RQ, Gao XJ, Zhang R, Yang Q, Wang RP. Elevated triglyceride-glucose index predicts poor third-trimester glycemic control among gestational diabetes mellitus women: A prospective study in Shanghai. World J Diabetes 2026; 17(10): 124659
- URL: https://www.wjgnet.com/1948-9358/full/v17/i10/124659.htm
- DOI: https://dx.doi.org/10.4239/wjd.124659