
















Copyright: ©Author(s) 2026.
World J Diabetes. Oct 15, 2026; 17(10): 124186
Published online Oct 15, 2026. doi: 10.4239/wjd.124186
Published online Oct 15, 2026. doi: 10.4239/wjd.124186
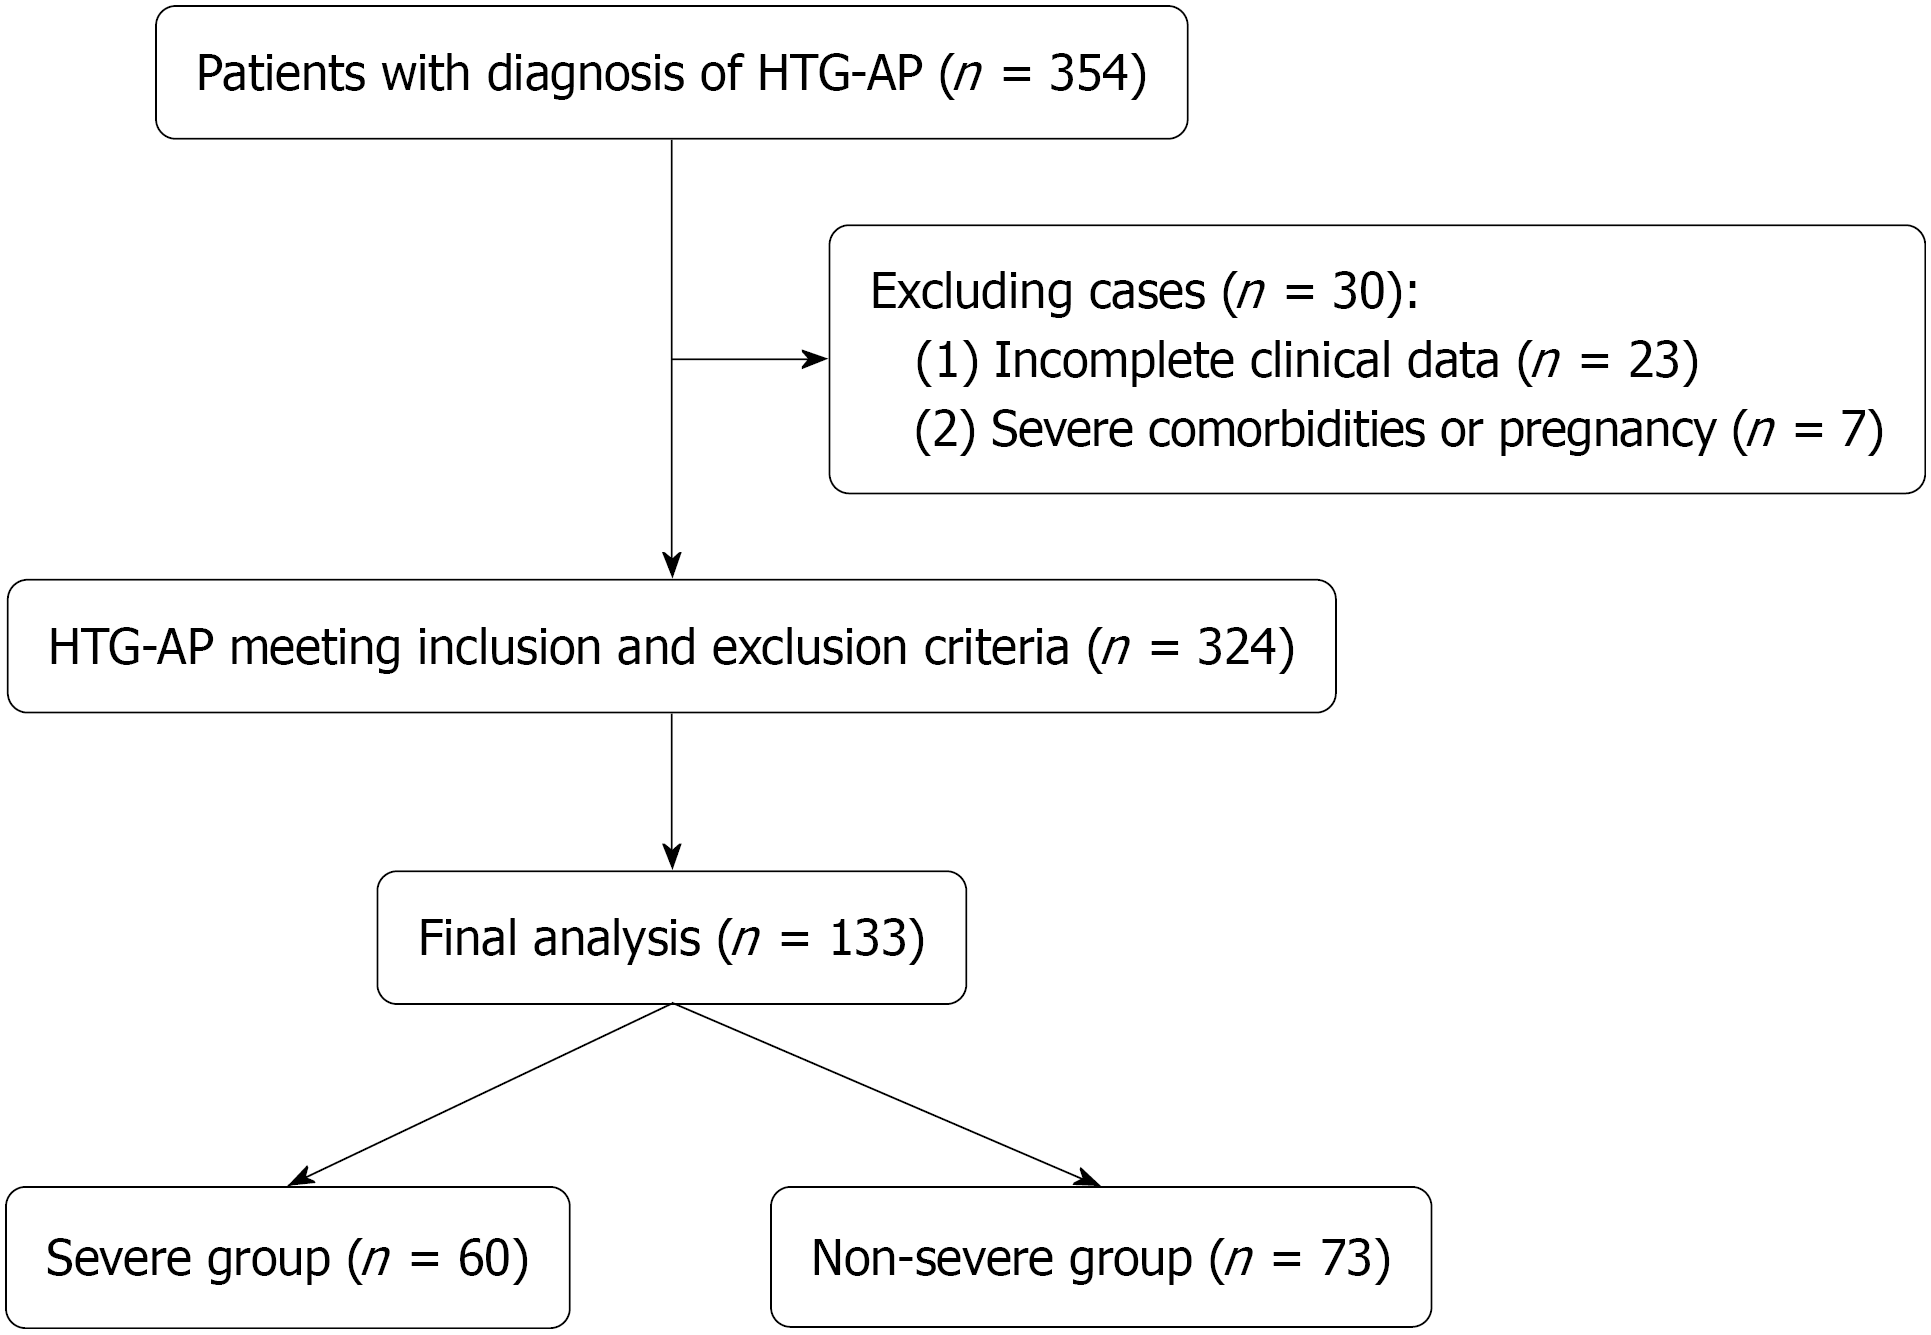
Figure 1 Participant selection flowchart.
HTG-AP: Hypertriglyceridemia-induced acute pancreatitis.
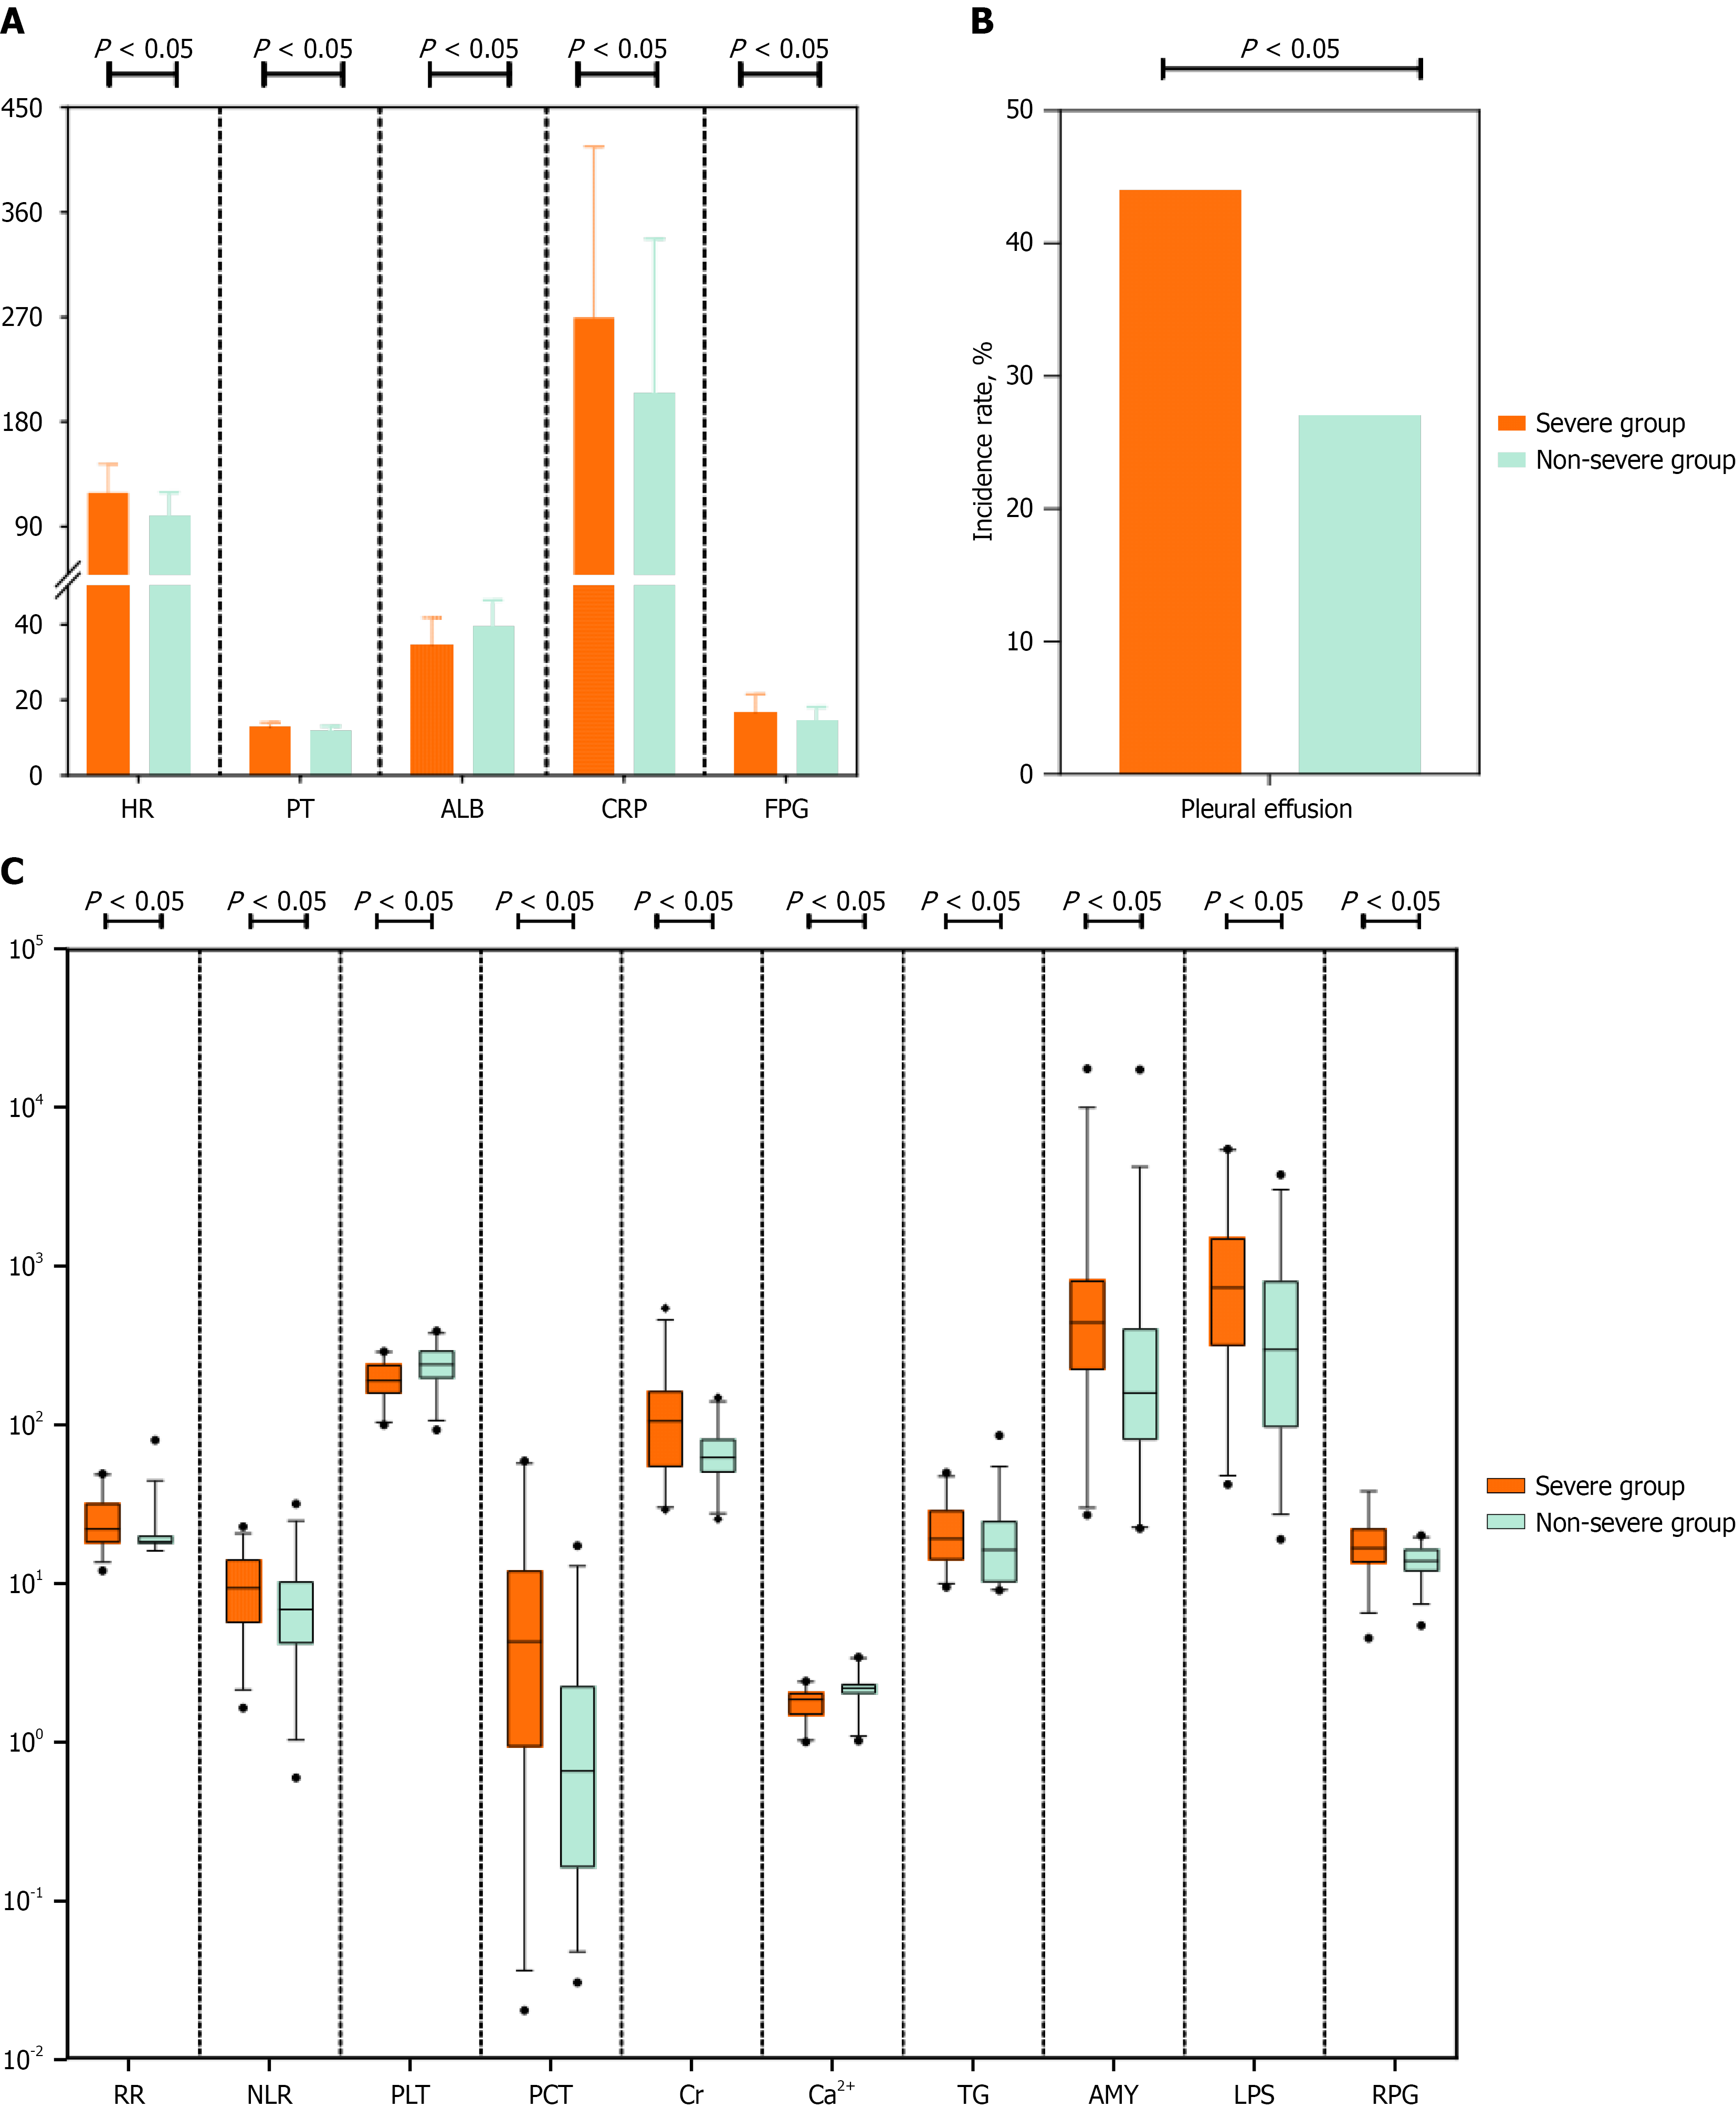
Figure 2 Graphic illustrations of clinical data in patients with hypertriglyceridemia-induced acute pancreatitis combined with diabetes mellitus.
P < 0.05. A: Bar chart of statistically significant normally distributed variables. The X-axis represents the variable names, and the Y-axis represents the variable values (units not shown); B: Bar chart of statistically significant categorical variables. The X-axis represents the variable names, and the Y-axis represents the proportions of each variable (%); C: Boxplot of statistically significant nonnormally distributed variables. The X-axis represents the variable names, and the Y-axis represents the common logarithm (log10) of the variable values (units not shown). HR: Heart rate; PT: Prothrombin time; ALB: Albumin; CRP: C-reactive protein; FPG: Fasting plasma glucose; RR: Respiratory rate; NLR: Neutrophil-to-lymphocyte ratio; PLT: Platelets; PCT: Procalcitonin; Cr: Creatinine; TG: Triglyceride; AMY: Serum amylase; LPS: Serum lipase; RPG: Random plasma glucose.
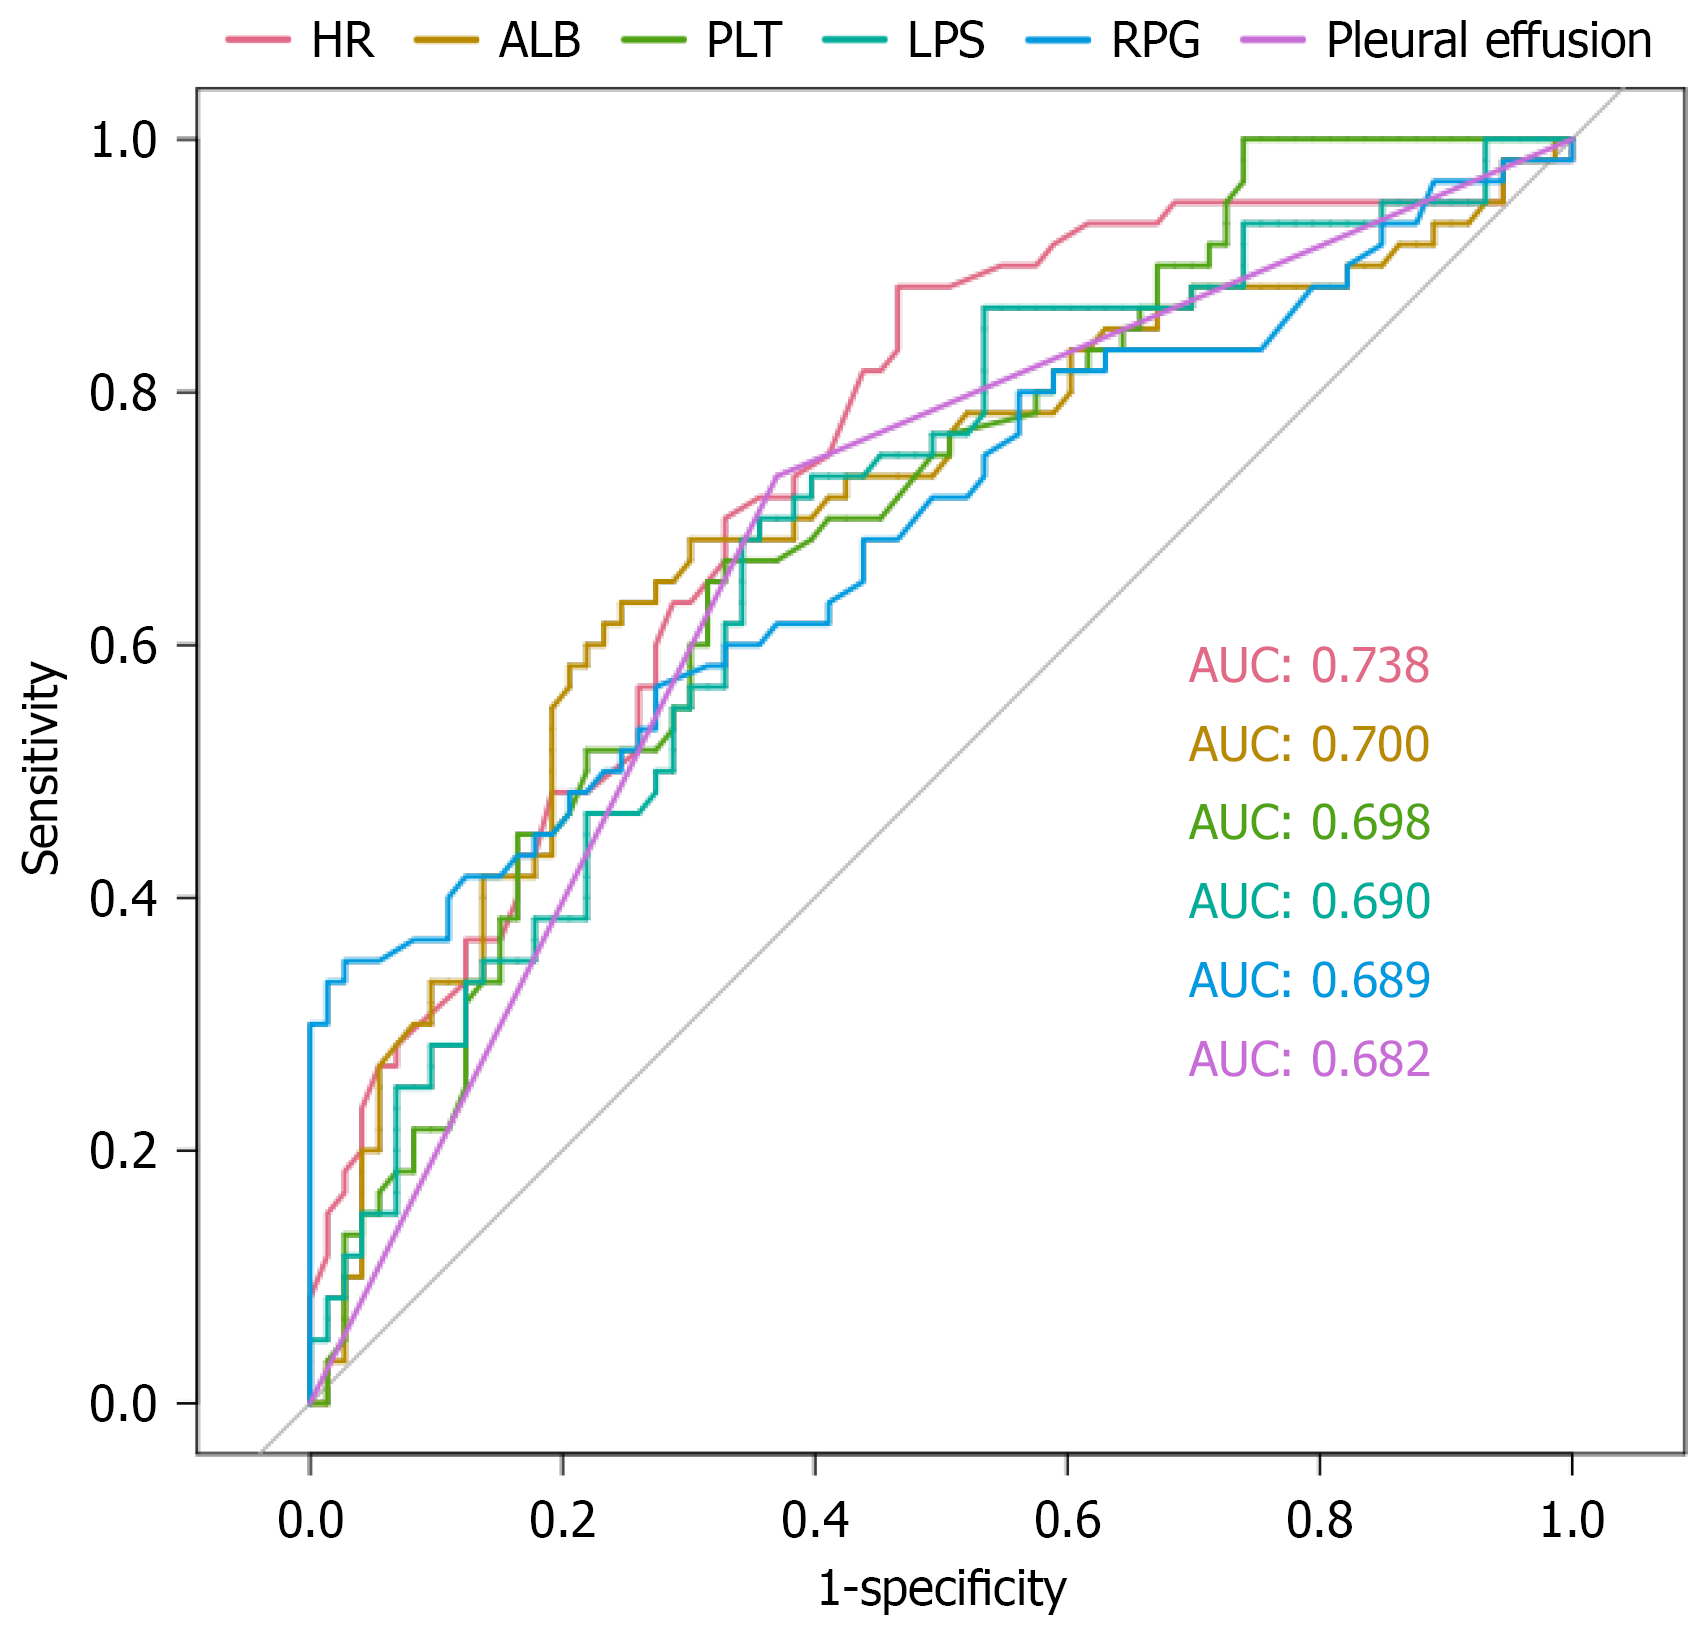
Figure 3 Receiver operating characteristic curve of independent predictors among patients.
AUC: Area under curve; HR: Heart rate; ALB: Albumin; PLT: Platelets; LPS: Serum lipase; RPG: Random plasma glucose.
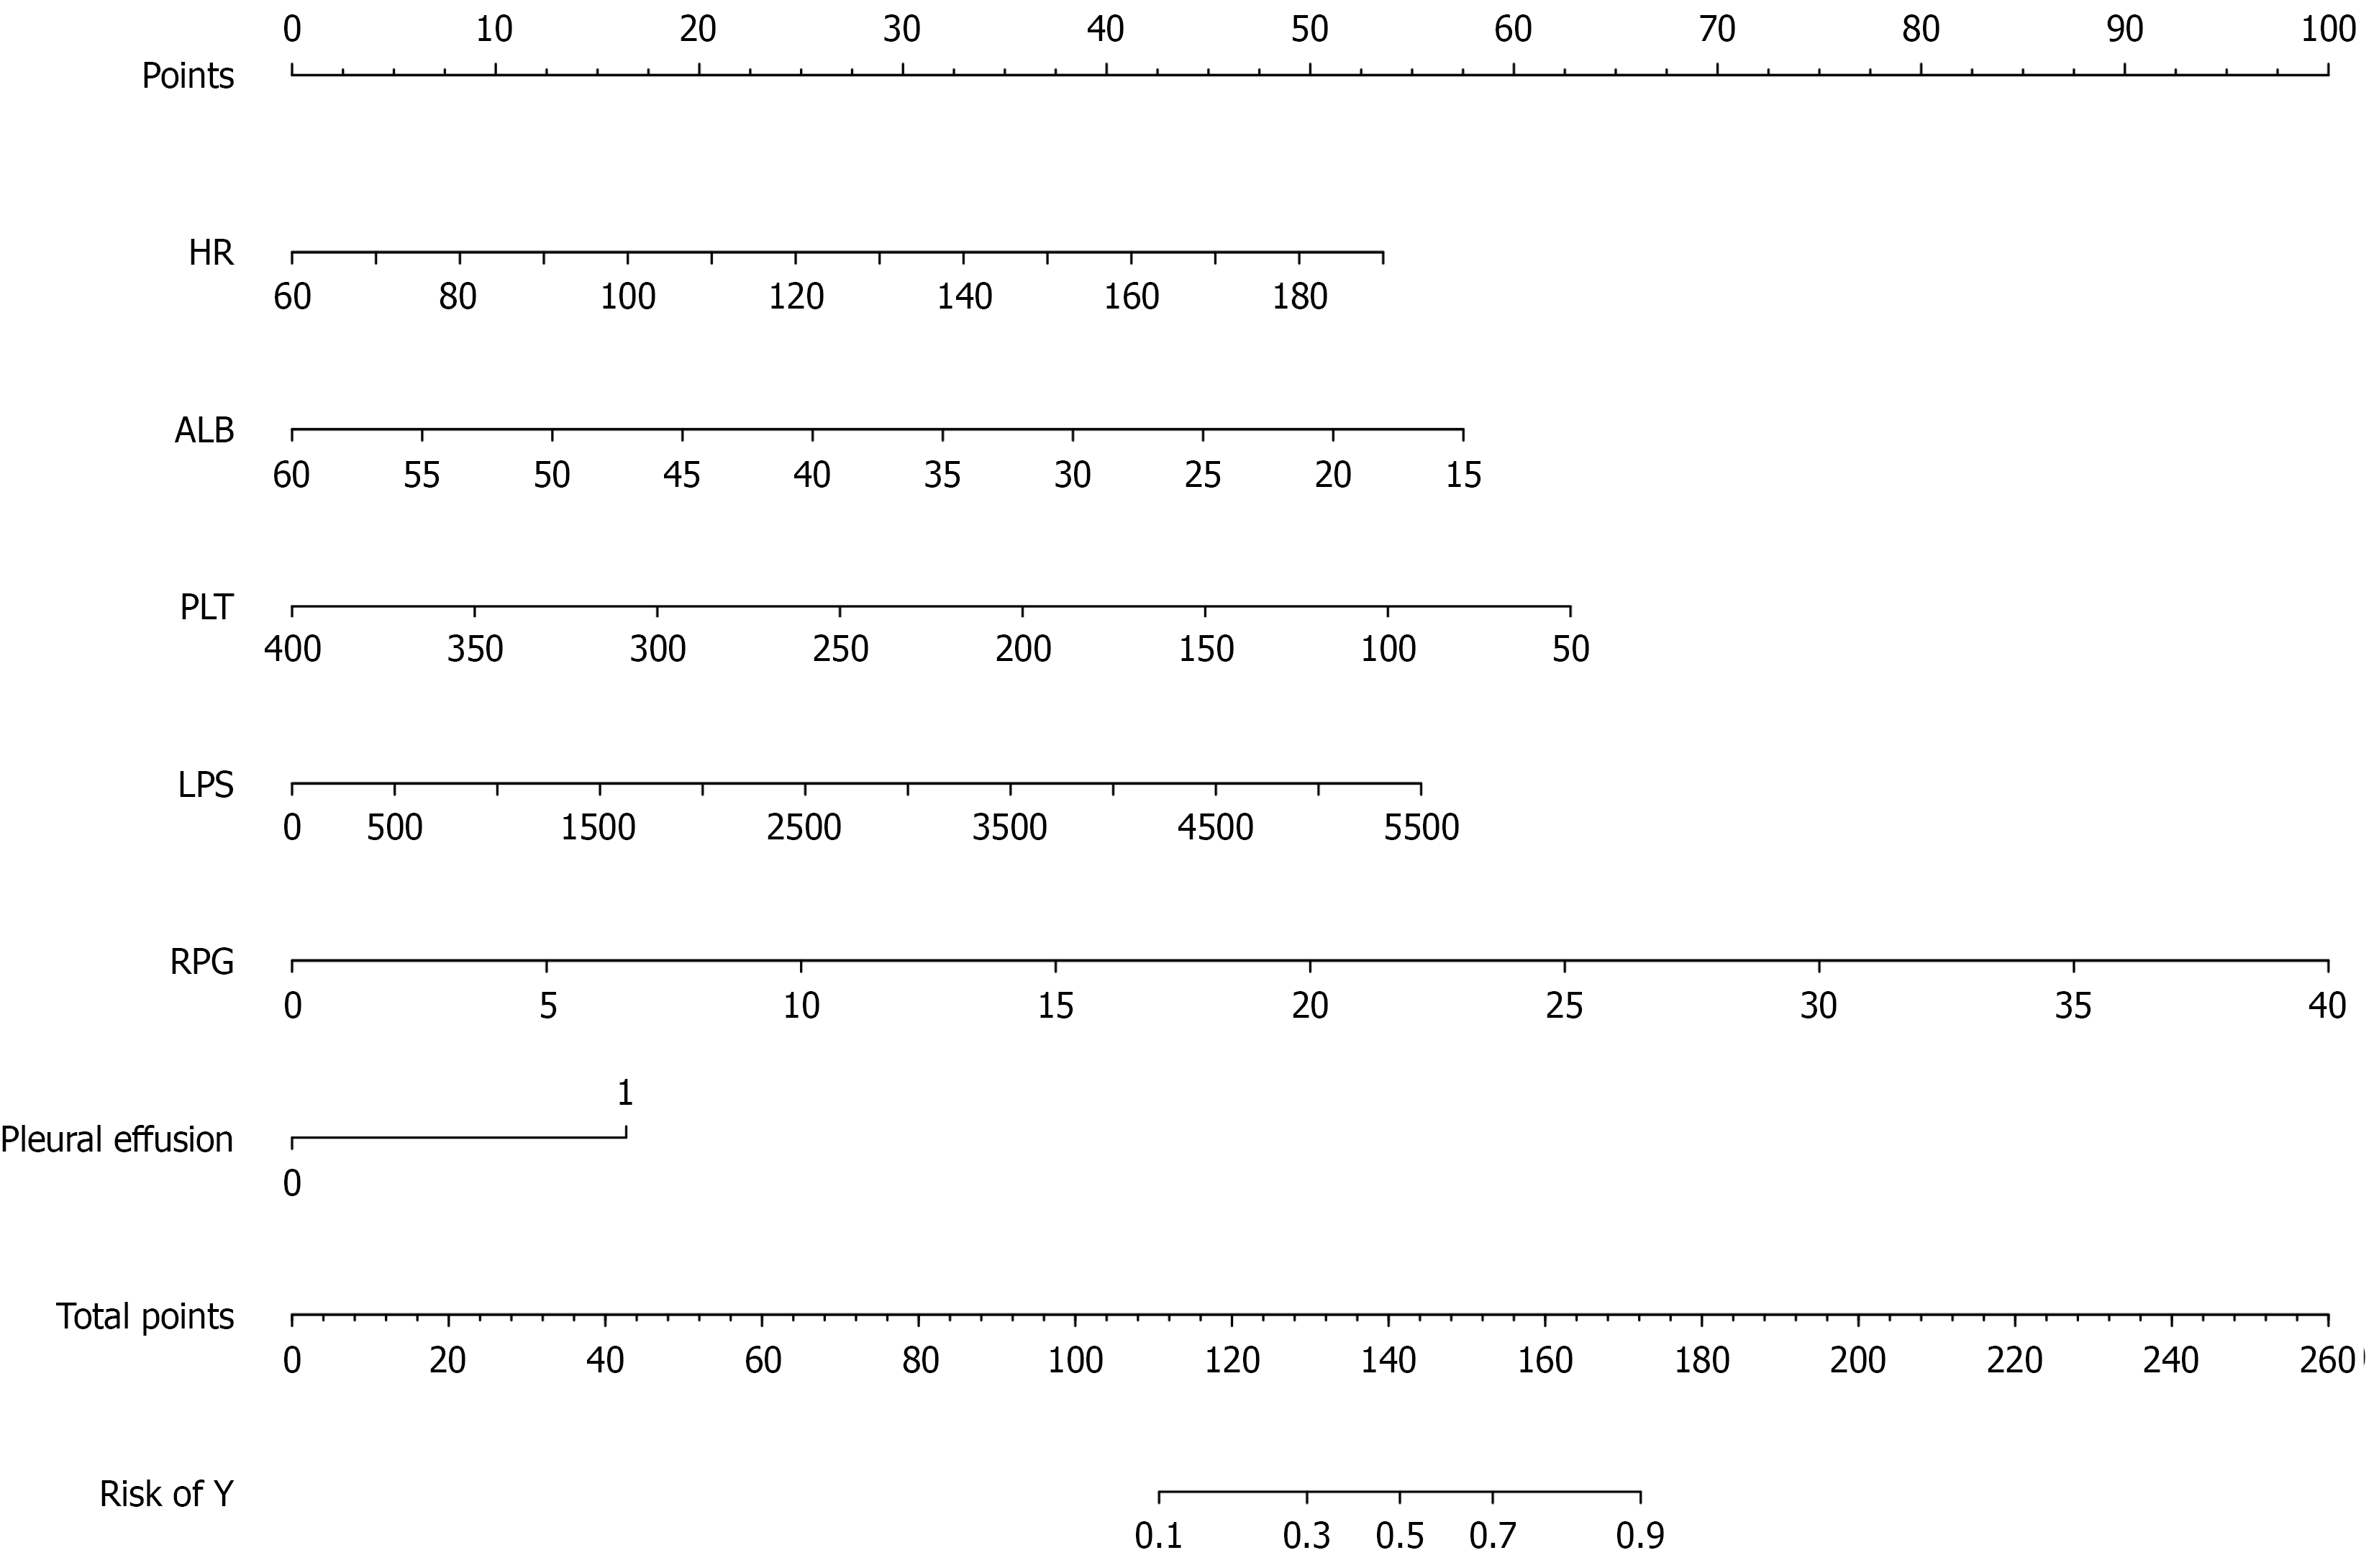
Figure 4 Nomogram for predicting the severity risk in patients with hypertriglyceridemia-induced acute pancreatitis combined with diabetes mellitus.
The nomogram is used by summing all points identified on the scale for each variable. The total points projected on the bottom scales indicated the likelihood of disease severity. HR: Heart rate; ALB: Albumin; PLT: Platelets; LPS: Serum lipase; RPG: Random plasma glucose.
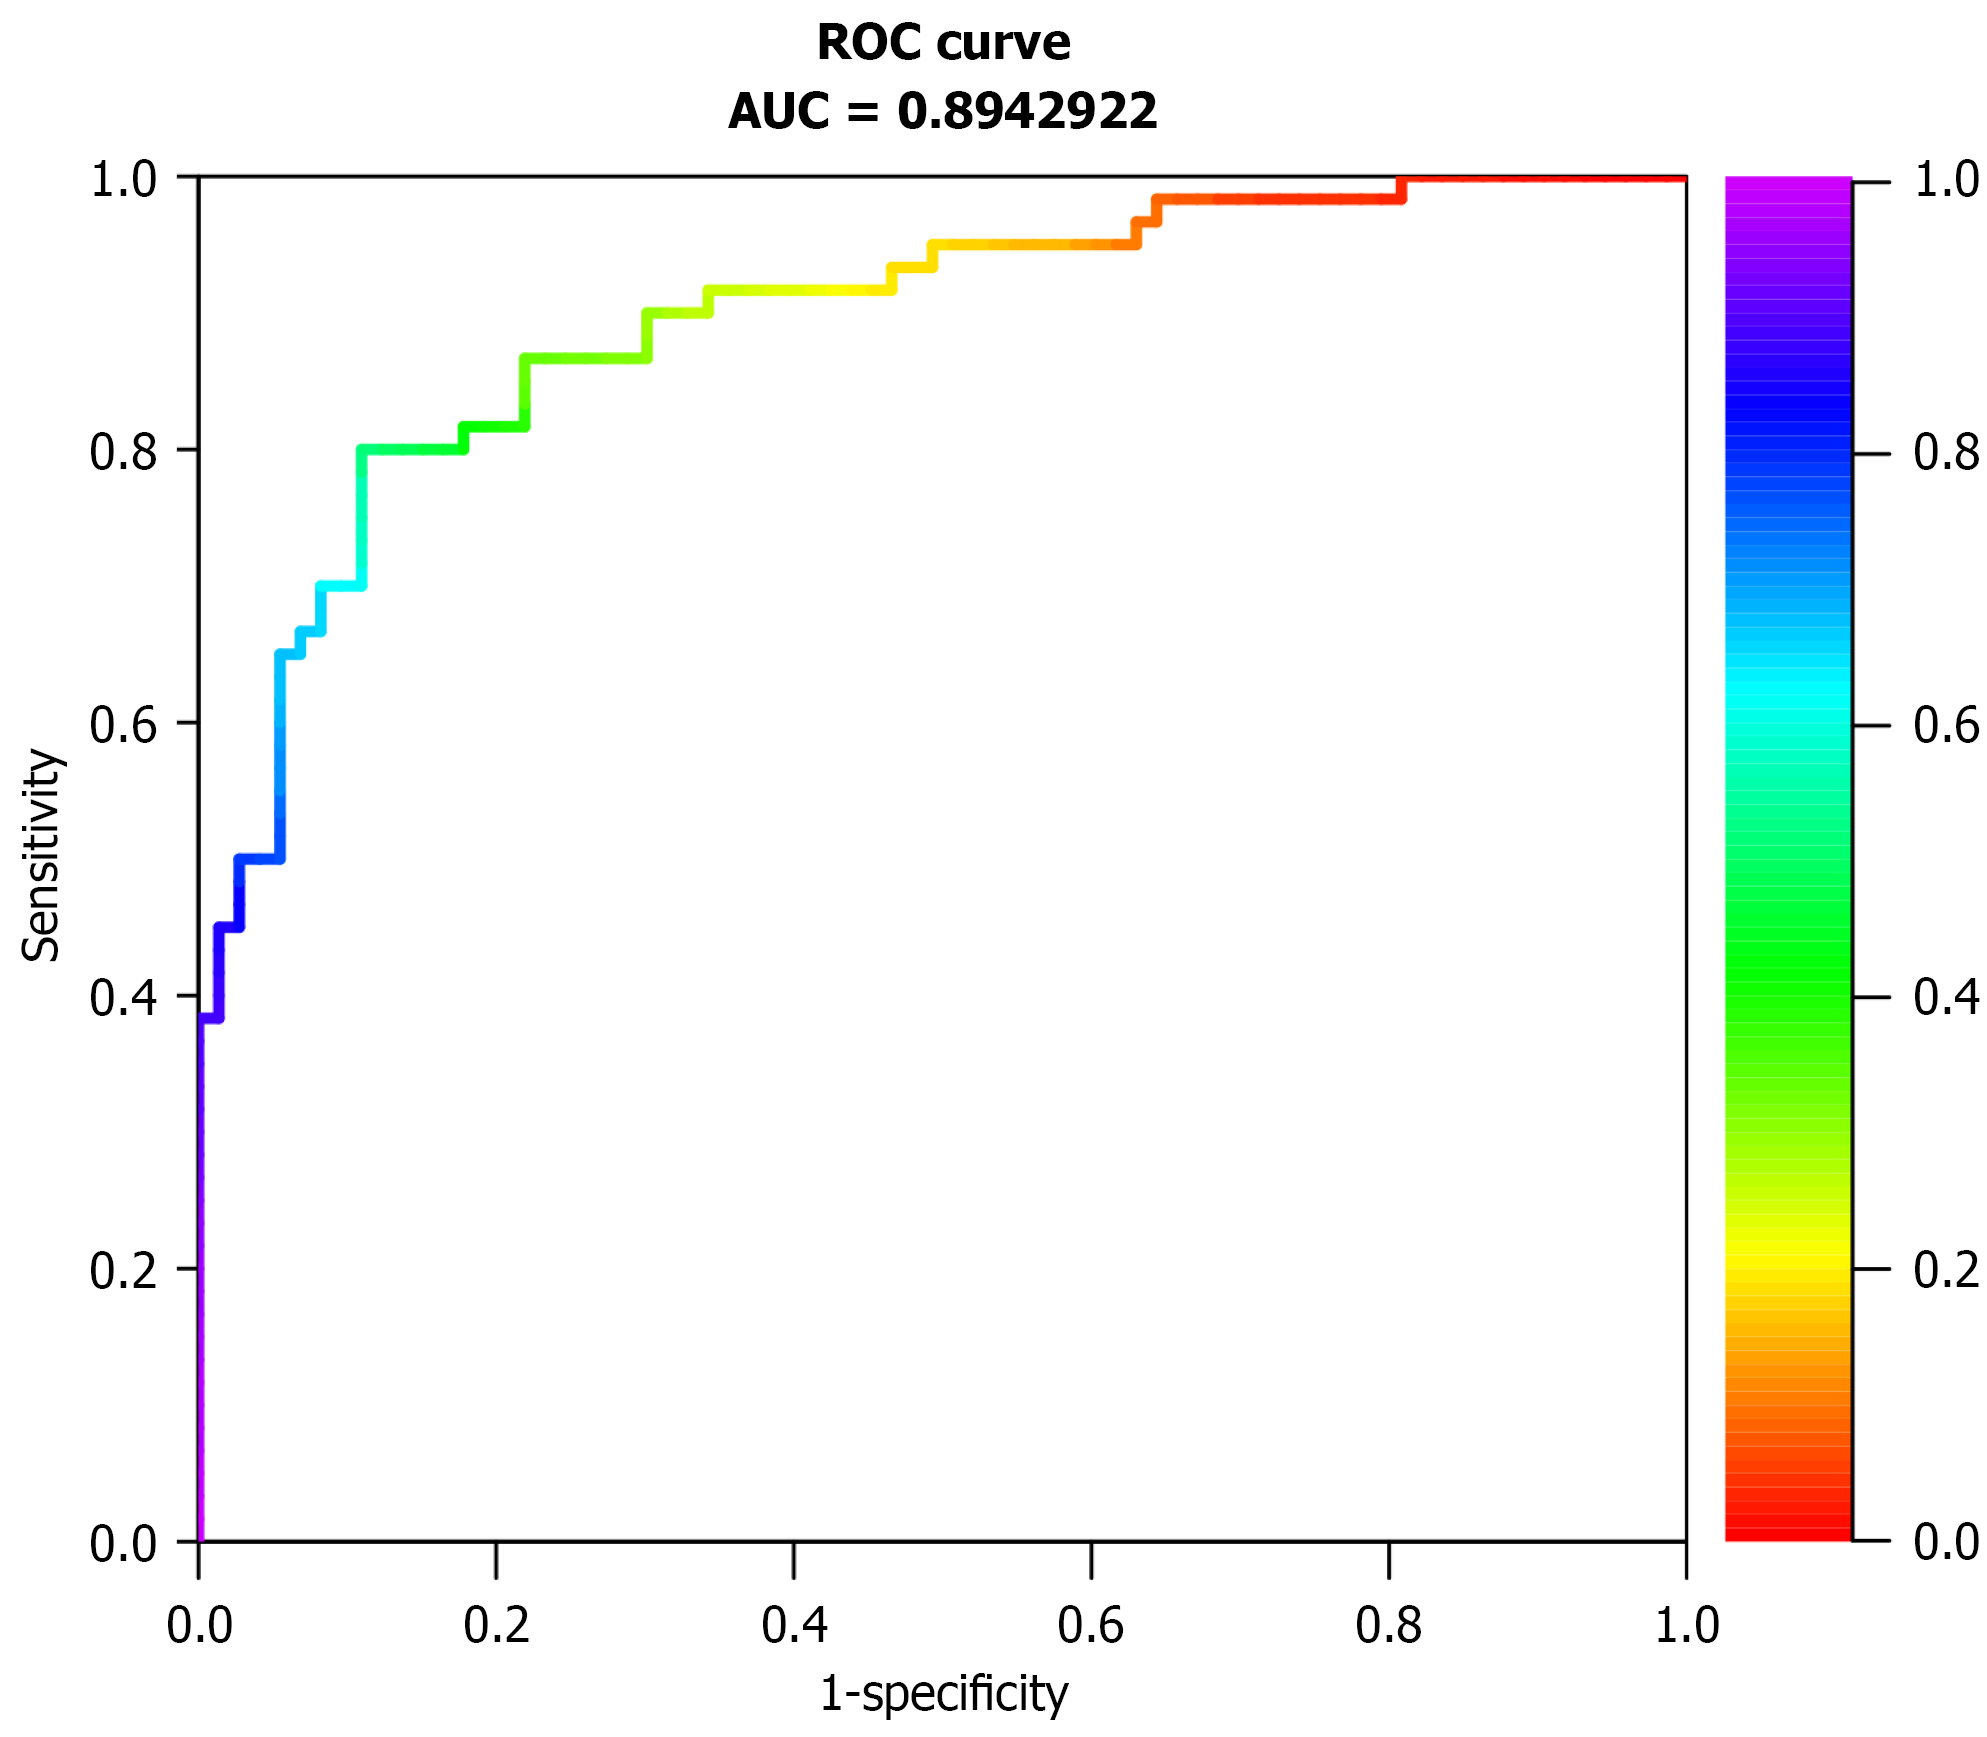
Figure 5 Receiver operating characteristics curves of the predictive model for severity prediction.
ROC: Receiver operating characteristic; AUC: Area under curve.
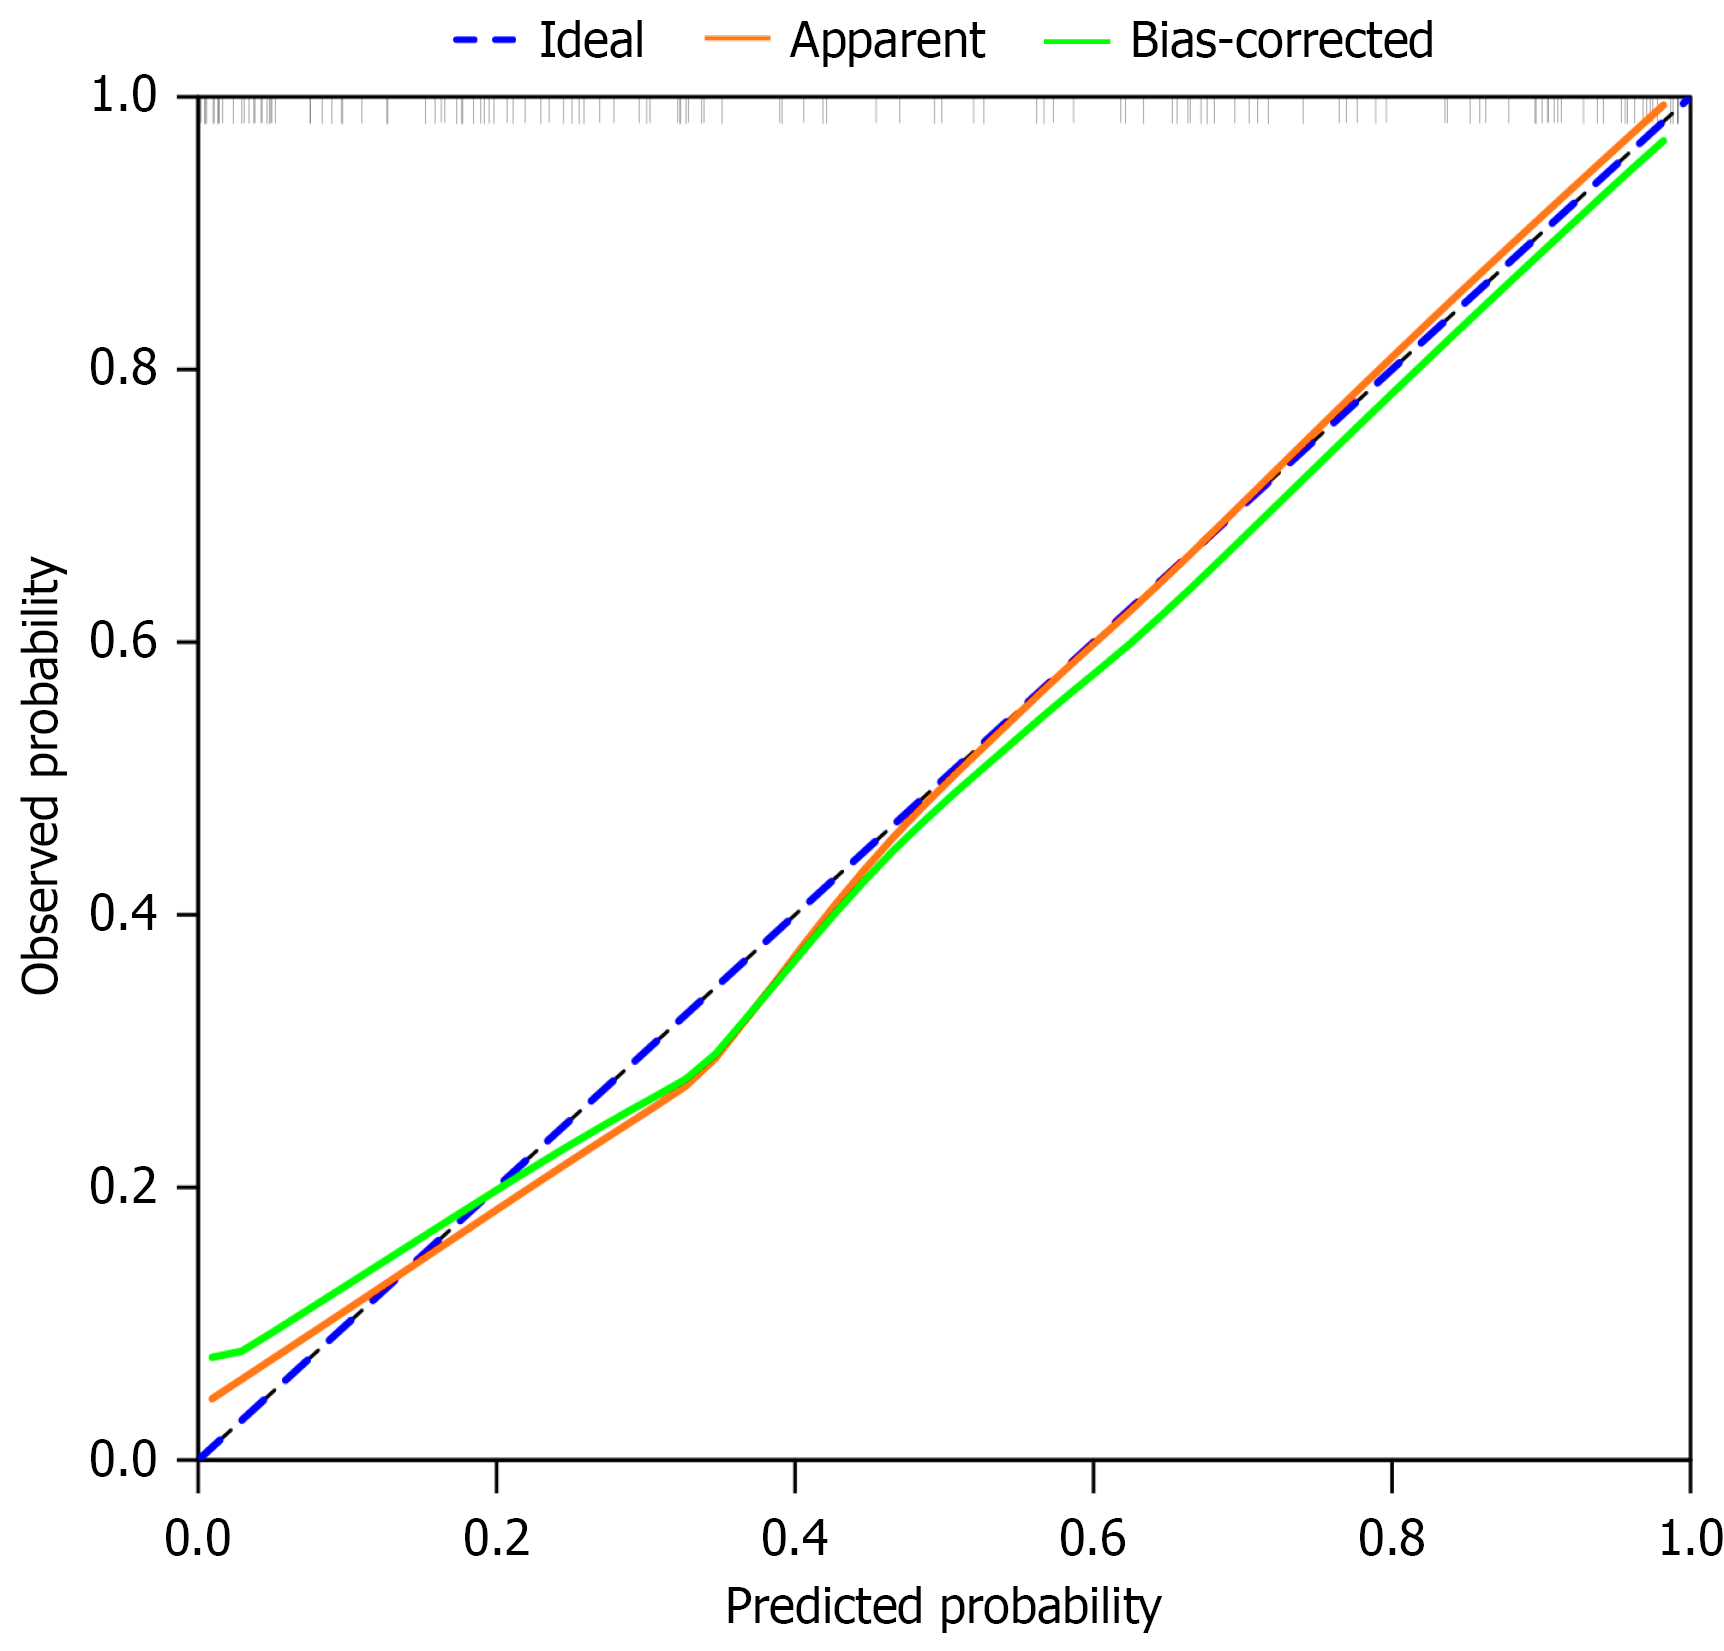
Figure 6 Correction curves for predicting severity in hypertriglyceridemia-induced acute pancreatitis combined with diabetes mellitus patients.
The nomogram model plots predicted severity on the X-axis and actual severity on the Y-axis.
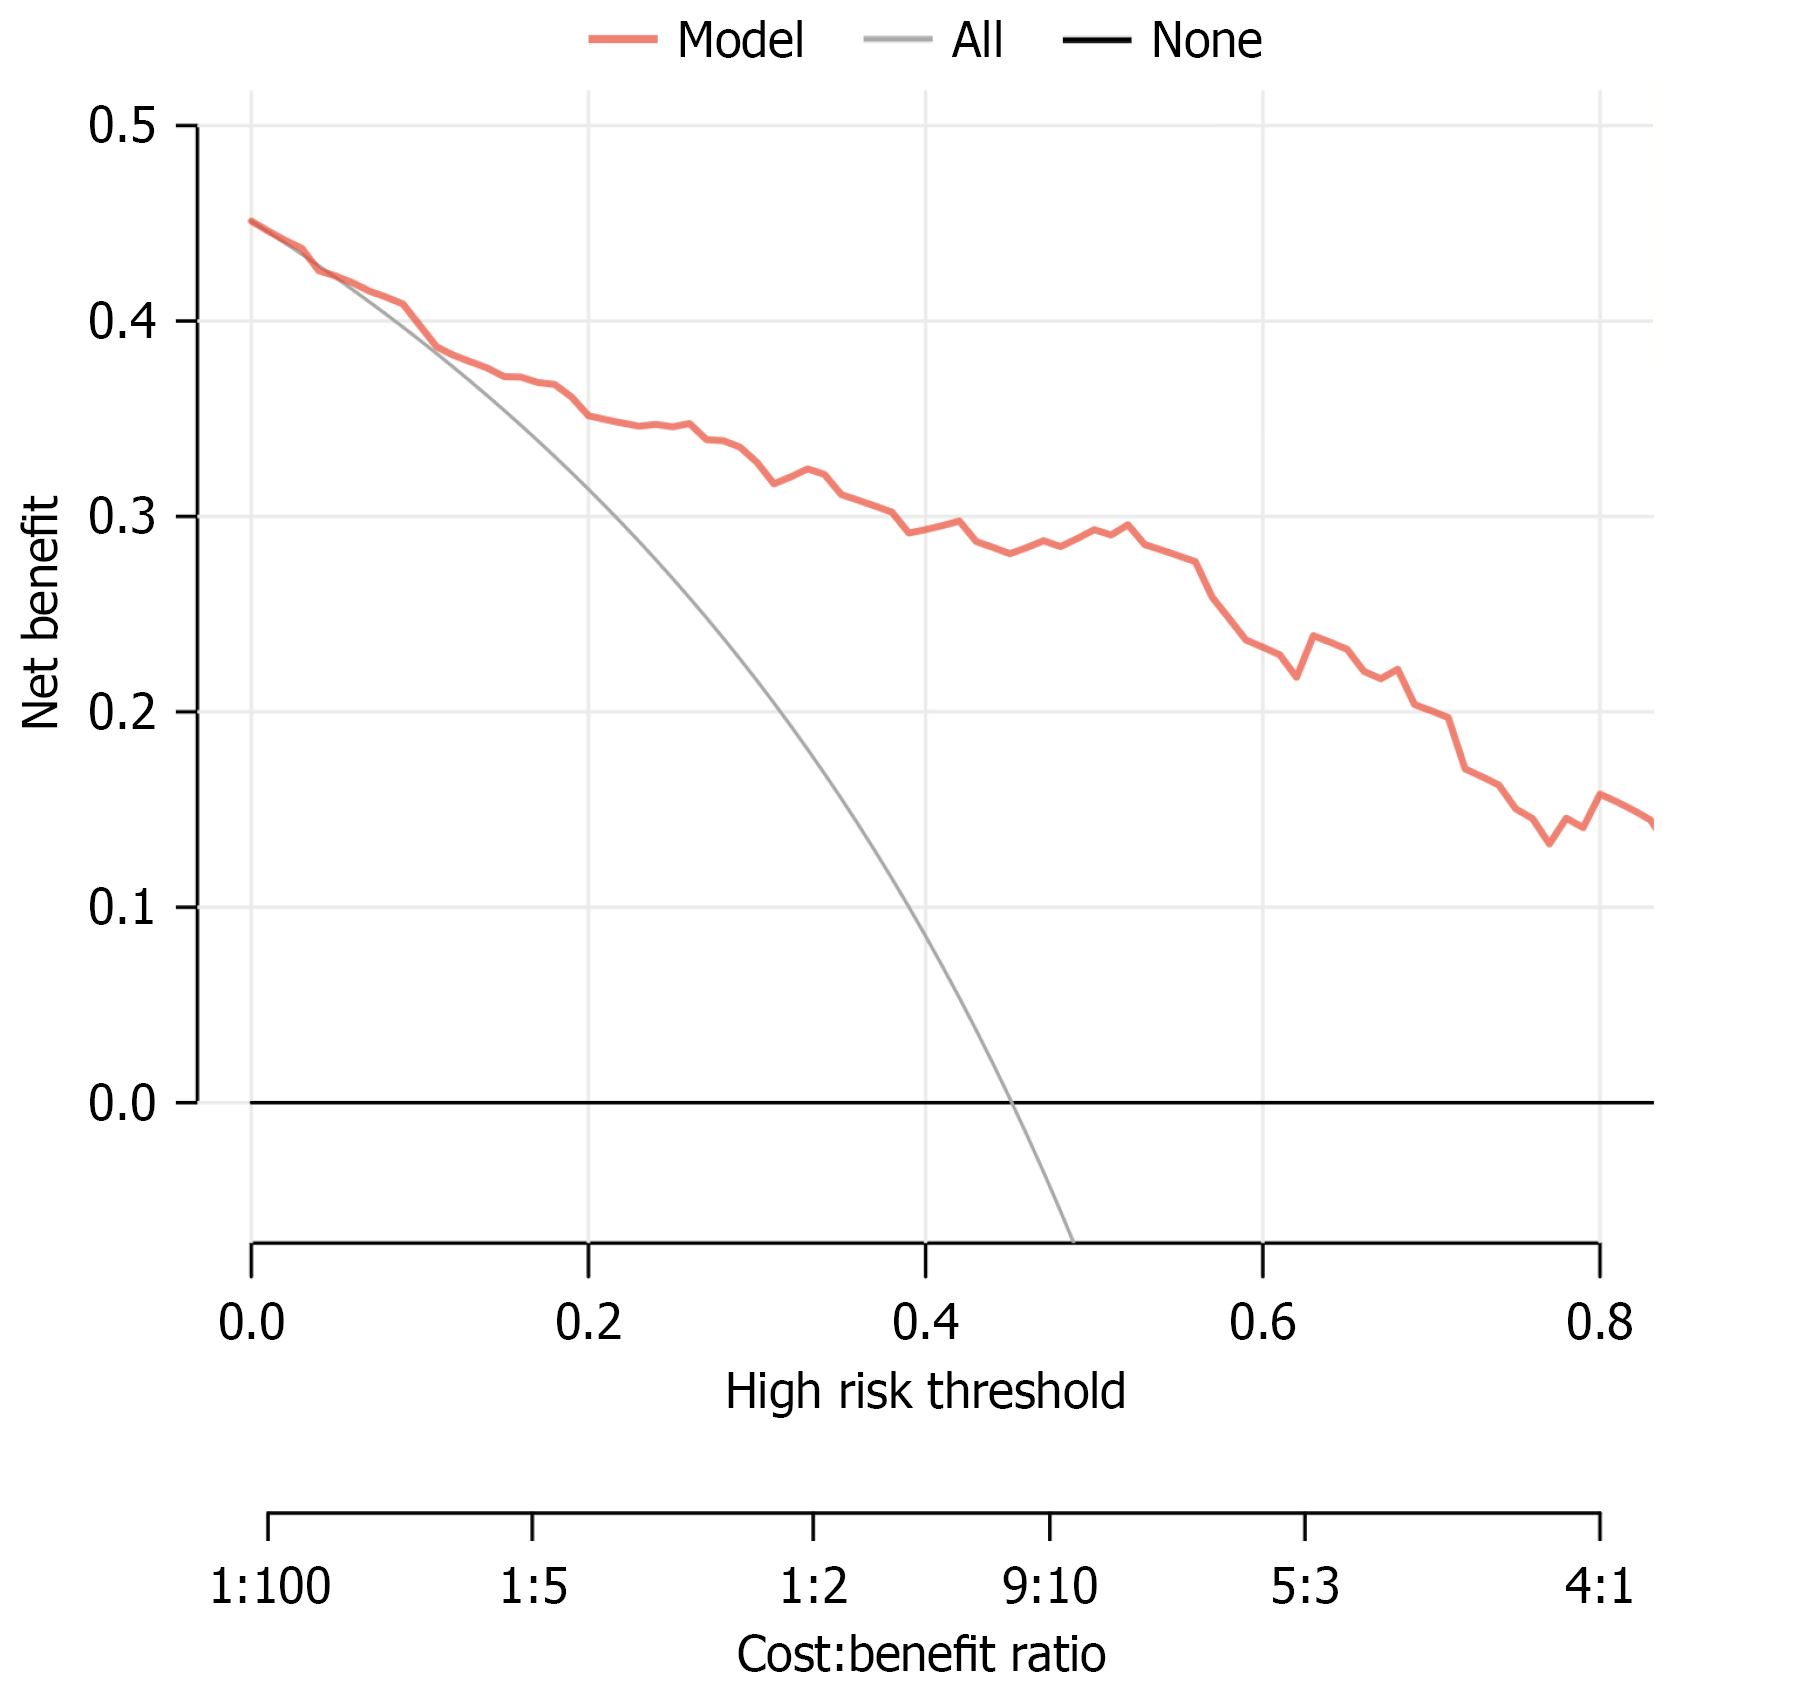
Figure 7 Decision curve analysis of nomogram prediction models.
The X-axis shows the threshold probability, and the Y-axis is the net benefit. The red line indicates that no patients progress to severity, and the black line indicates that all patients progress to severity.
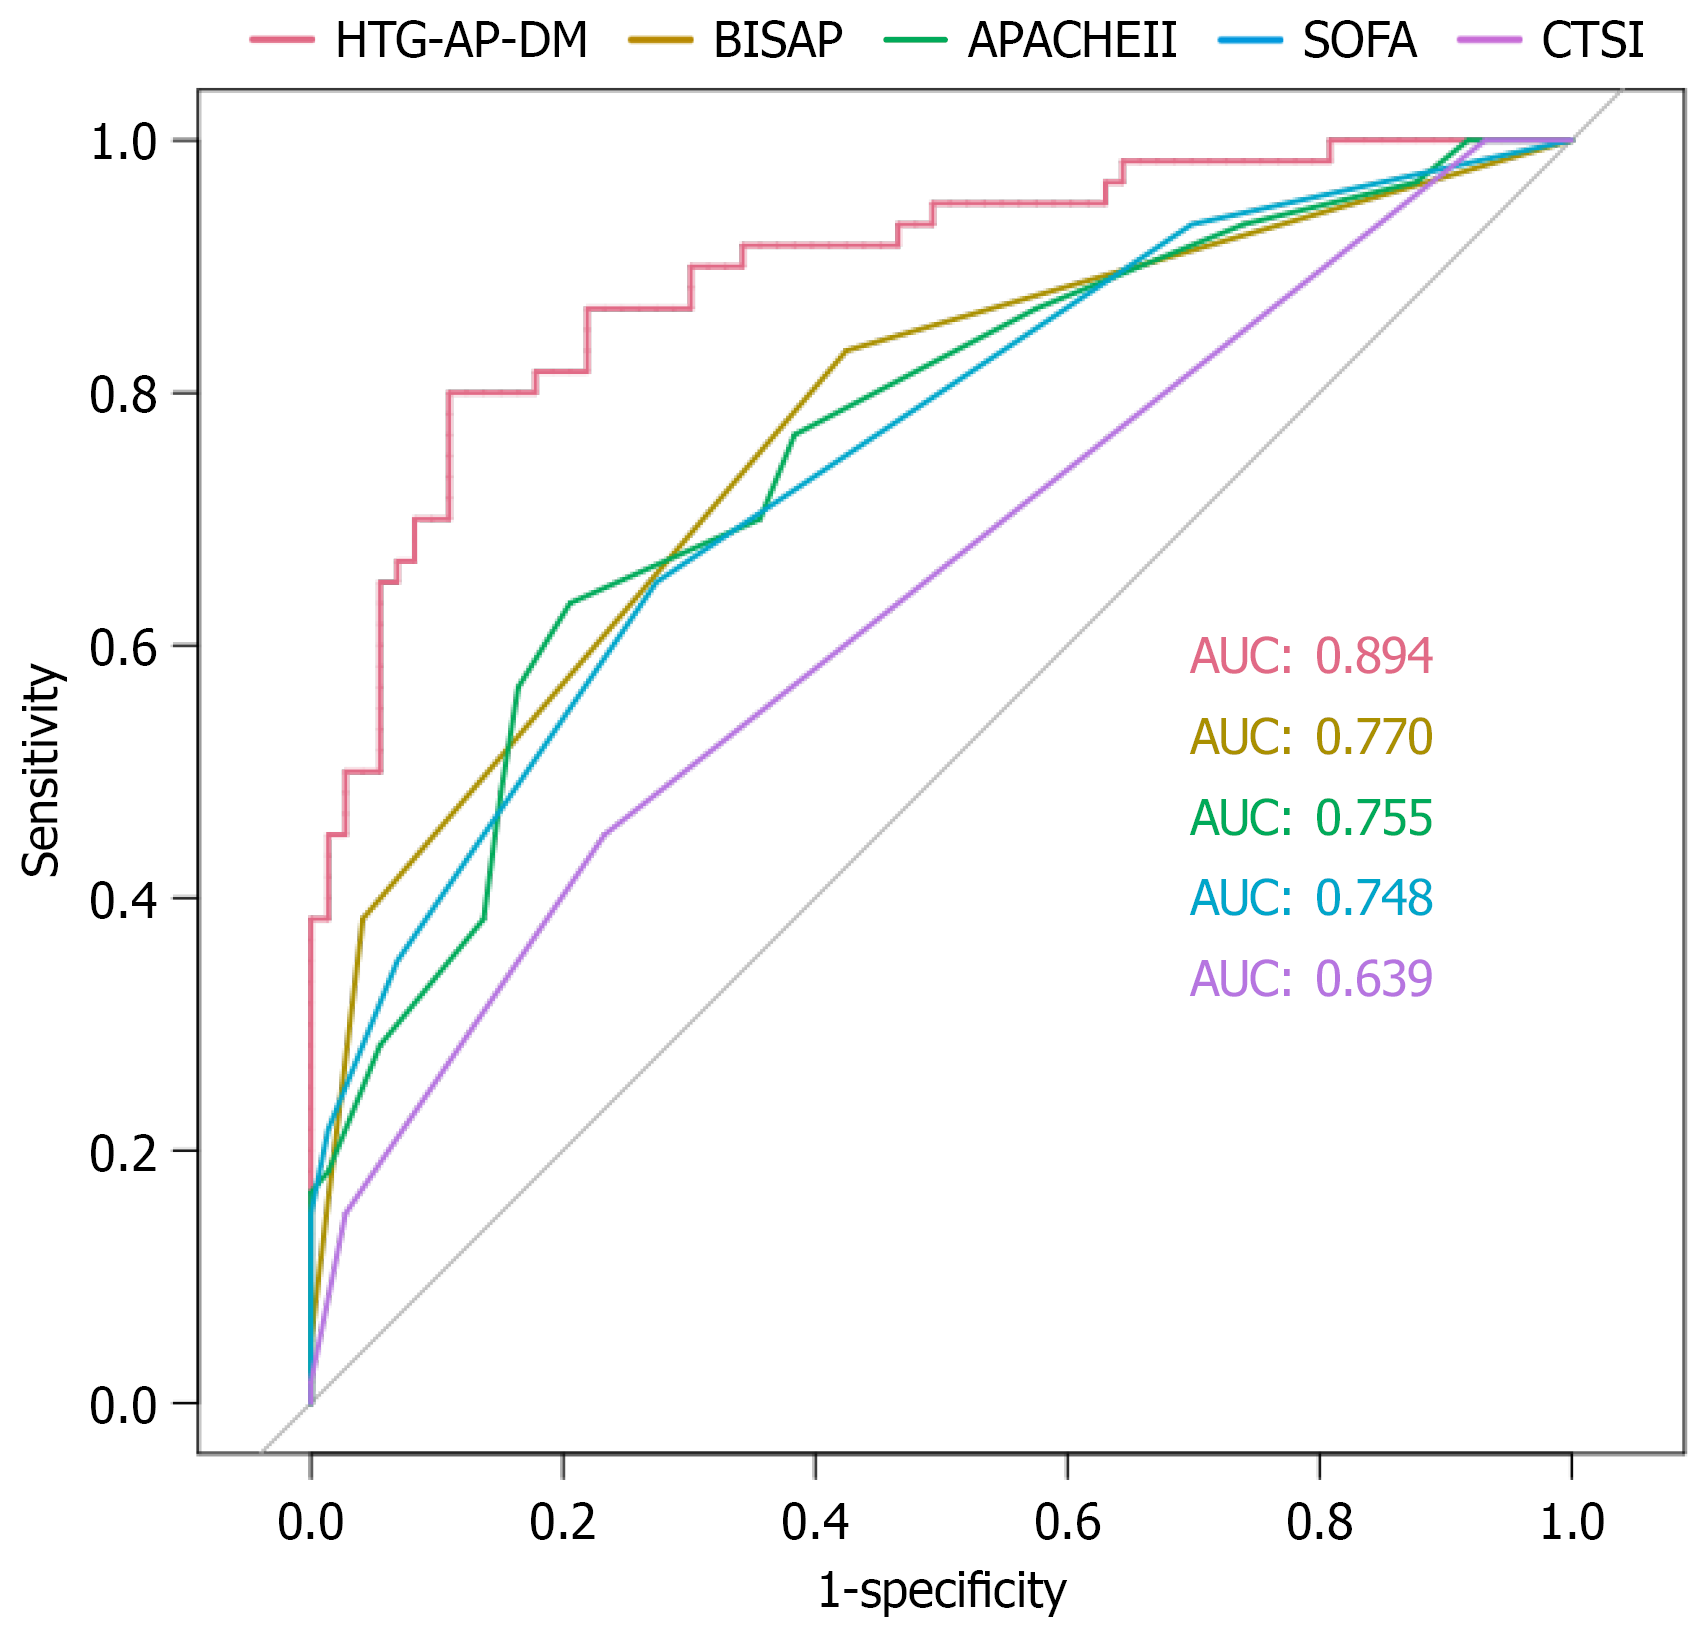
Figure 8 Receiver operating characteristic curves of the prediction model and commonly used clinical scoring systems.
The receiver operating characteristic curve demonstrates the discriminative efficacy of the predictive model developed in this study compared to existing scoring systems for predicting outcomes in hypertriglyceridemia-induced acute pancreatitis combined with diabetes mellitus patients. The area under the curve is used to evaluate the predictive value of each factor, with higher area under the curve values indicating greater predictive power. AUC: Area under curve; HTG-AP-DM: Hyper
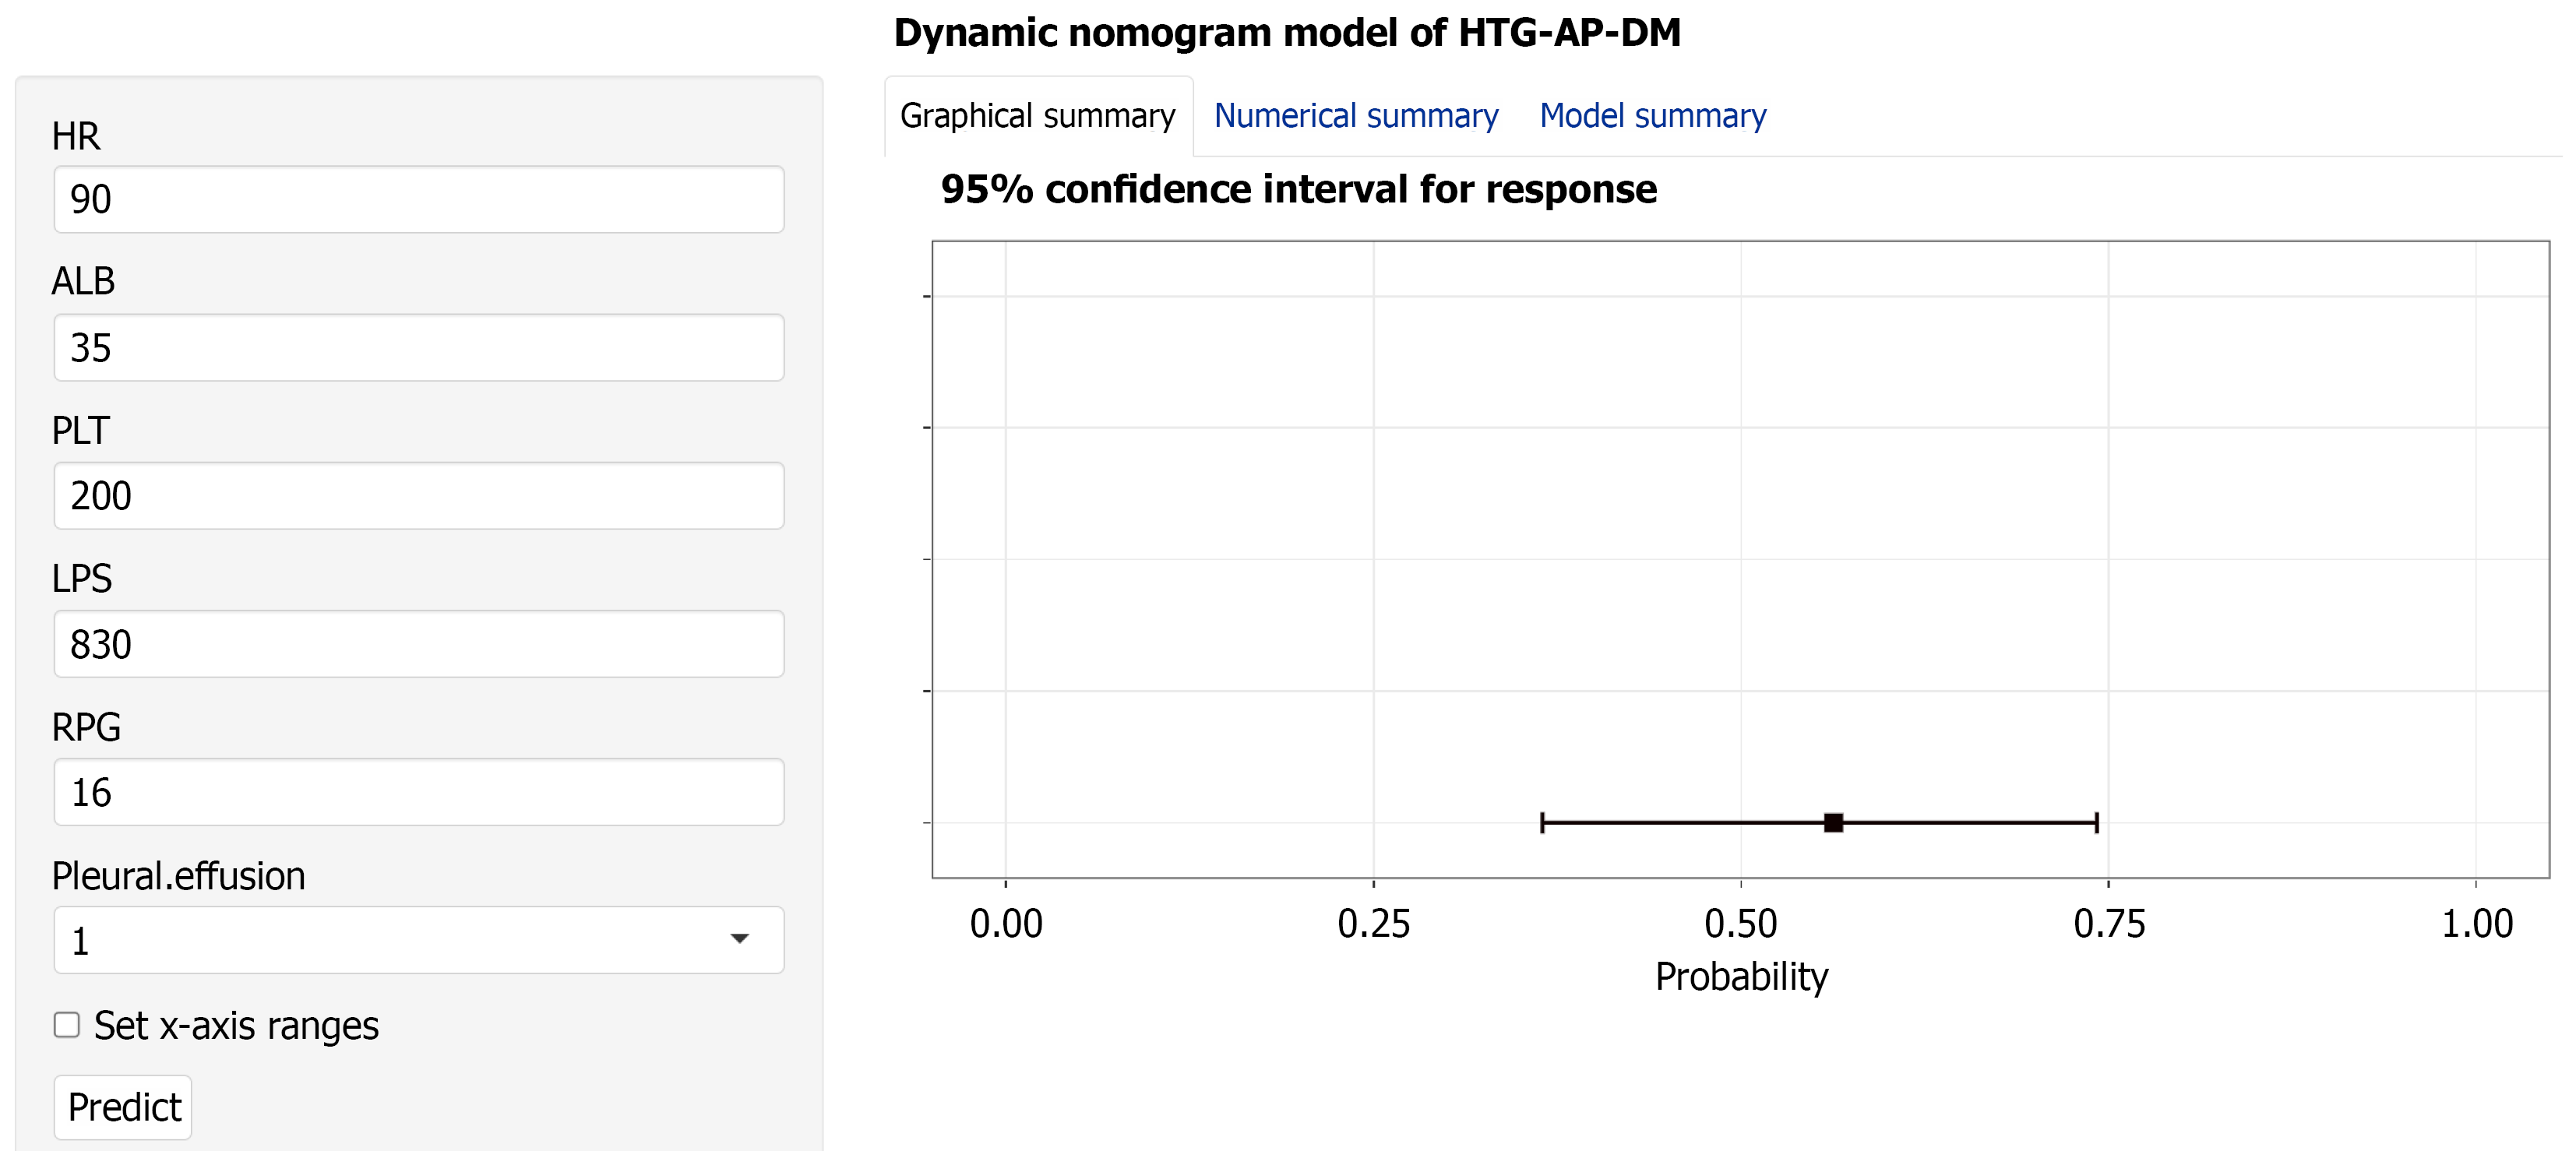
Figure 9 Online dynamic nomogram prediction tool.
HTG-AP-DM: Hypertriglyceridemia-induced acute pancreatitis combined with diabetes mellitus; HR: Heart rate; ALB: Albumin; PLT: Platelets; LPS: Serum lipase; RPG: Random plasma glucose.
- Citation: Chai M, Zhao LX, Wang ZG, Xu DH. Hypertriglyceridemic acute pancreatitis with diabetes mellitus: Investigation of factors and predictive models for severity progression. World J Diabetes 2026; 17(10): 124186
- URL: https://www.wjgnet.com/1948-9358/full/v17/i10/124186.htm
- DOI: https://dx.doi.org/10.4239/wjd.124186