Copyright
©The Author(s) 2025.
World J Diabetes. Sep 15, 2025; 16(9): 110639
Published online Sep 15, 2025. doi: 10.4239/wjd.v16.i9.110639
Published online Sep 15, 2025. doi: 10.4239/wjd.v16.i9.110639
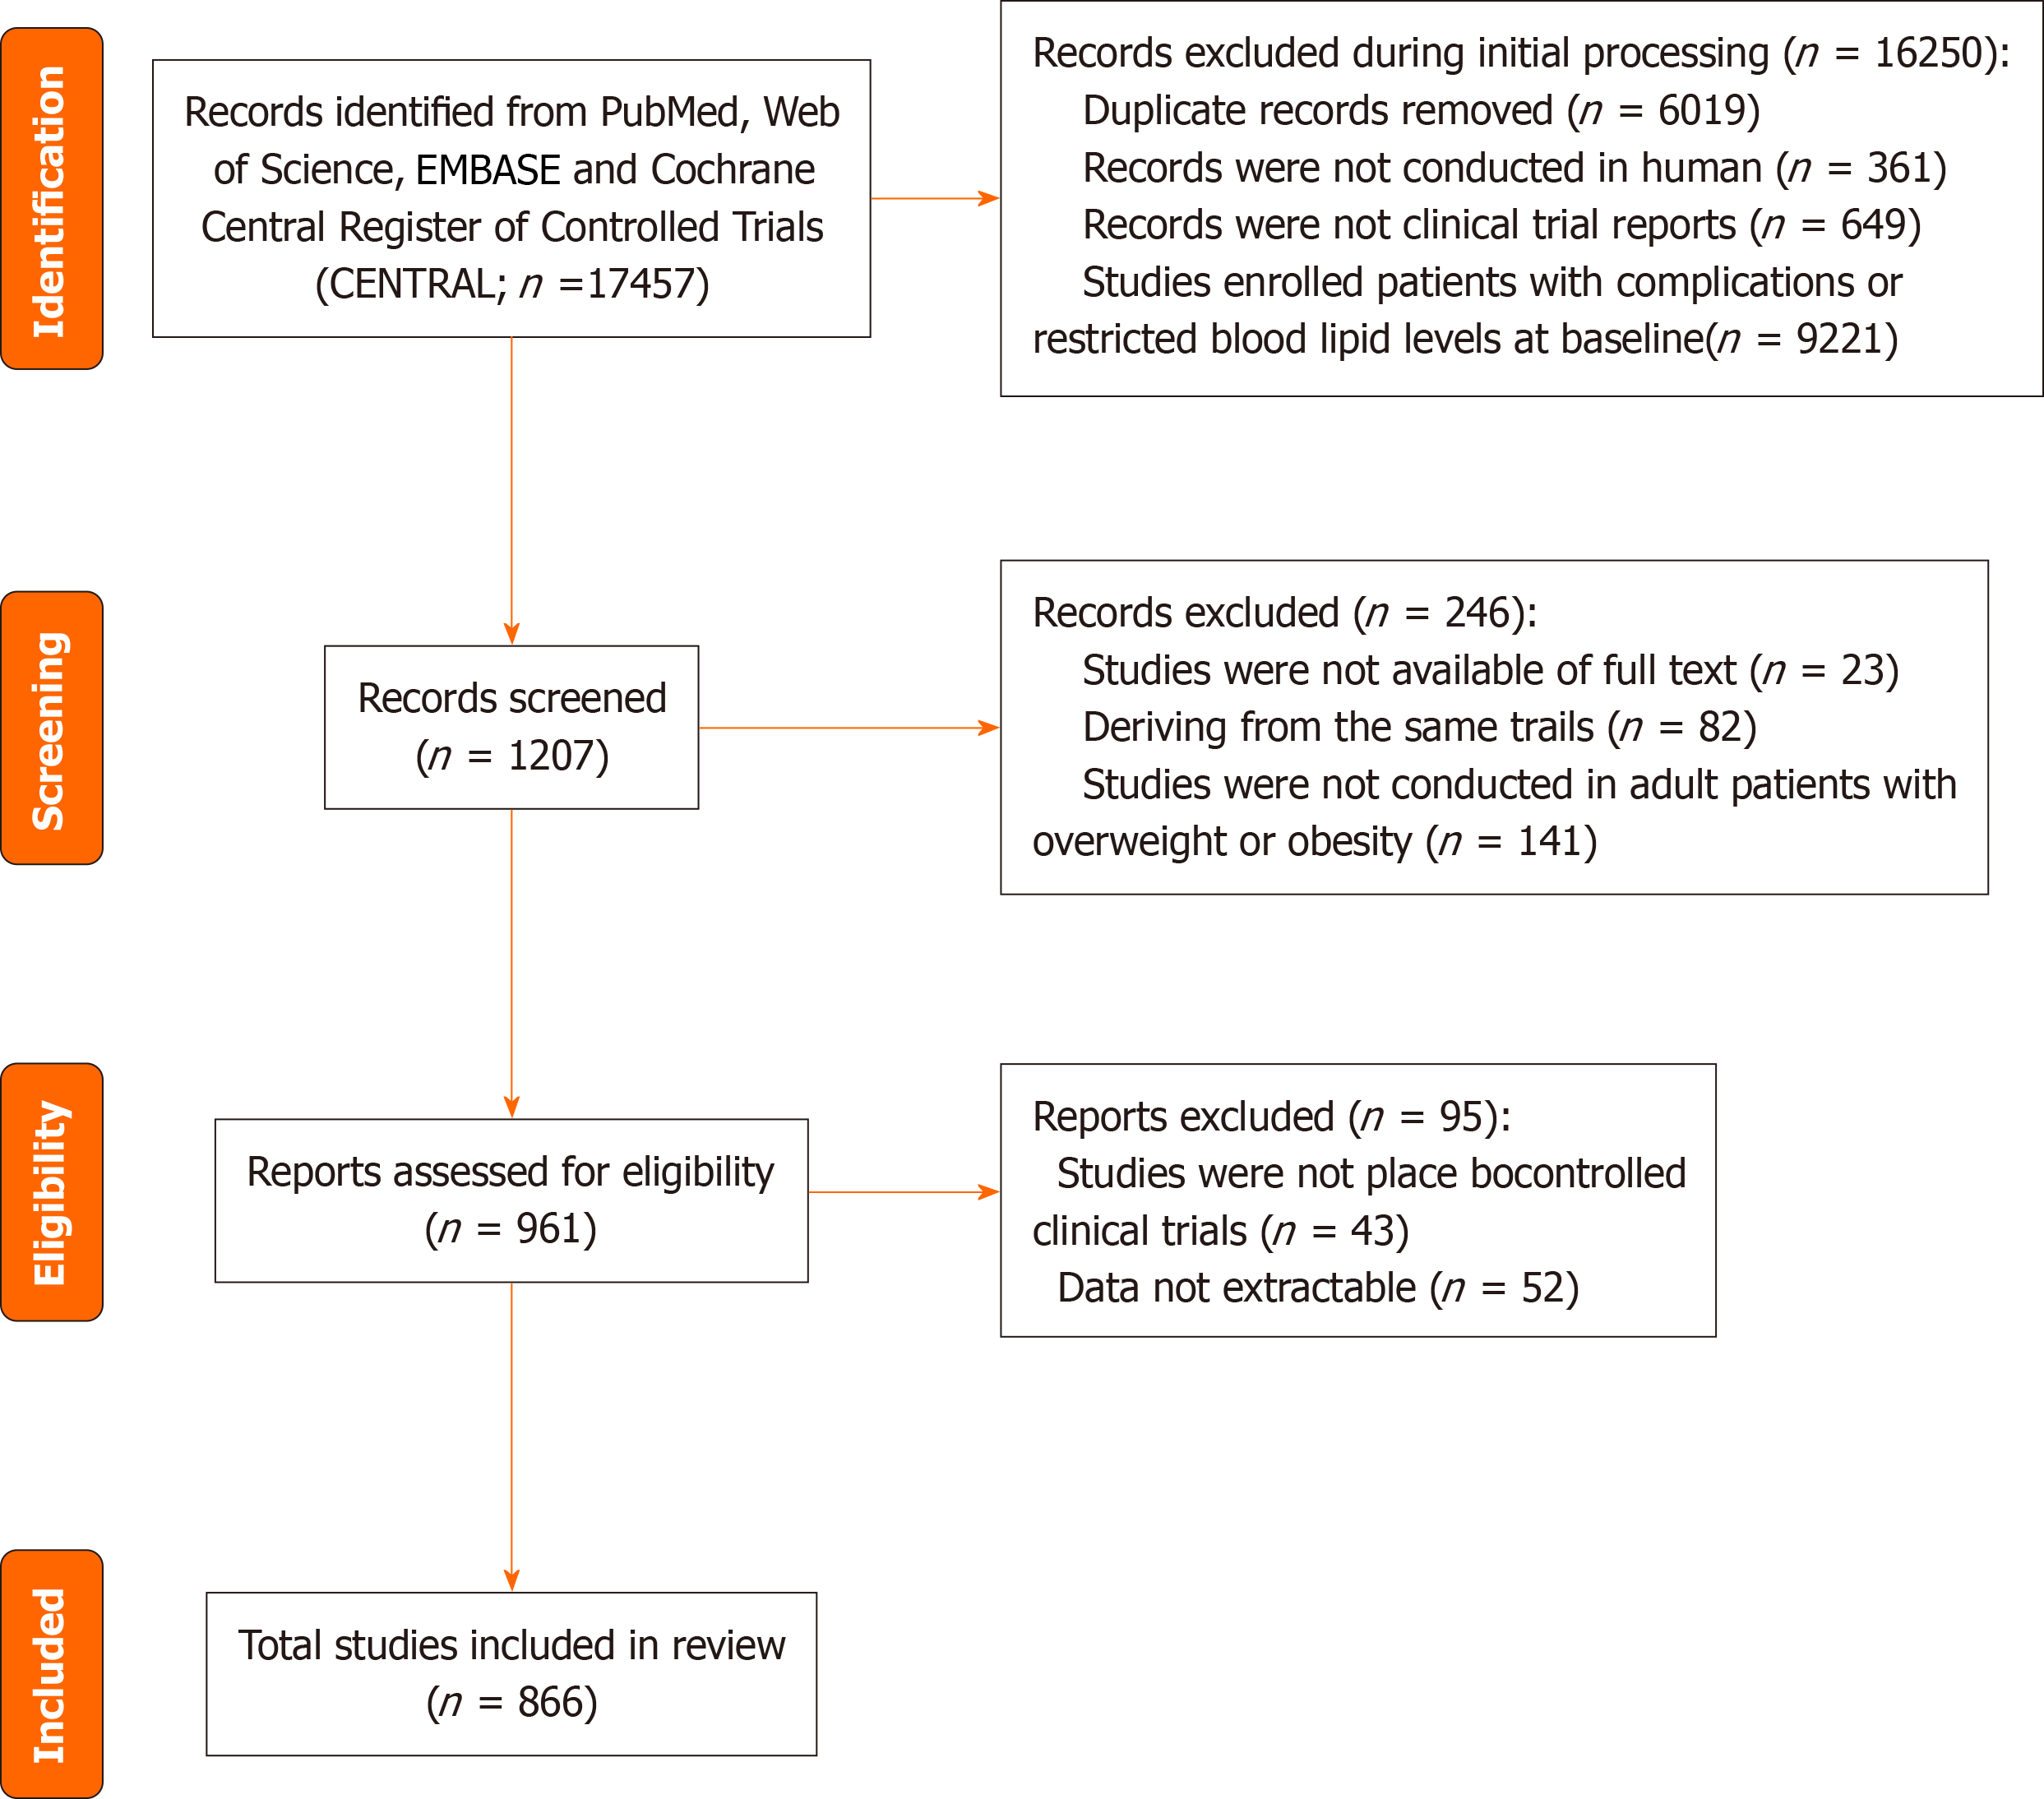
Figure 1 Flow diagram showing selection process.
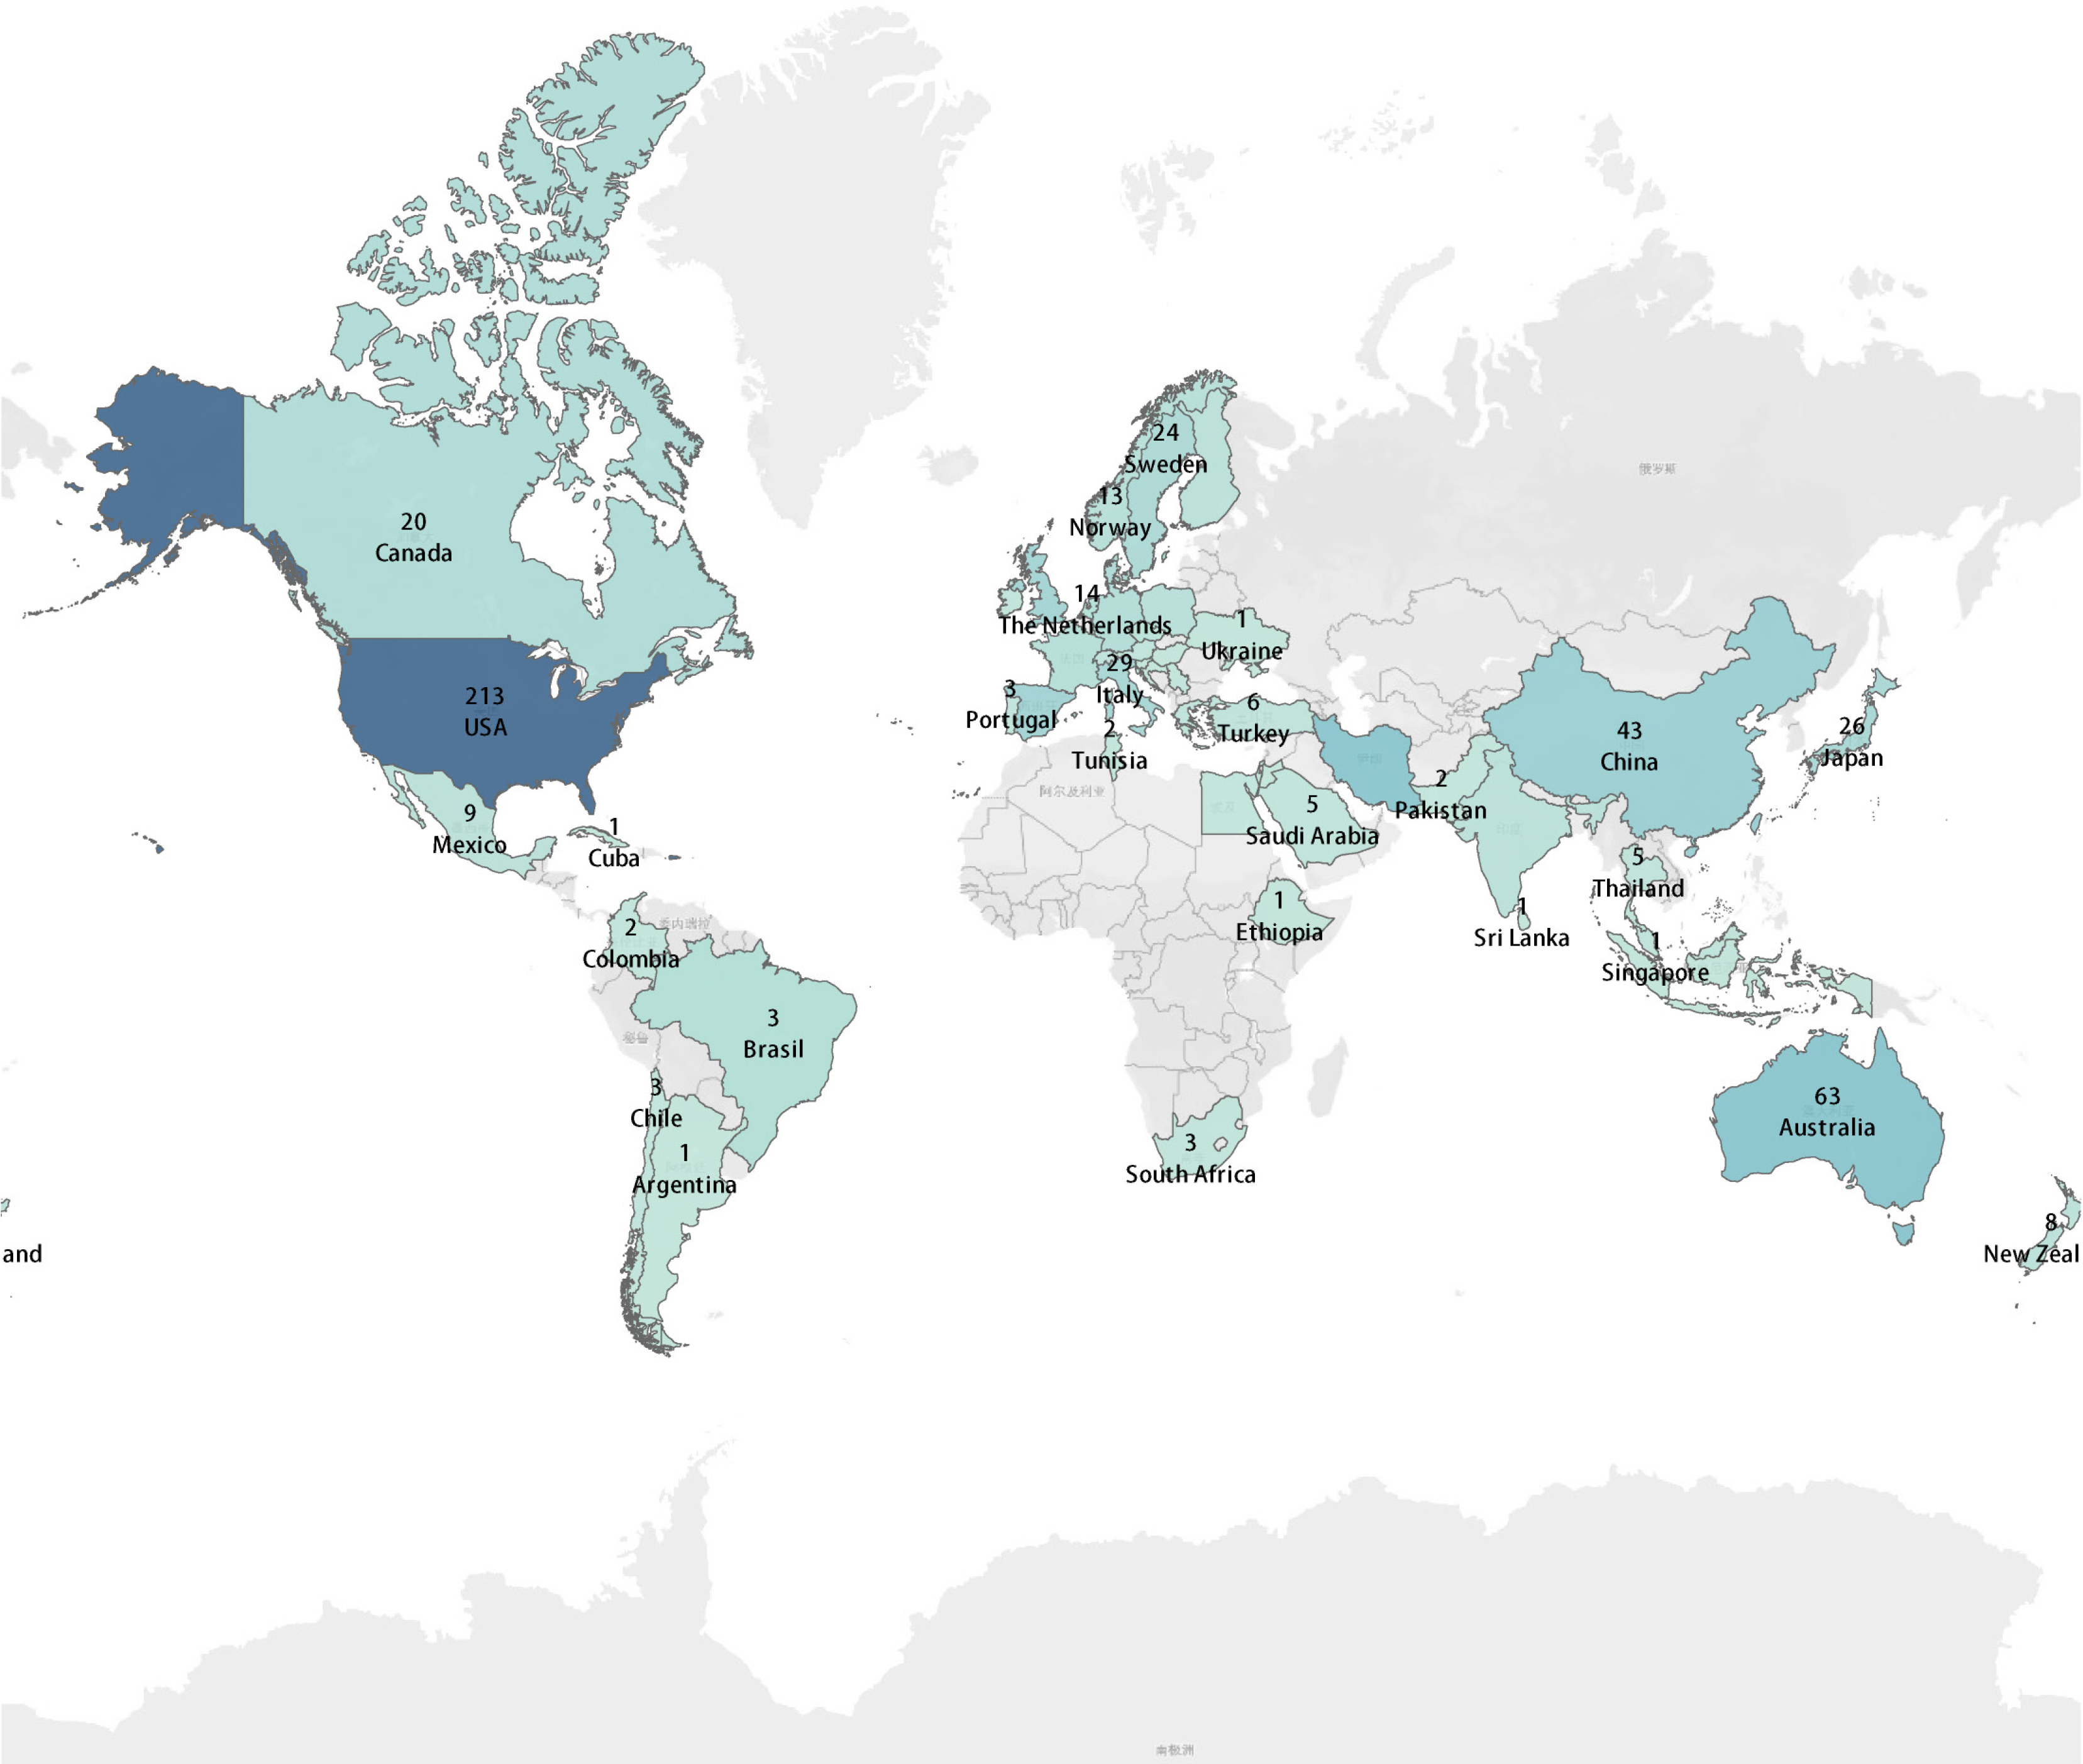
Figure 2 Global distribution by country/region of included trial.
Figure 3 Trends of baseline blood lipid among patients with overweight or obesity in randomized placebo-controlled trials from 1990 to 2024.
A-D: Trends of triglycerides (A), total cholesterol (B), high-density lipoprotein cholesterol (C), and low-density lipoprotein cholesterol (D). TG: Triglycerides; TC: Total cholesterol; HDL-C: High-density lipoprotein cholesterol; LDL-C: Low-density lipoprotein cholesterol.
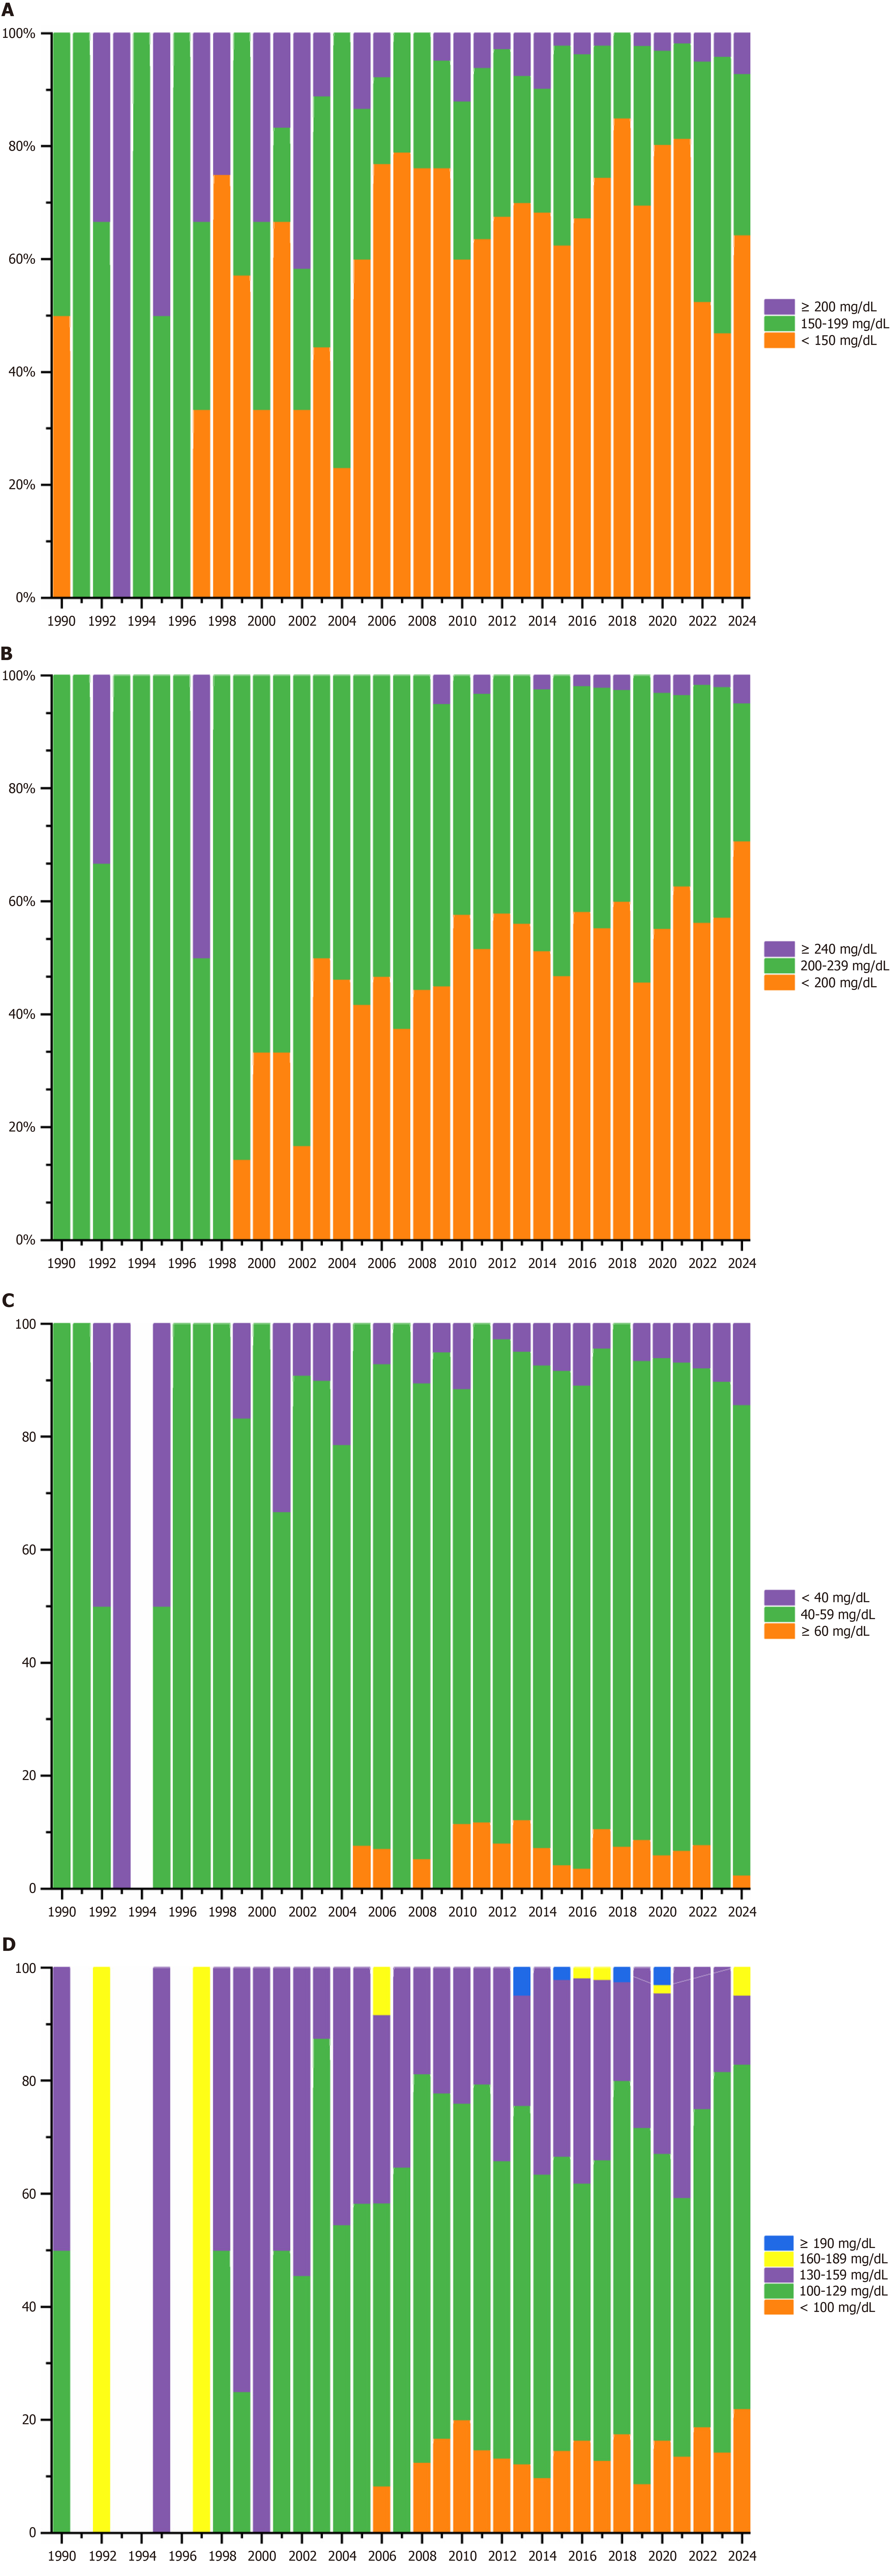
Figure 4 Trial proportion of different baseline triglycerides, total cholesterol, high-density lipoprotein cholesterol, and low-density lipoprotein cholesterol categories for patients with overweight or obesity in randomized placebo-controlled trials from 1990 to 2024.
A-D: Trial proportions of different baseline triglycerides (A), total cholesterol (B), high-density lipoprotein cholesterol (C), and low-density lipoprotein cholesterol (D) categories.
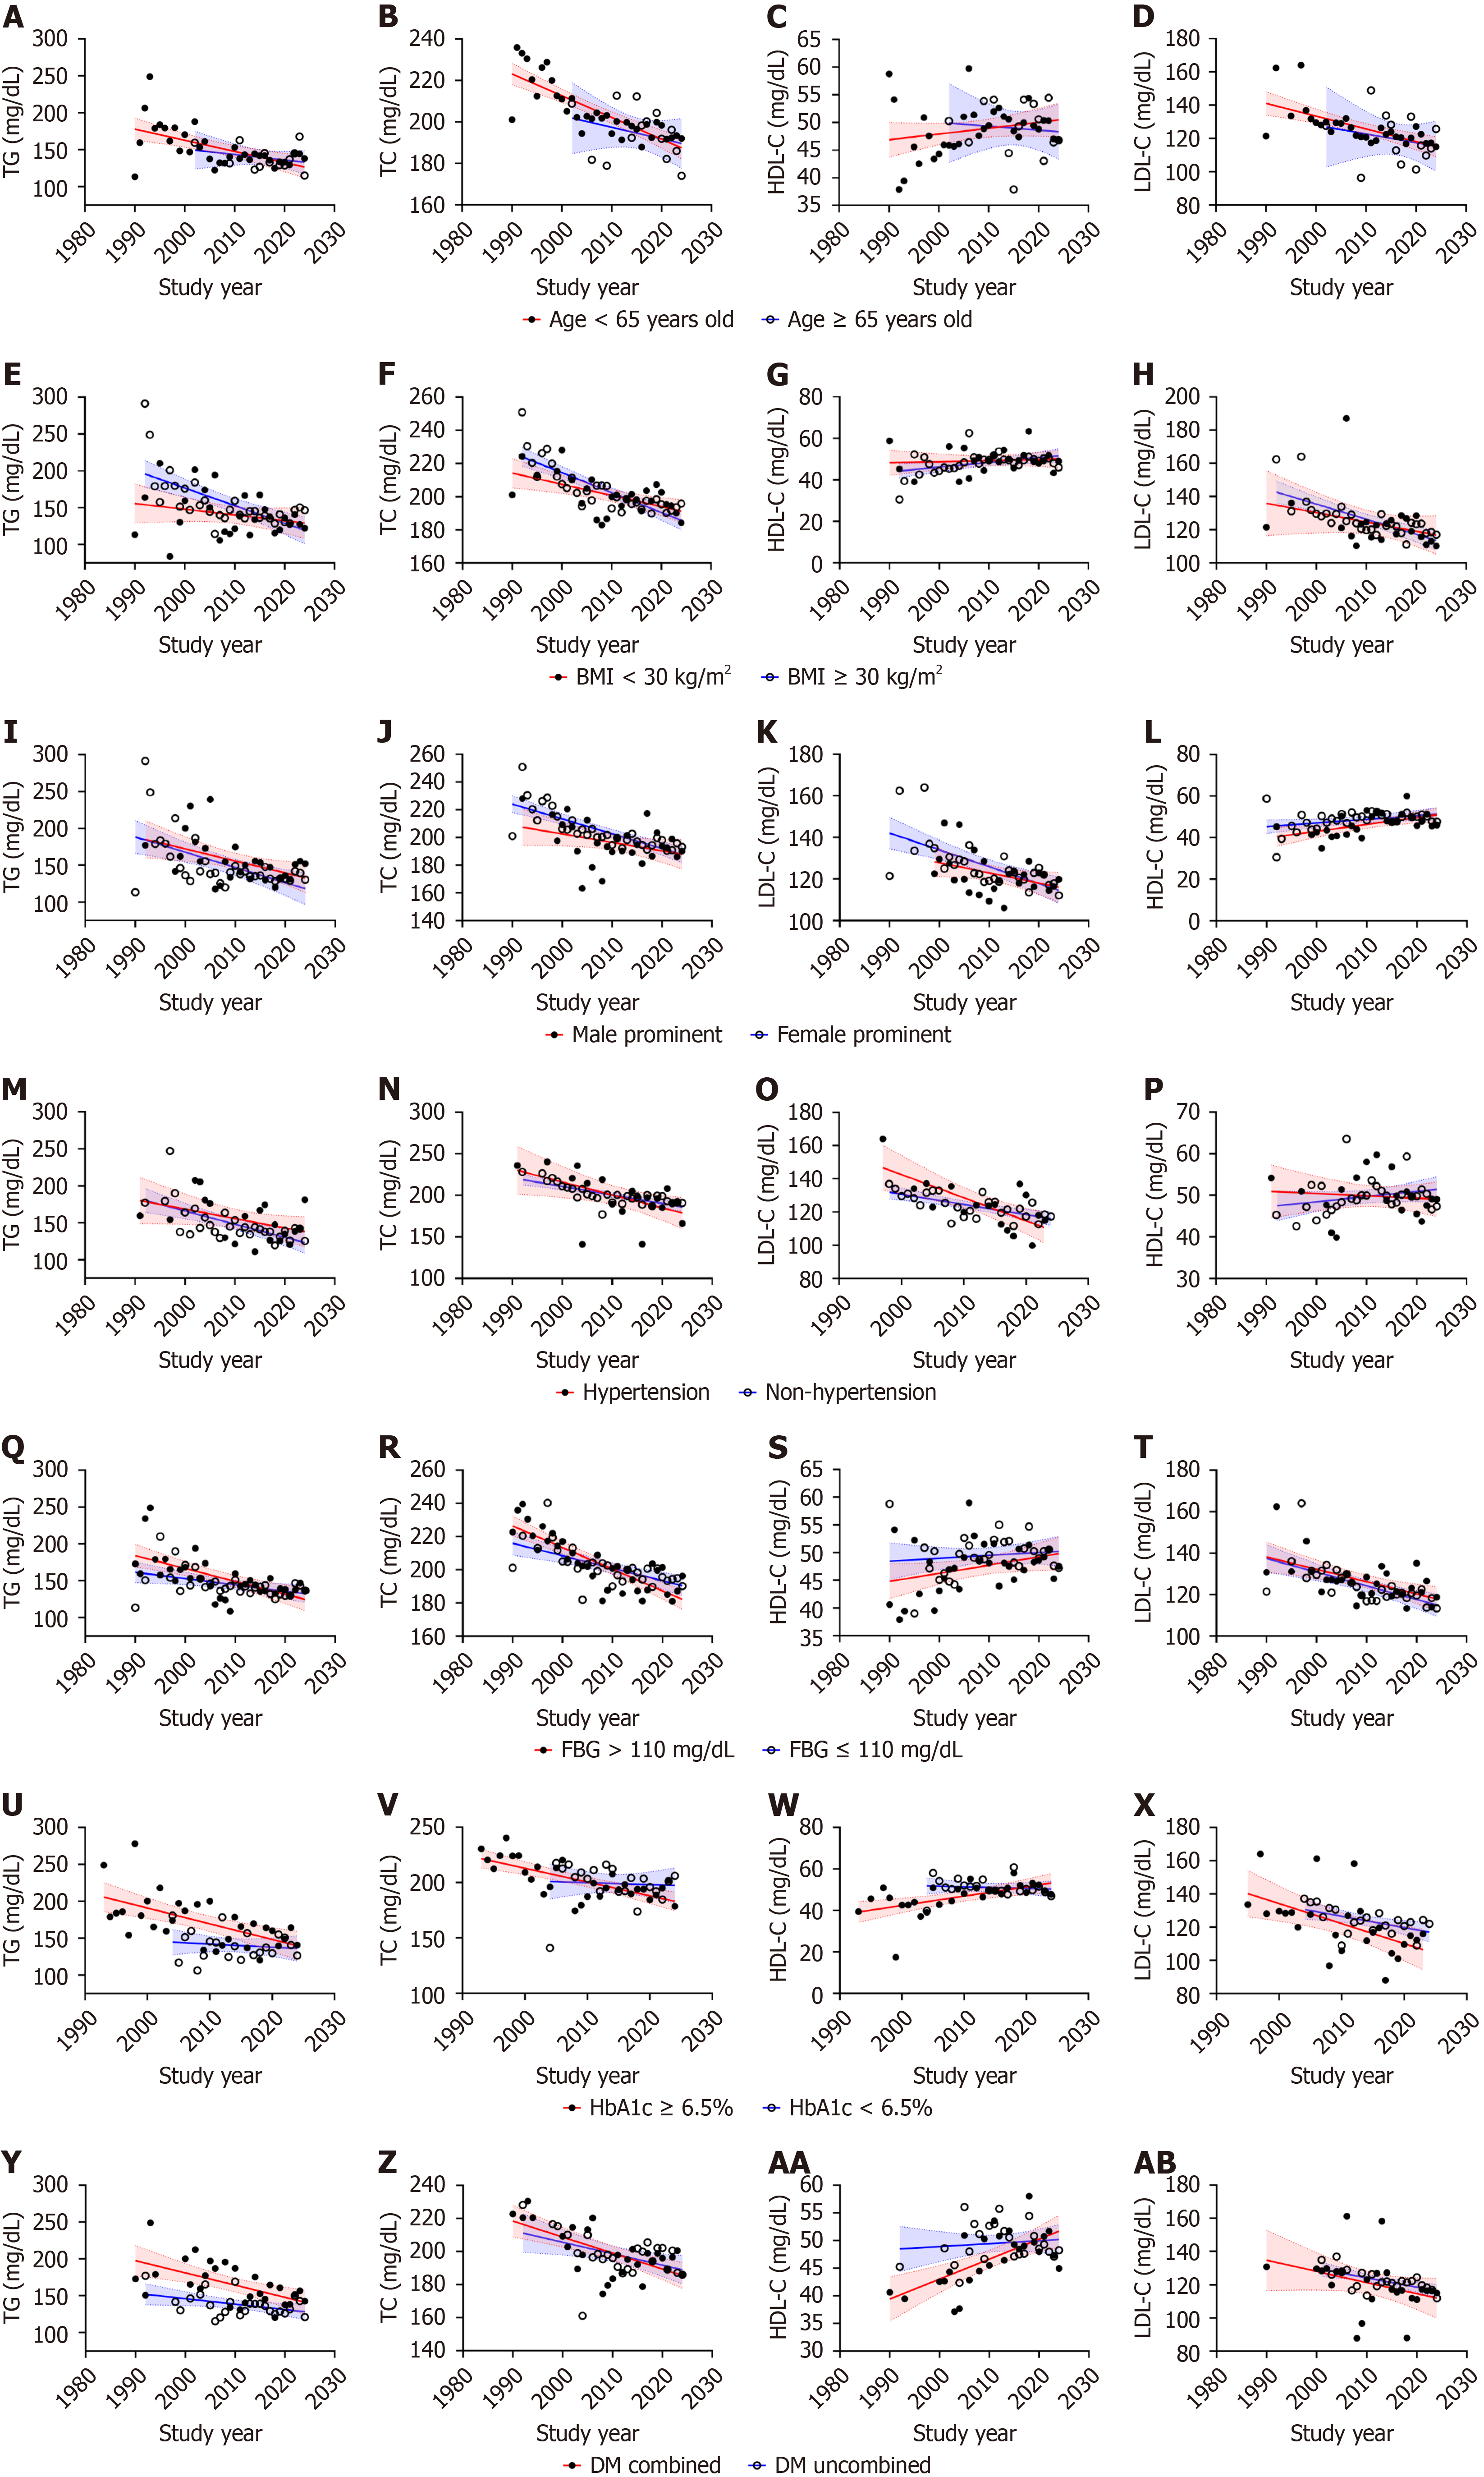
Figure 5 Trends in baseline triglycerides, total cholesterol, high-density lipoprotein cholesterol, and low-density lipoprotein cholesterol categorized by participants’ characteristics.
A-D: Baseline triglycerides (TG; A), total cholesterol (TC; B), high-density lipoprotein cholesterol (HDL-C; C), and low-density lipoprotein cholesterol (LDL-C; D) trends categorized by age < 65 years and ≥ 65 years; E-H: Baseline TG (E), TC (F), HDL-C (G), and LDL-C (H) trends categorized by body mass index < 30 kg/m2 and ≥ 30 kg/m2; I-L: Baseline TG (I), TC (J), LDL-C (K), HDL-C (L) and trends categorized by male prominent and female prominent; M-P: Baseline TG (M), TC (N), LDL-C (O), and HDL-C (P) trends categorized by hypertension and non-hypertension; Q-T: Baseline TG (Q), TC (R), HDL-C (S), and LDL-C (T) trends categorized by fasting blood glucose (FBG) > 110 mg/dL and FBG ≤ 110 mg/dL; U-X: Baseline TG (U), TC (V), HDL-C (W), and LDL-C (X) trends categorized by HbA1c ≥ 6.5% and HbA1c < 6.5%; Y-AB: Baseline TG (Y), TC (Z), HDL-C (AA), and LDL-C (AB) trends categorized by DM combined and uncombined. TG: Triglycerides; TC: Total cholesterol; HDL-C: High-density lipoprotein cholesterol; LDL-C: Low-density lipoprotein cholesterol; DM: Diabetes mellites; BMI: Body mass index; FBG: Fasting blood glucose, HbA1c: Glycated hemoglobin A1c.
Figure 6 Trends in baseline triglycerides, total cholesterol, high-density lipoprotein cholesterol, and low-density lipoprotein cholesterol categorized by monotherapy and combination therapy.
A-D: Baseline triglycerides (A), total cholesterol (B), high-density lipoprotein cholesterol (C), and low-density lipoprotein cholesterol (D) trends categorized by monotherapy and combination therapy. TG: Triglycerides; TC: Total cholesterol; HDL-C: High-density lipoprotein cholesterol; LDL-C: Low-density lipoprotein cholesterol.
- Citation: Wang YQ, Xiao QZ, Zhang ZM, Yang Y. Trends in baseline blood lipid levels in randomized placebo-controlled trials of overweight or obesity from 1990 to 2024. World J Diabetes 2025; 16(9): 110639
- URL: https://www.wjgnet.com/1948-9358/full/v16/i9/110639.htm
- DOI: https://dx.doi.org/10.4239/wjd.v16.i9.110639


