Copyright
©The Author(s) 2025.
World J Diabetes. Sep 15, 2025; 16(9): 109414
Published online Sep 15, 2025. doi: 10.4239/wjd.v16.i9.109414
Published online Sep 15, 2025. doi: 10.4239/wjd.v16.i9.109414
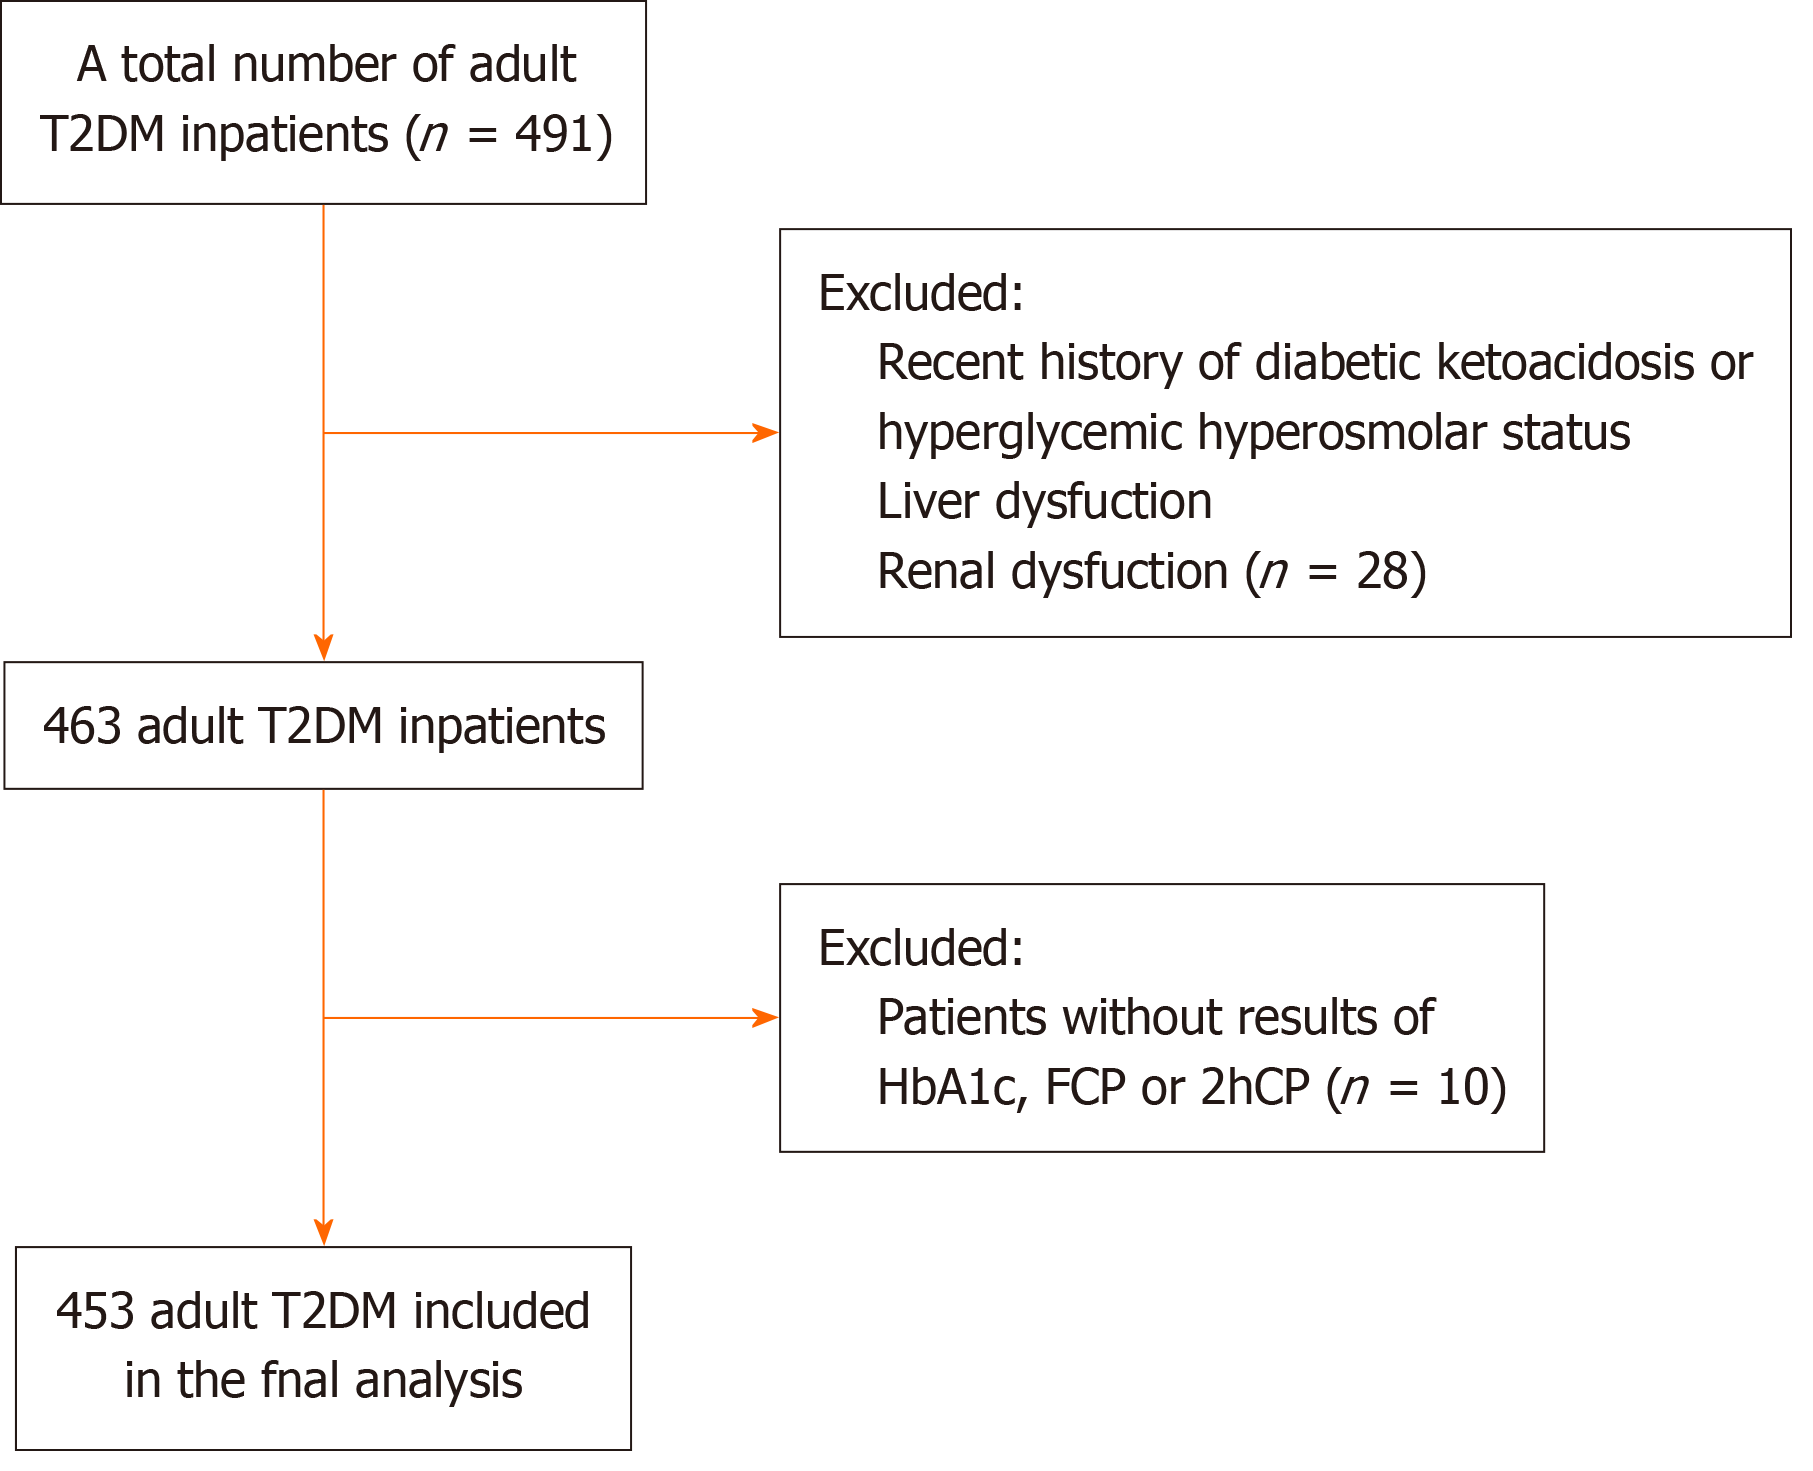
Figure 1 Flowchart of patient inclusion and exclusion criteria.
FCP: Fasting C-peptide; T2DM: Type 2 diabetes mellitus; 2hCP: 2 hours postprandial C-peptide.
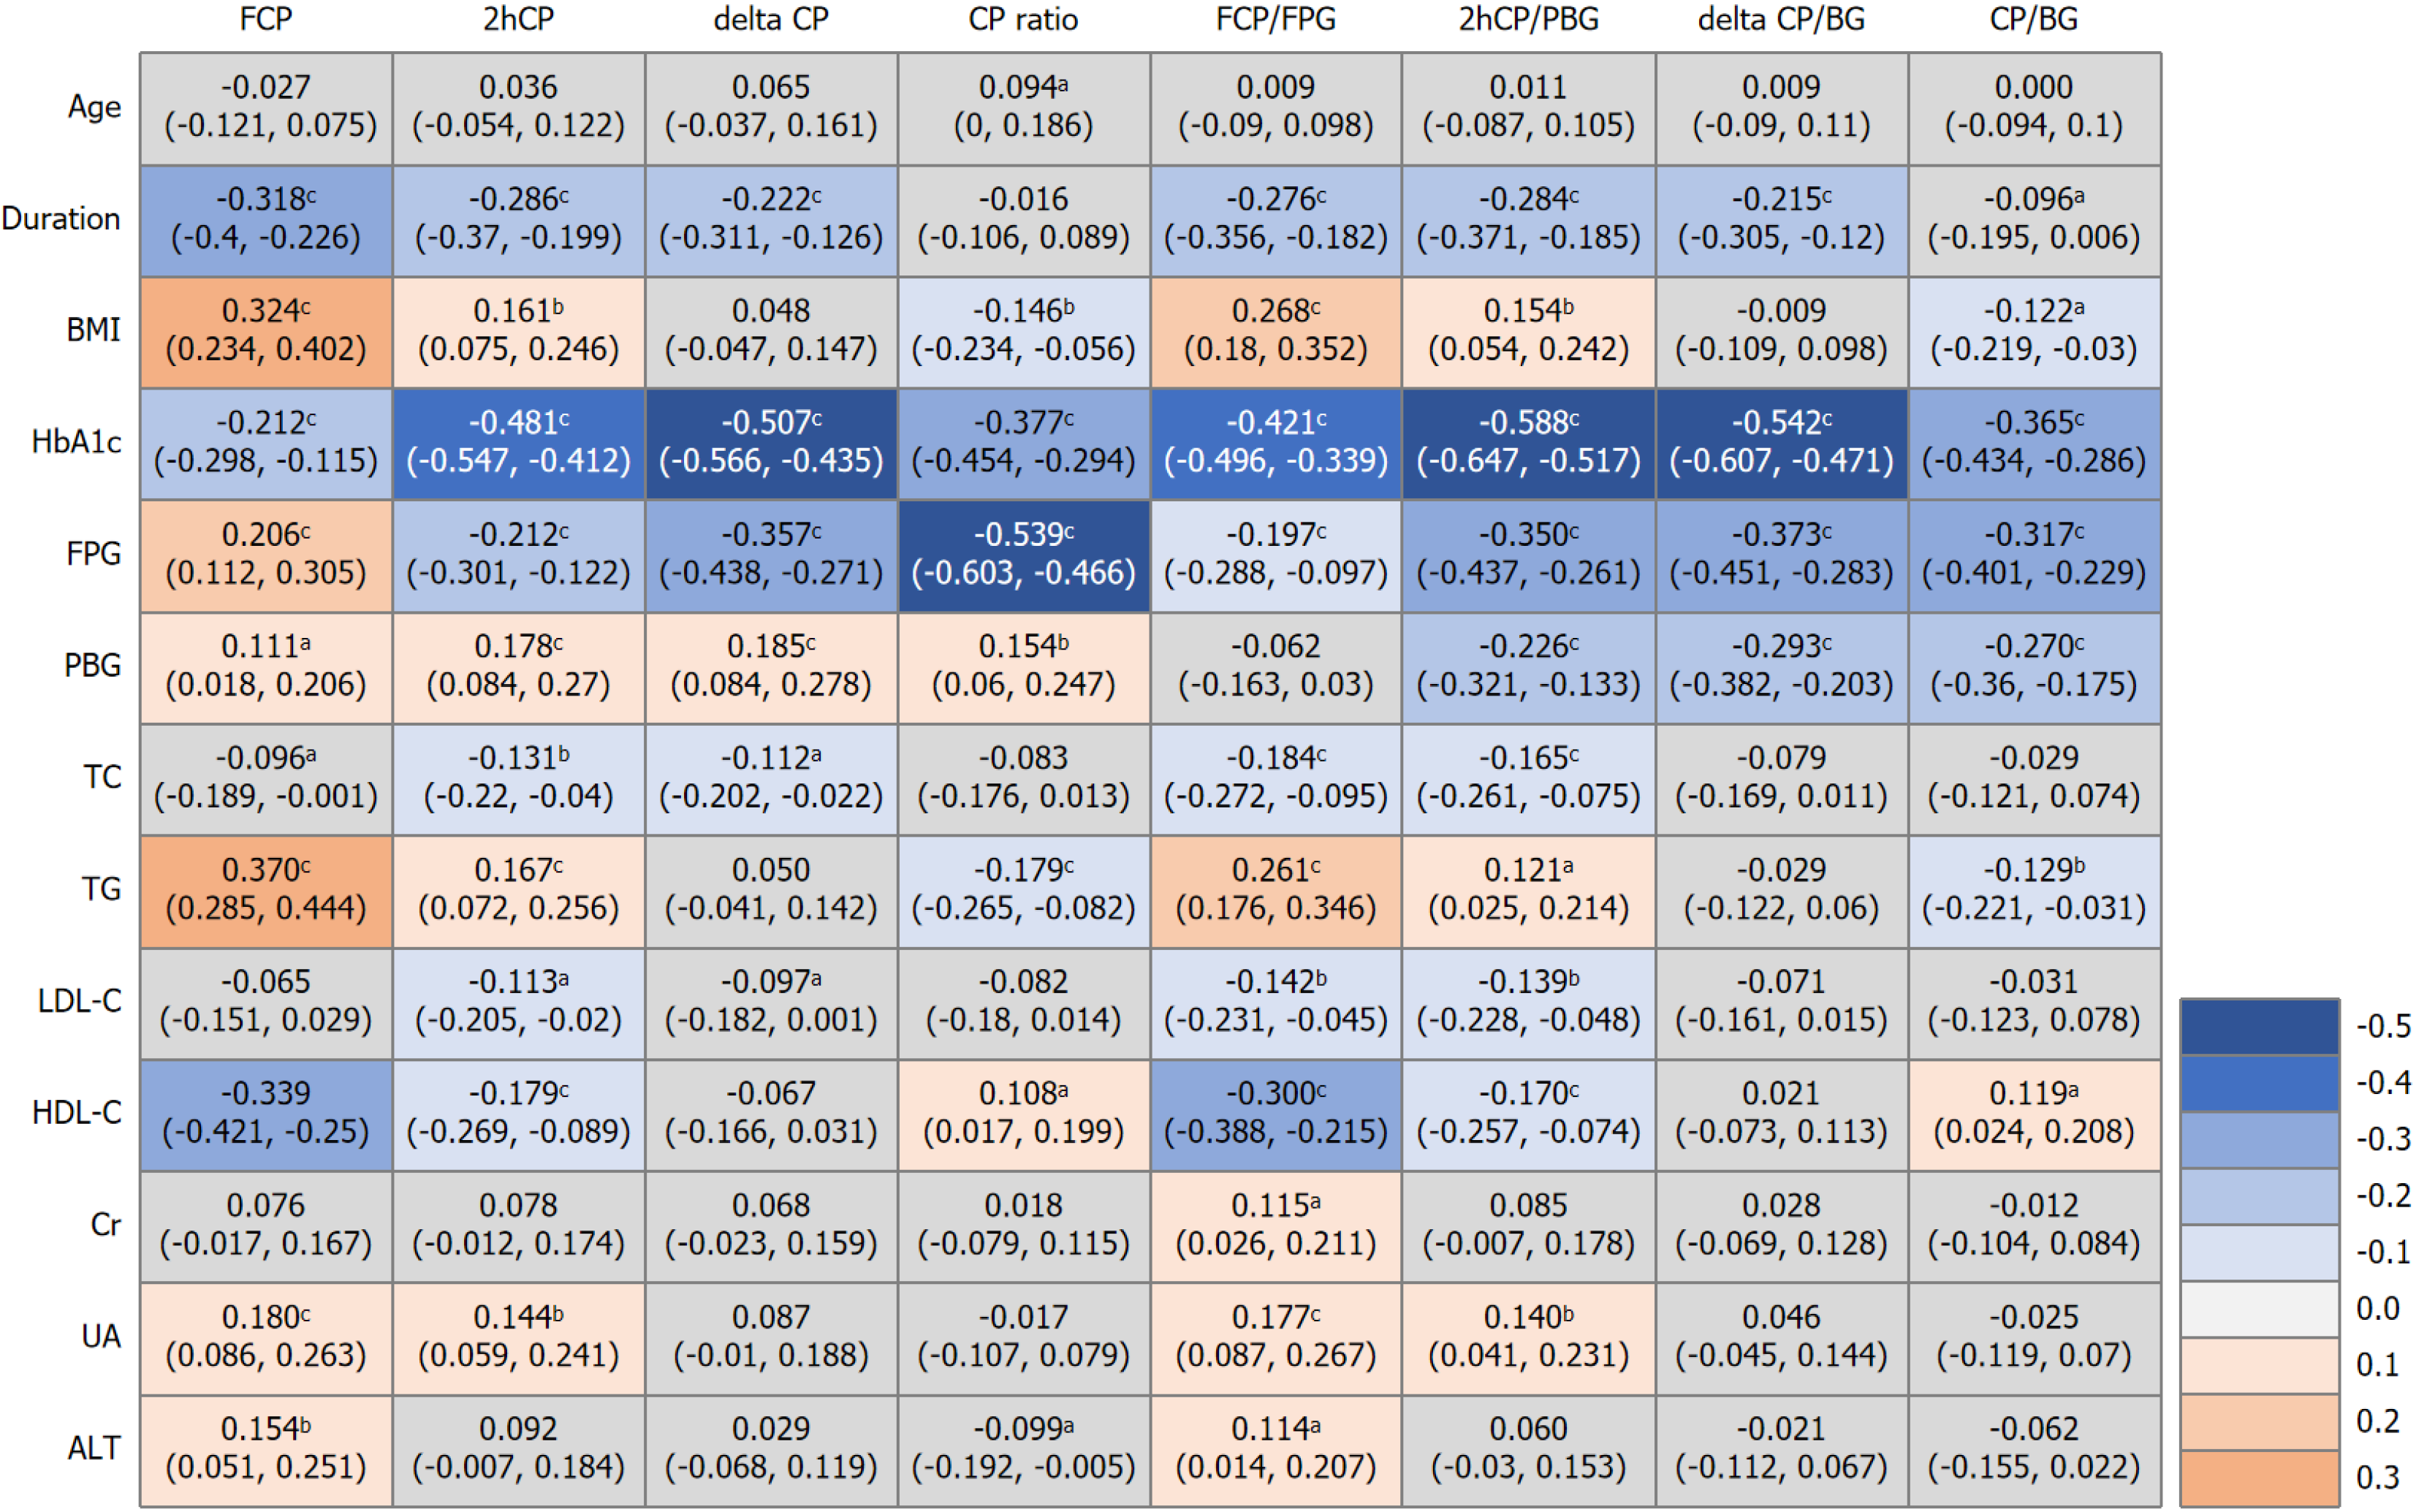
Figure 2 Spearman correlation of C-peptide related indices and clinical variables.
Numbers in the box represent correlation coefficients (r) and their 95%CIs of each two variables. aP < 0.05; bP < 0.01; cP < 0.001. ALT: Alanine transaminase; BG: Blood glucose; BMI: Body mass index; CP: C-peptide; Cr: Creatinine; FCP: Fasting C-peptide; FPG: Fasting plasma glucose; HbA1c: Hemoglobin A1c; HDL-C: High-density lipoprotein cholesterol; LDL-C: Low-density lipoprotein cholesterol; PBG: Postprandial blood glucose; TC: Total cholesterol; TG: Triglyceride; UA: Uric acid; 2hCP: 2 hours postprandial C-peptide.
- Citation: Wang Z, Deng MQ, Guo LX, Pan Q. Postprandial C-peptide is more relevant to hemoglobin A1c levels and diabetic microvascular complications than fasting C-peptide in type 2 diabetes. World J Diabetes 2025; 16(9): 109414
- URL: https://www.wjgnet.com/1948-9358/full/v16/i9/109414.htm
- DOI: https://dx.doi.org/10.4239/wjd.v16.i9.109414


