Copyright
©The Author(s) 2025.
World J Diabetes. Sep 15, 2025; 16(9): 104290
Published online Sep 15, 2025. doi: 10.4239/wjd.v16.i9.104290
Published online Sep 15, 2025. doi: 10.4239/wjd.v16.i9.104290
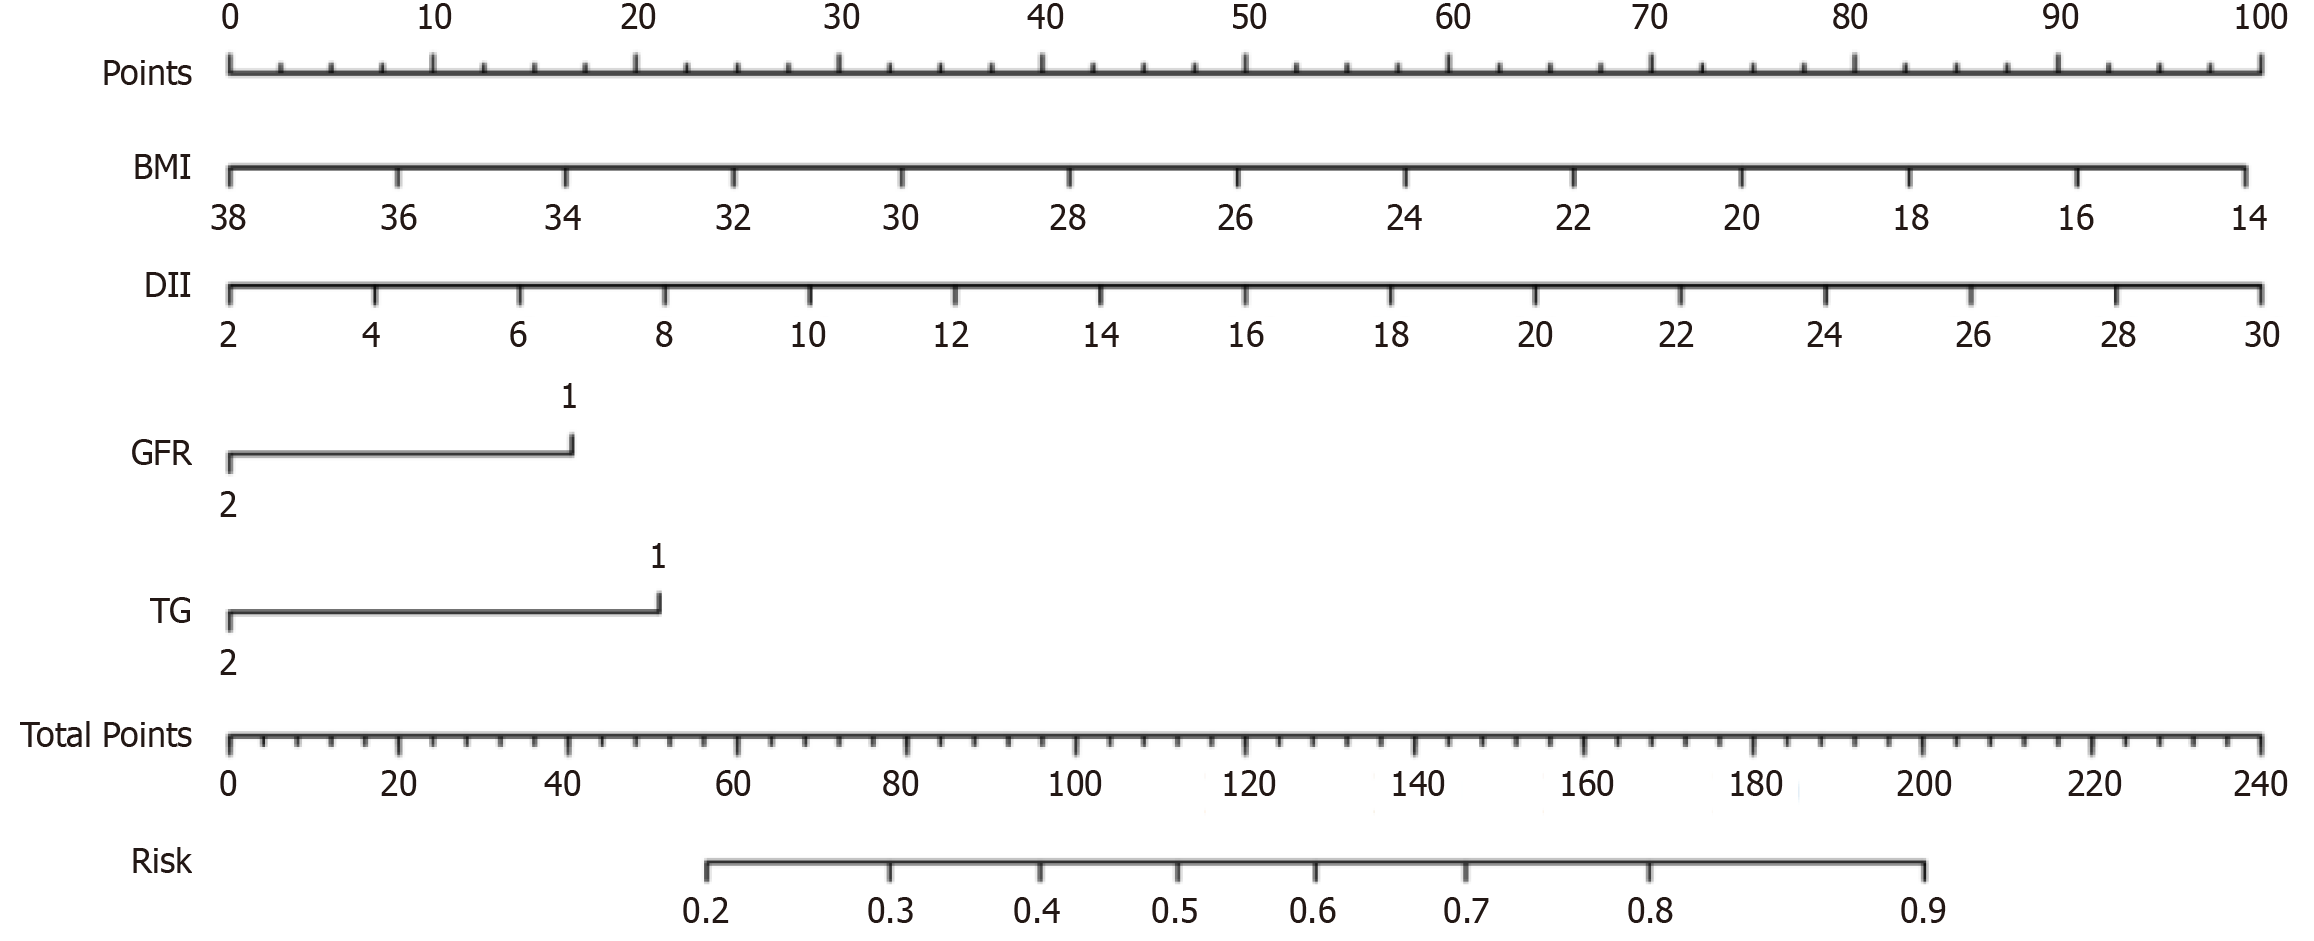
Figure 1 A nomogram model for predicting the risk of hypoglycemia in hospitalized type 2 diabetes mellitus patients treated with insulin.
For estimating the risk of hypoglycemia, the corresponding value is found for each variable on its corresponding axis. Then, a vertical line is drawn from the variable axis to the scoring scale to obtain the score for each variable. The total score is calculated from the sum of scores for all the variables. Based on the total points, a vertical line is drawn downwards to the risk axis to obtain the hypoglycemia risk for each individual patient. BMI: Body mass index; DII: Duration of intensive insulin therapy; GFR: Glomerular filtration rate; TG: Triglyceride.
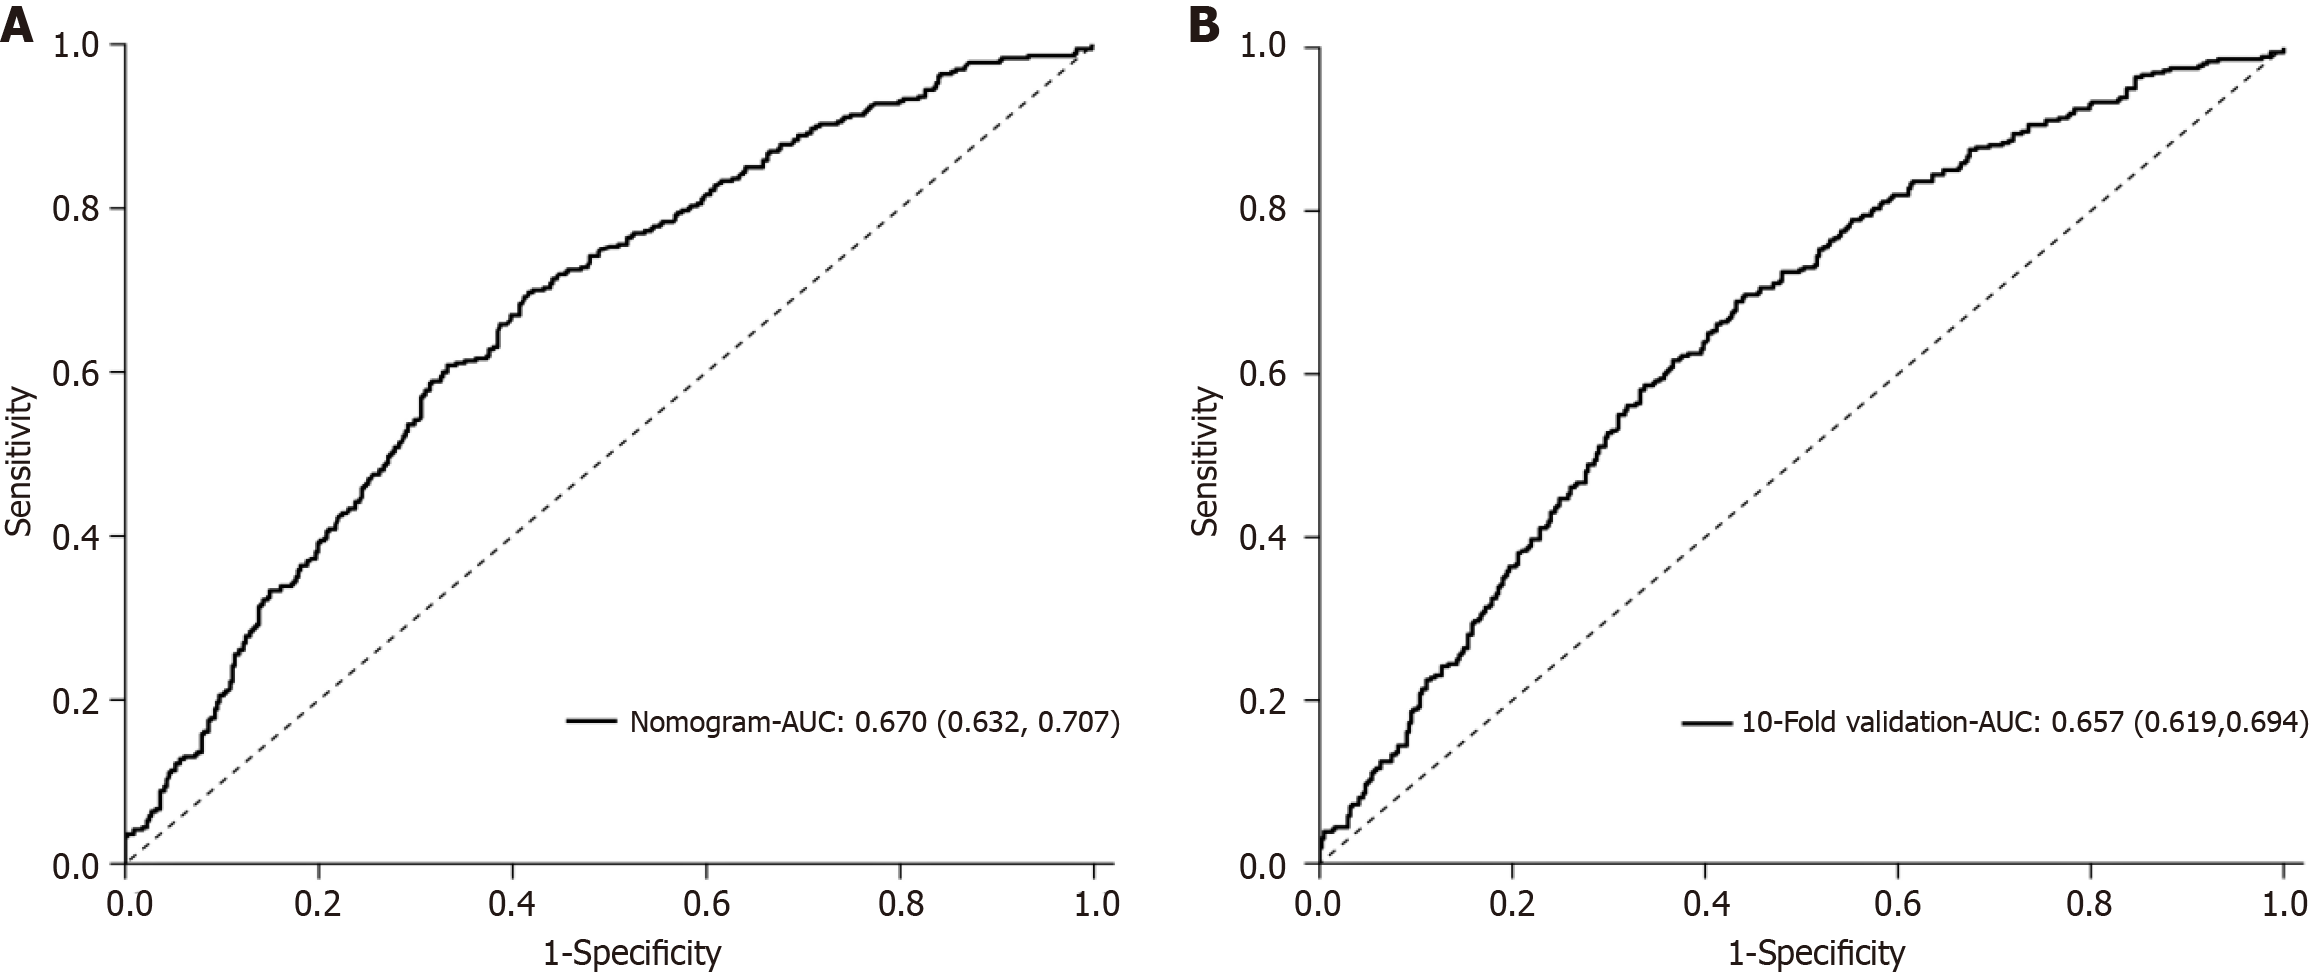
Figure 2 Receiver operating characteristic curve analysis of the hypoglycemia risk prediction model on the training set and after 10-fold cross-validation.
A: The receiver operating characteristic (ROC) curve generated using the training set; B: The ROC curve derived from predictions obtained through 10-fold cross-validation.
- Citation: Zhang Y, Hu XL, Xu WR, Chen YM, Guo XD, Liu SH, Gao LL. Development and validation of a hypoglycemia risk prediction tool for hospitalized patients with type 2 diabetes mellitus treated with insulin. World J Diabetes 2025; 16(9): 104290
- URL: https://www.wjgnet.com/1948-9358/full/v16/i9/104290.htm
- DOI: https://dx.doi.org/10.4239/wjd.v16.i9.104290


