Copyright
©The Author(s) 2025.
World J Diabetes. Jul 15, 2025; 16(7): 105156
Published online Jul 15, 2025. doi: 10.4239/wjd.v16.i7.105156
Published online Jul 15, 2025. doi: 10.4239/wjd.v16.i7.105156
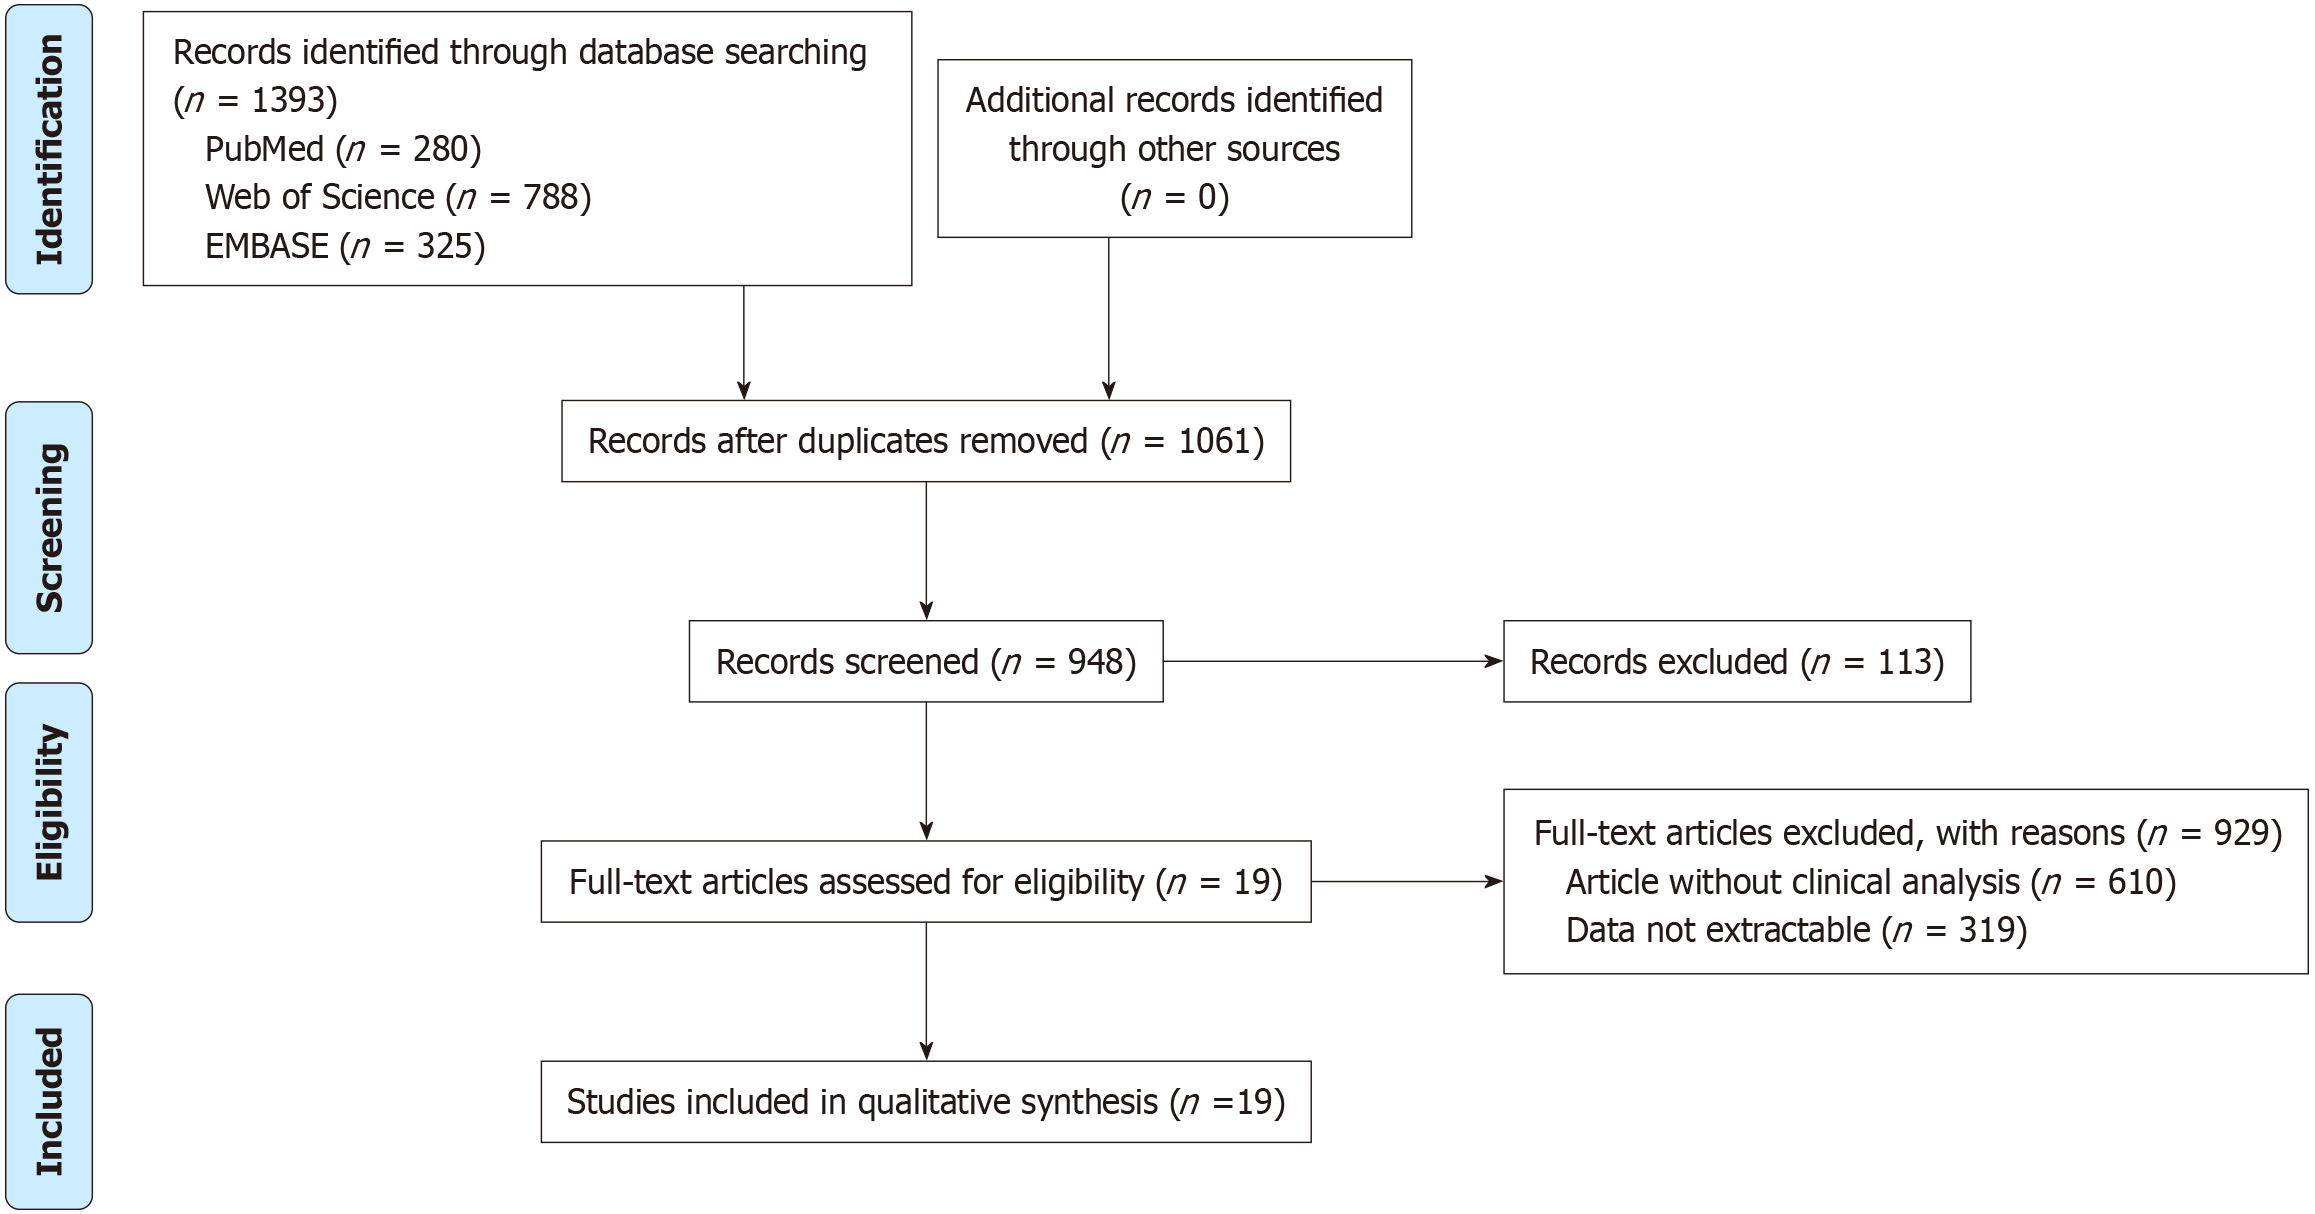
Figure 1 Flow diagram of the study selection process.
Figure 2 Forest plot.
A: Forest plot for SMD in CD3+T cells between gestational diabetes mellitus (GDM) cases and controls; B: Forest plot of total CD4+T cells between GDM cases and controls; C: Forest plot of activation markers positive on CD4+T cells between GDM cases and controls; D: Forest plot of Treg cells between GDM cases and controls; E: Forest plot of total CD8+T cells between GDM cases and controls.
- Citation: Yang Y, Xiao QZ, Zhou J, Wang YQ. Abnormal peripheral cellular immune profiles in gestational diabetes mellitus: A meta-analysis. World J Diabetes 2025; 16(7): 105156
- URL: https://www.wjgnet.com/1948-9358/full/v16/i7/105156.htm
- DOI: https://dx.doi.org/10.4239/wjd.v16.i7.105156


