Copyright
©The Author(s) 2025.
World J Diabetes. Jun 15, 2025; 16(6): 105592
Published online Jun 15, 2025. doi: 10.4239/wjd.v16.i6.105592
Published online Jun 15, 2025. doi: 10.4239/wjd.v16.i6.105592
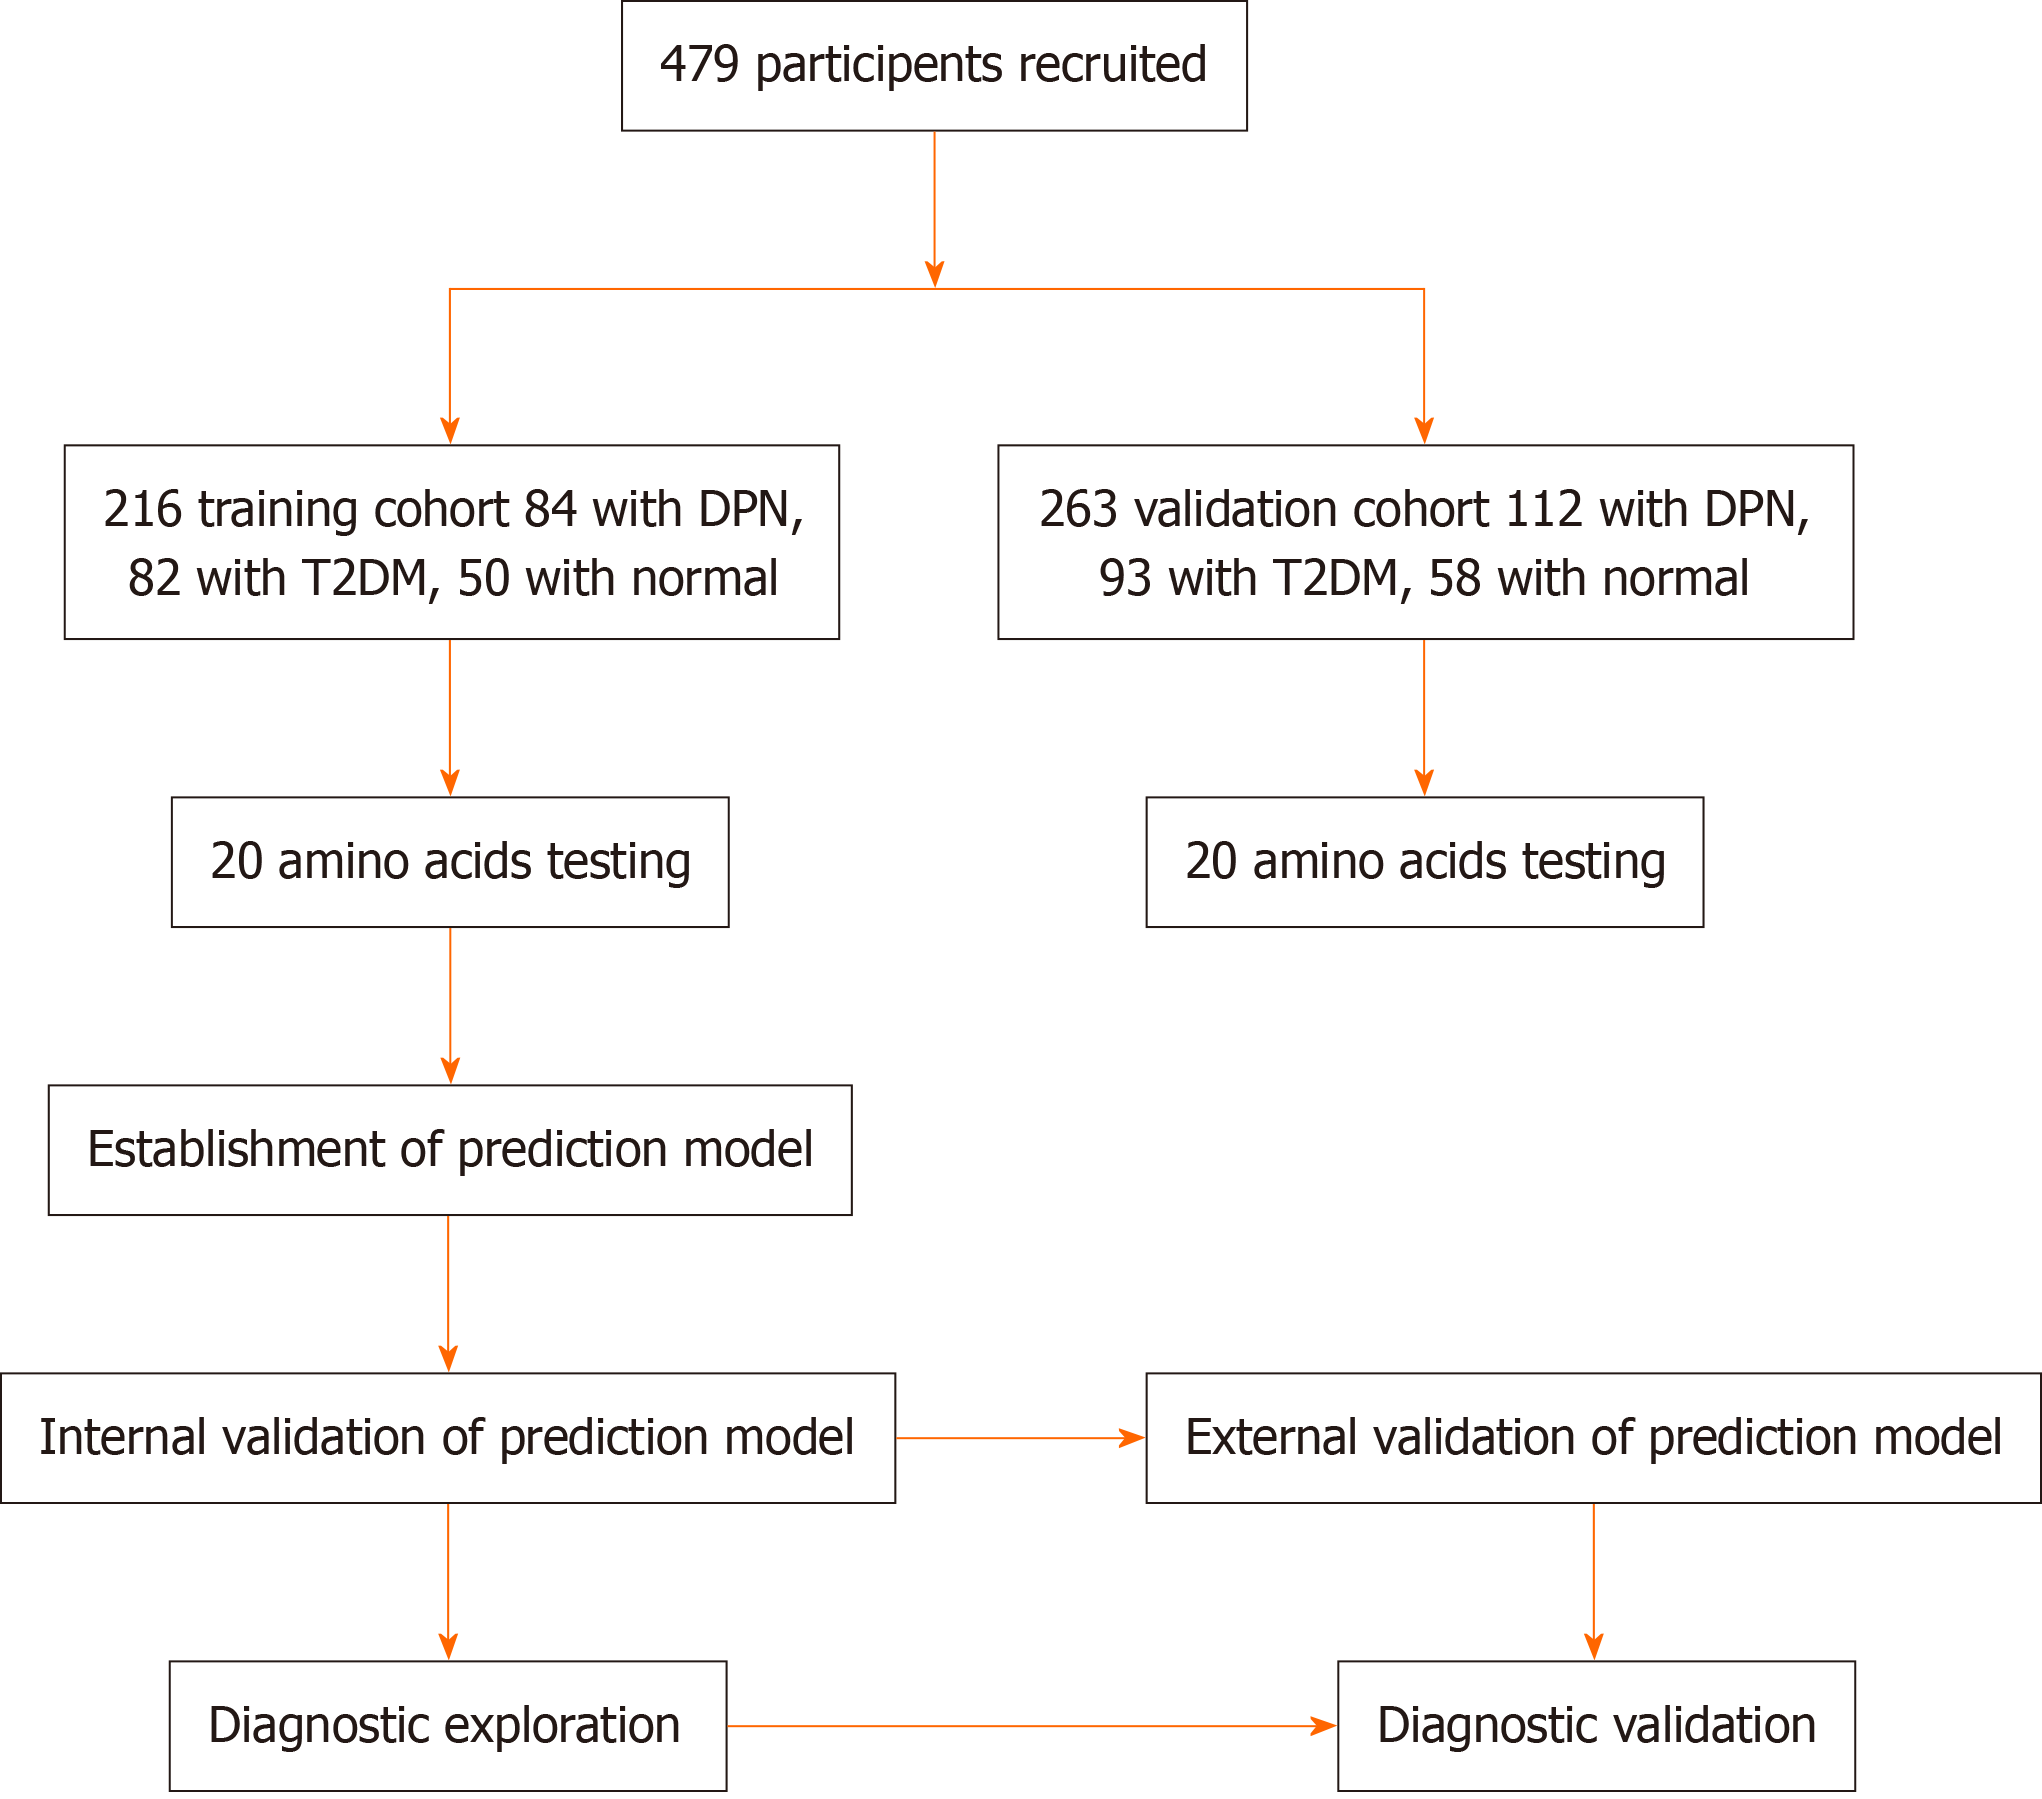
Figure 1 Flow diagram of the cohorts used for the generation and validation of serum amino acid signatures.
DPN: Diabetic peripheral neuropathy; T2DM: Type 2 diabetes mellitus.
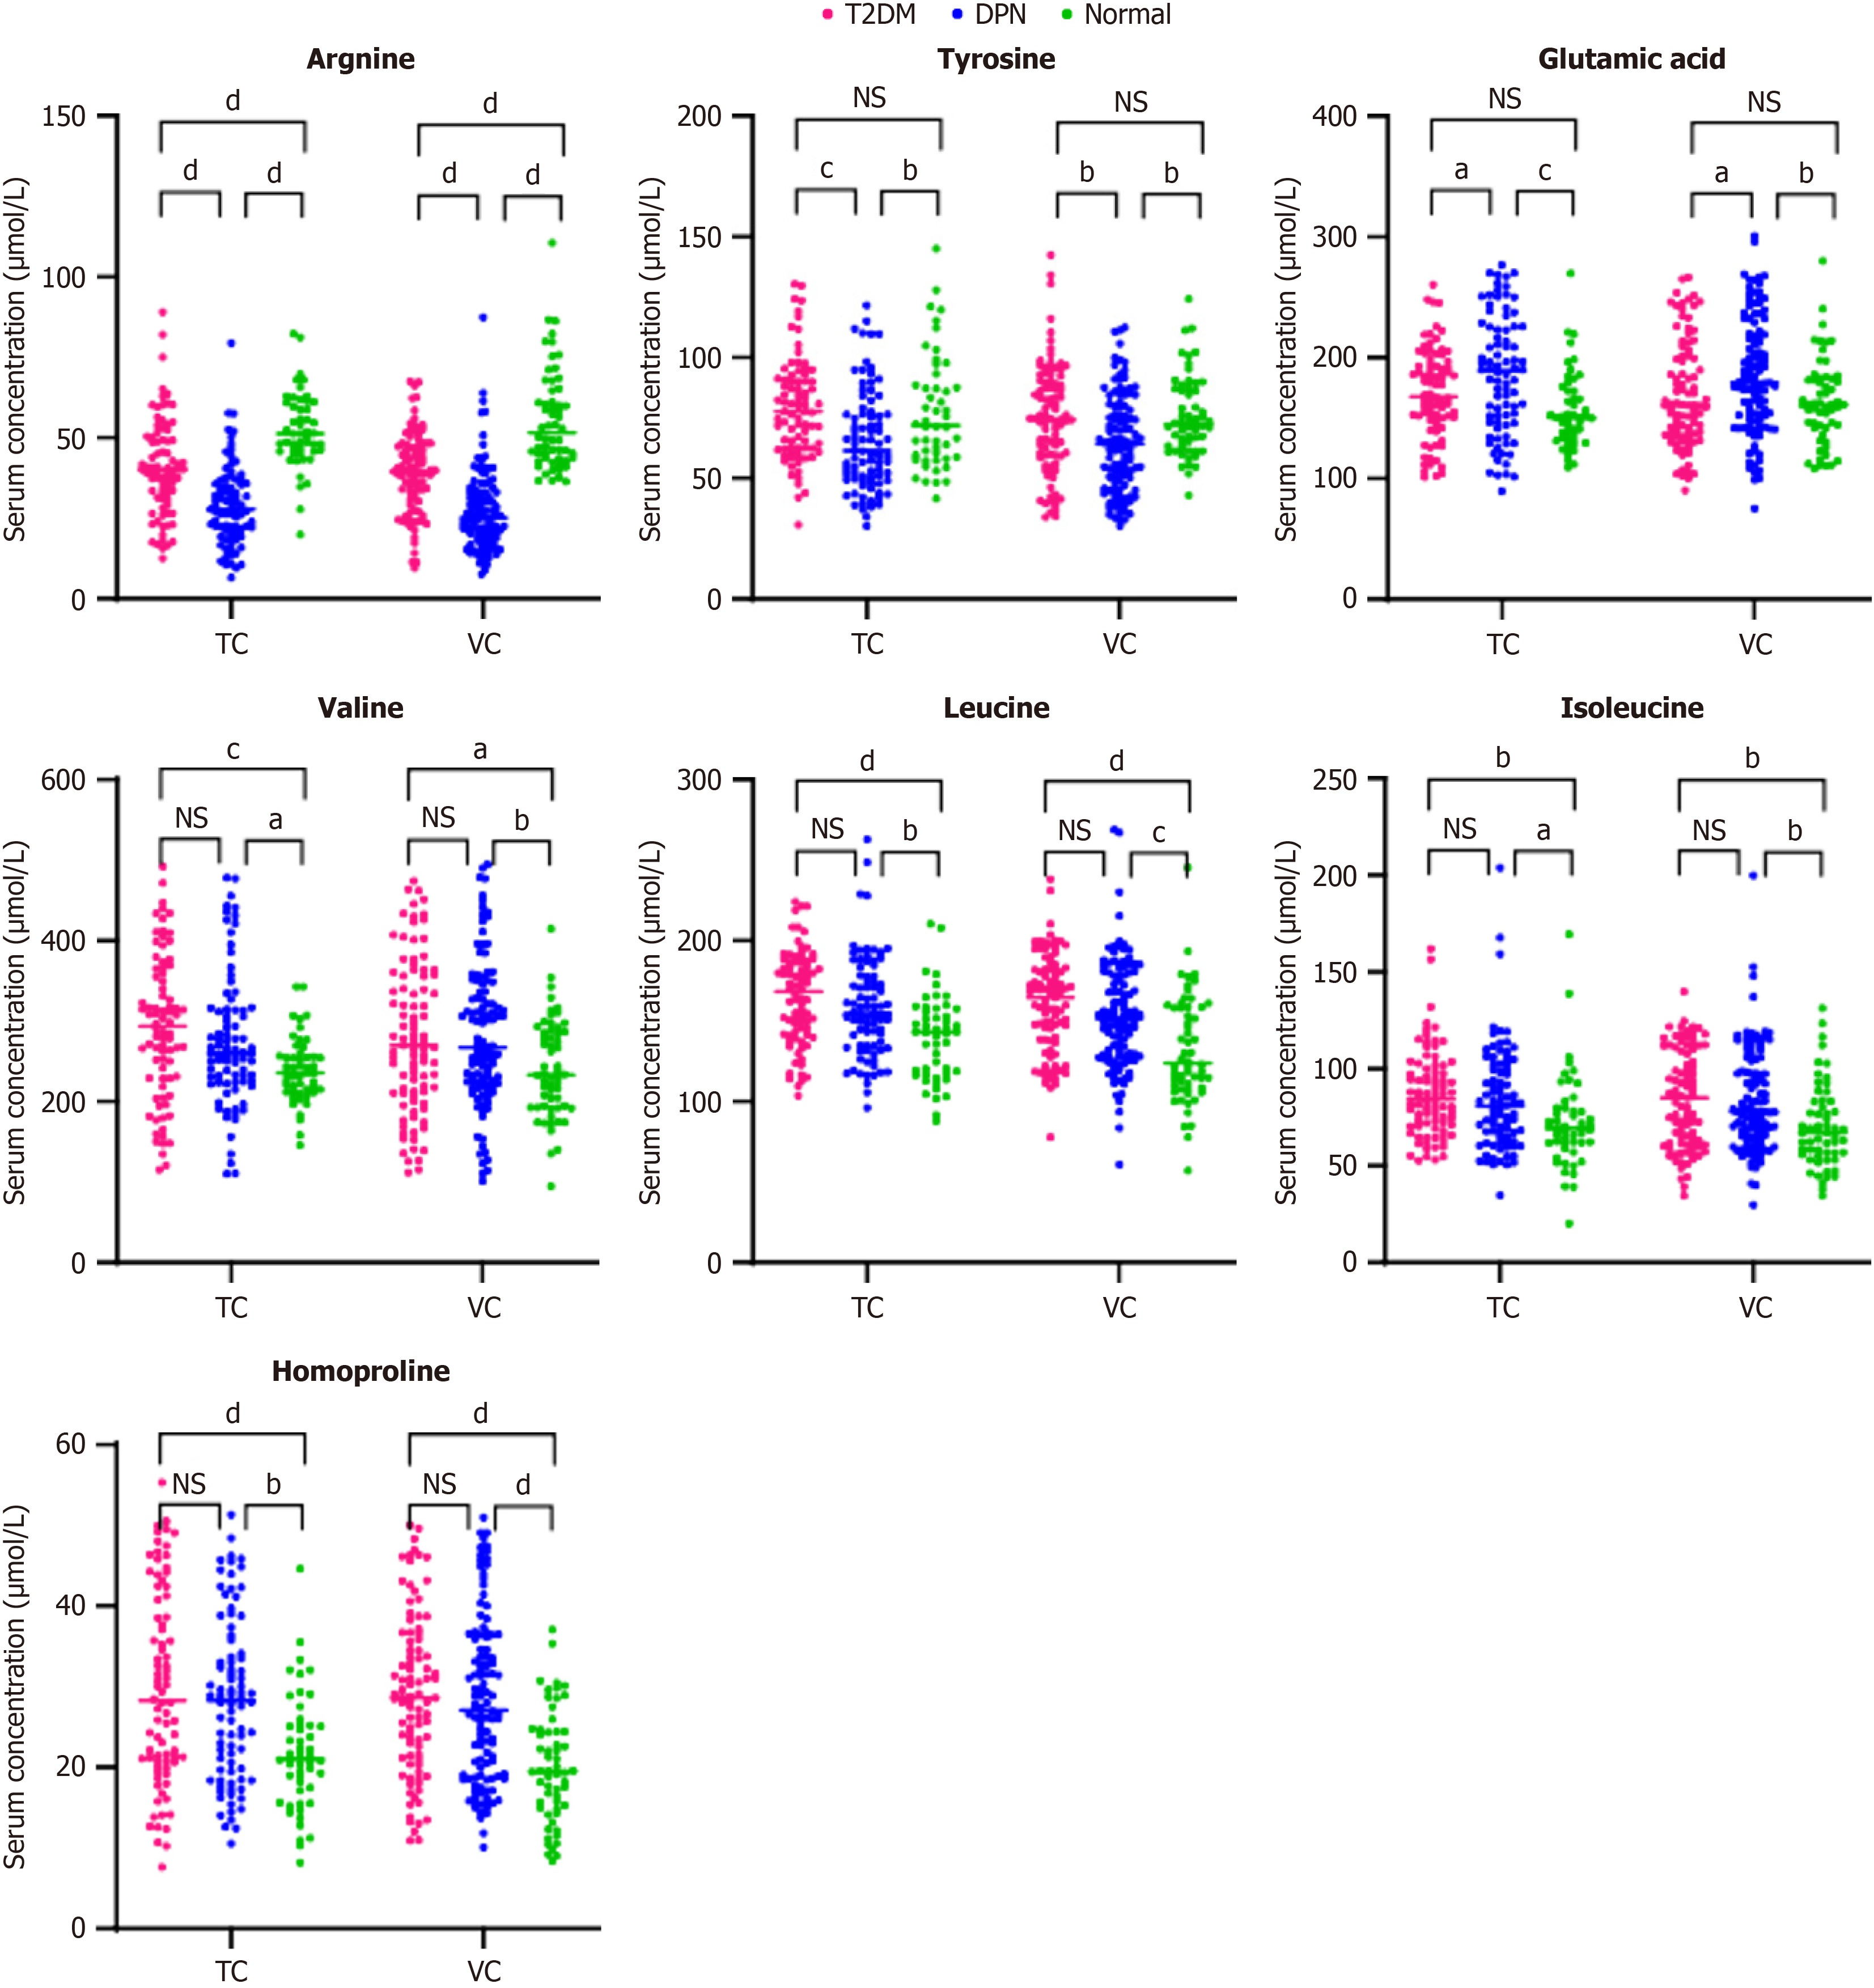
Figure 2 Scatter plots of the serum relative concentrations of amino acids among diabetic peripheral neuropathy patients, type 2 diabetes mellitus patients and normal controls in the training cohort and validation cohort.
aP < 0.05; bP < 0.01; cP < 0.001; dP < 0.0001; NS: Not significant; TC: Training cohort; VC: Validation cohort (one-way ANOVA).
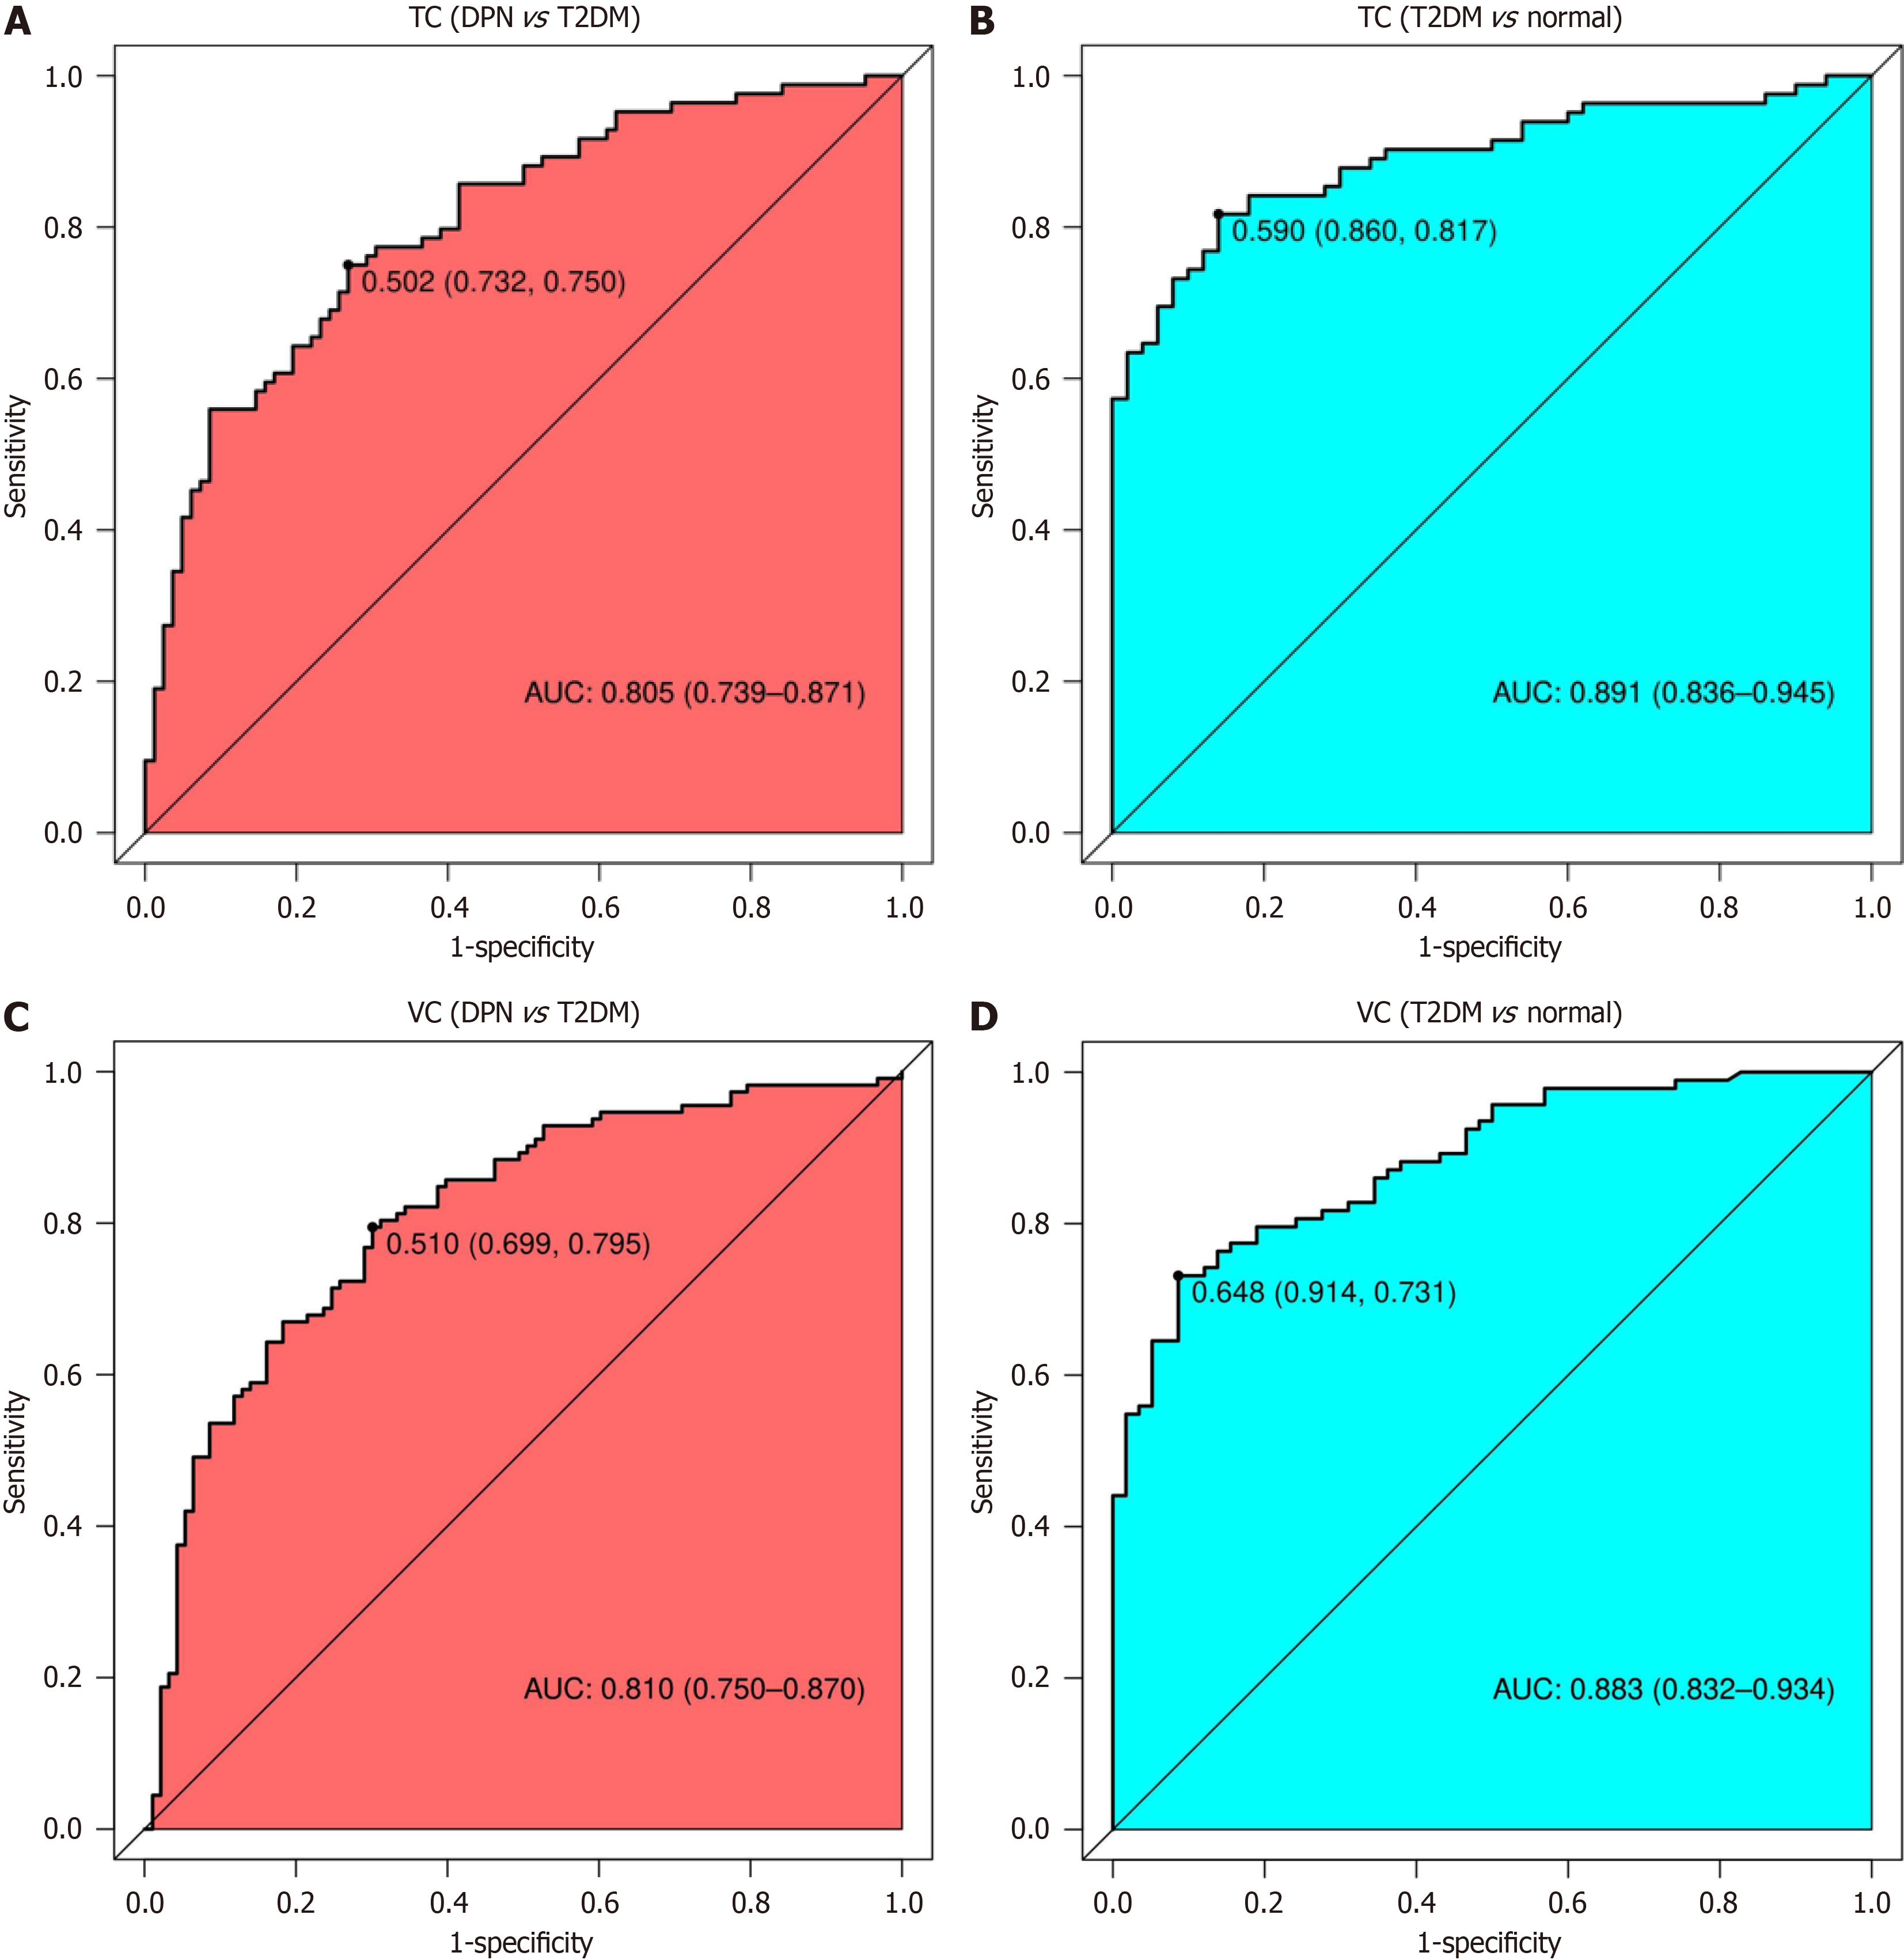
Figure 3 Receiver operating characteristic area under the curve for the specificity and sensitivity of the predictive model in the training cohort and validation cohort.
A: Performance of the prediction model for discriminating diabetic peripheral neuropathy (DPN) patients from type 2 diabetes mellitus (T2DM) patients; B: T2DM patients from normal controls; C: Discriminating DPN patients from T2DM patients; D: T2DM patients from normal controls. AUC: Area under the curve; T2DM: Type 2 diabetes mellitus; DPN: Diabetic peripheral neuropathy; TC: Training cohort; VC: Validation cohort.
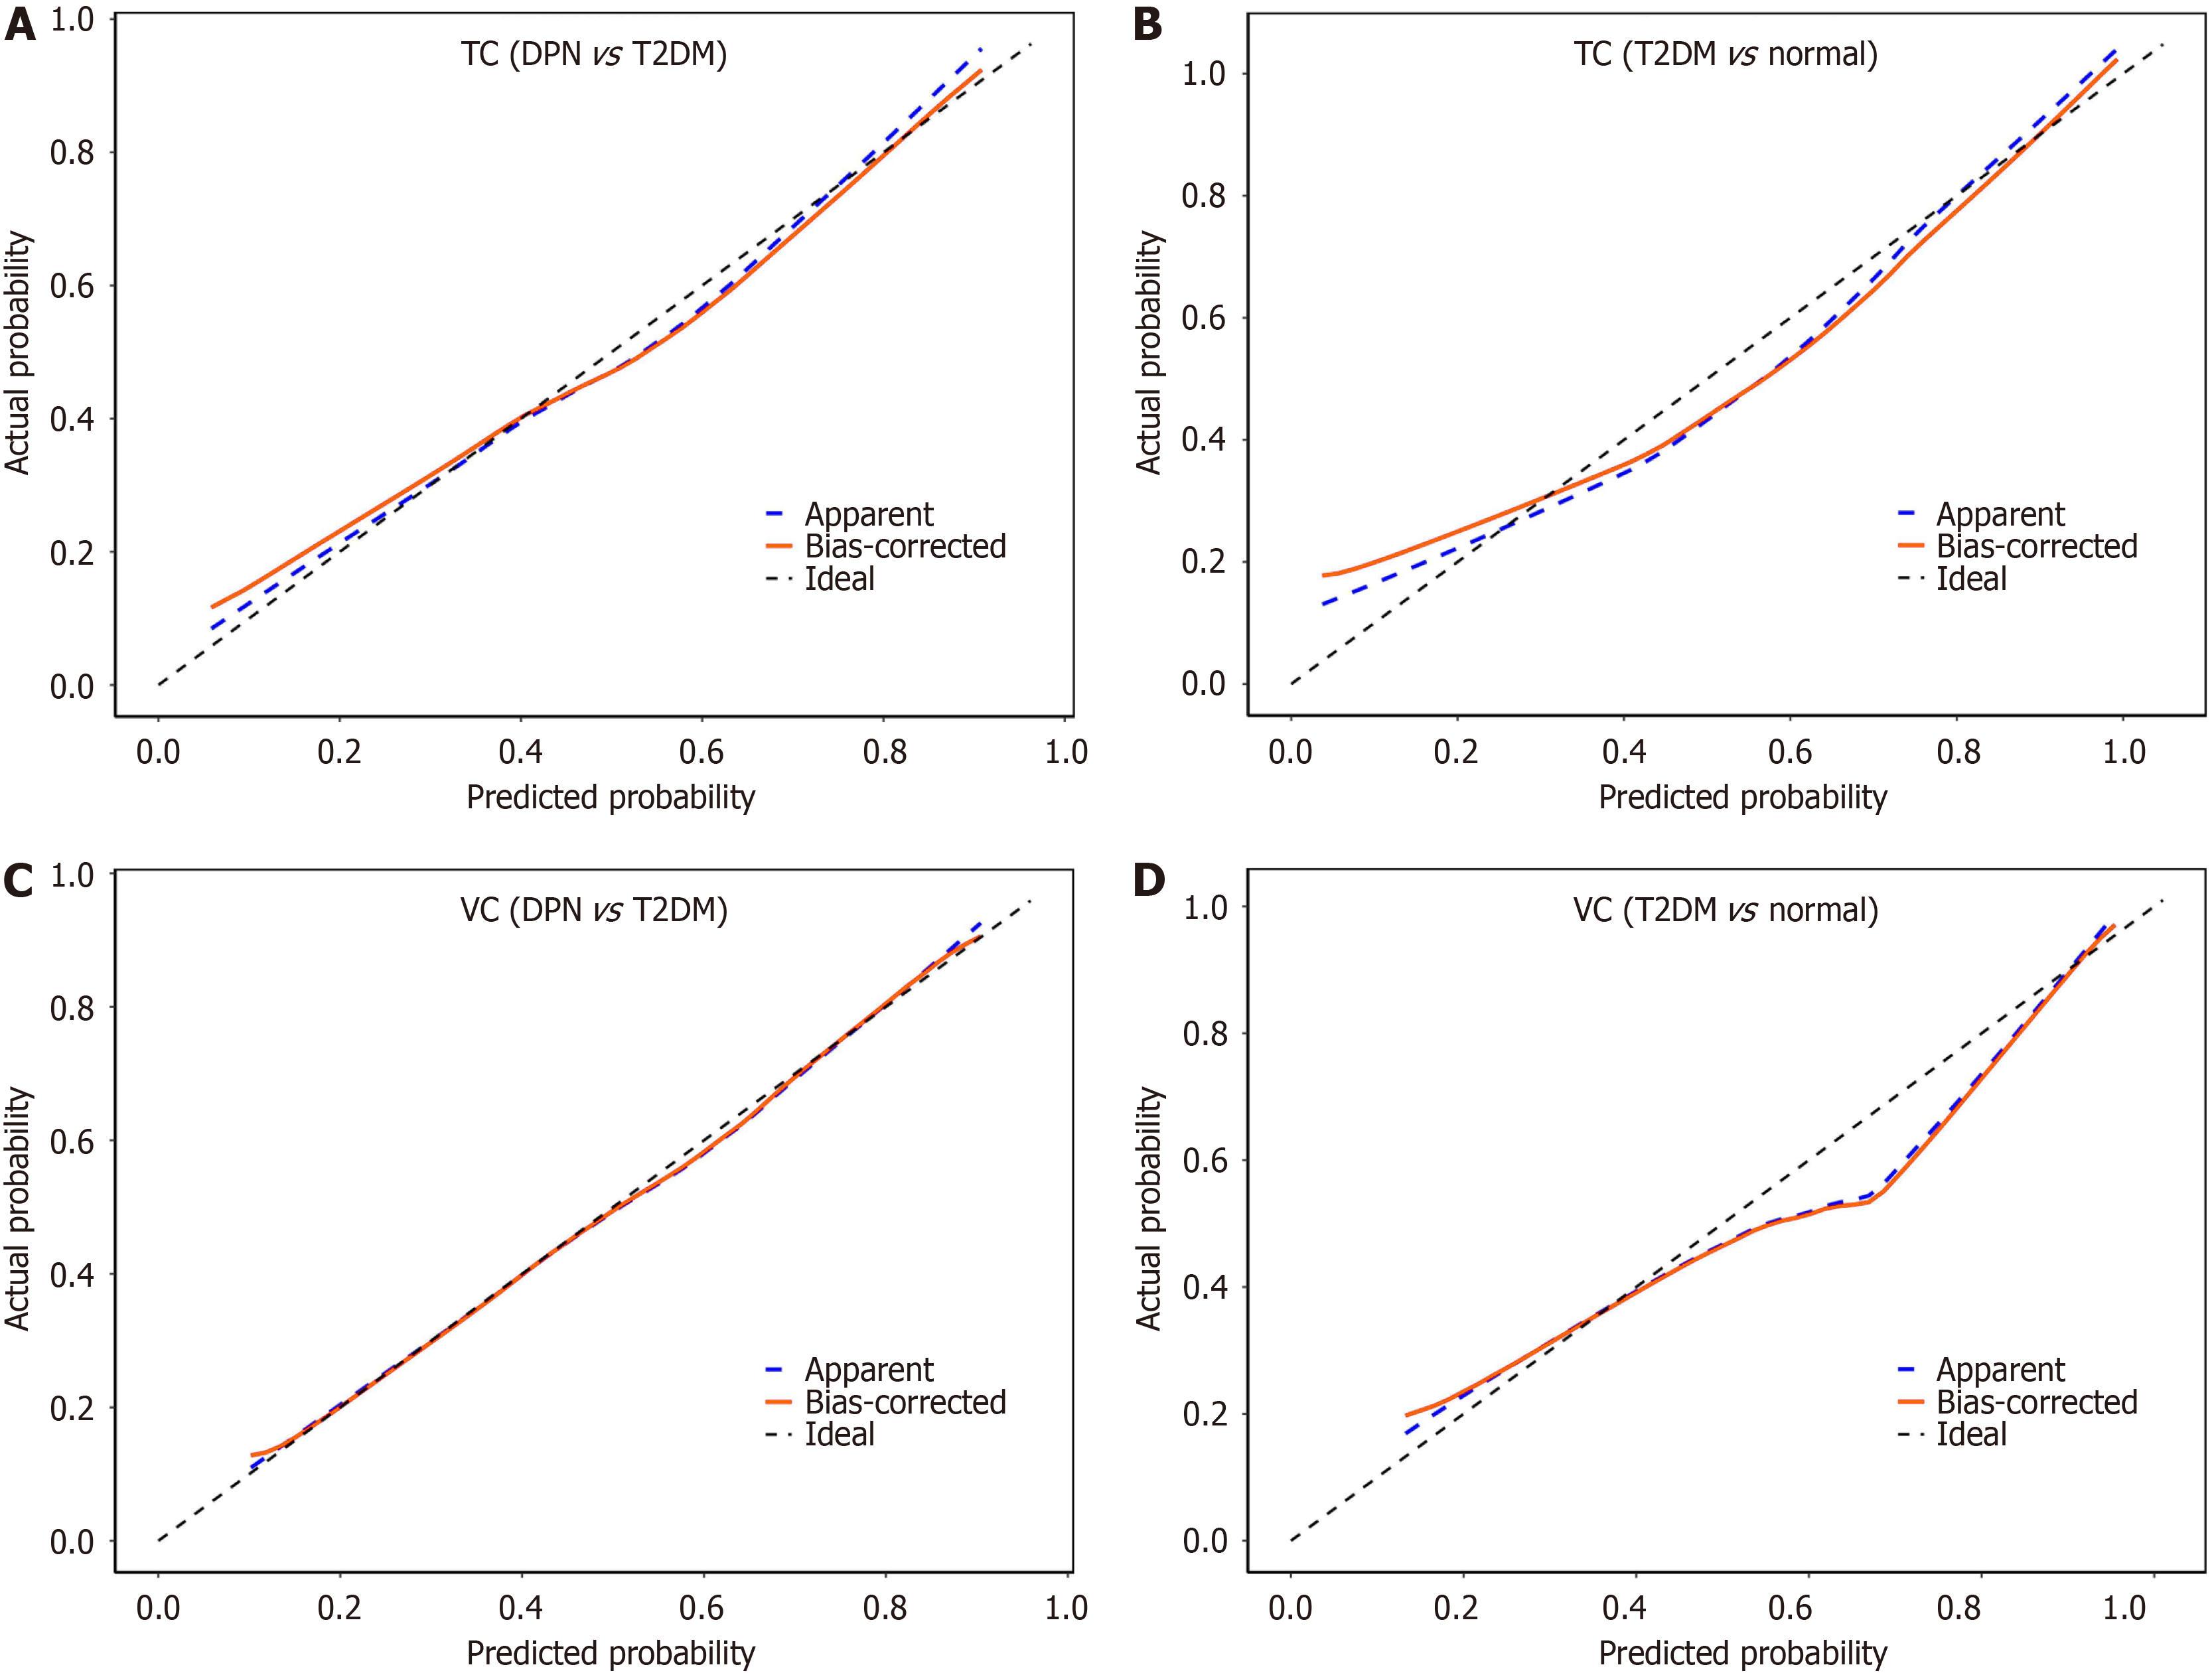
Figure 4 Calibration curve for predicting the probability of diabetic peripheral neuropathy and type 2 diabetes mellitus.
A: Training cohort (TC) of diabetic peripheral neuropathy (DPN) patients and type 2 diabetes mellitus (T2DM) patients; B: TC of T2DM patients and normal controls; C: Validation cohort (VC) of DPN patients and T2DM patients; D: VC of T2DM patients and normal controls. AUC: Area under the curve; T2DM: Type 2 diabetes mellitus; DPN: Diabetic peripheral neuropathy; TC: Training cohort; VC: Validation cohort.
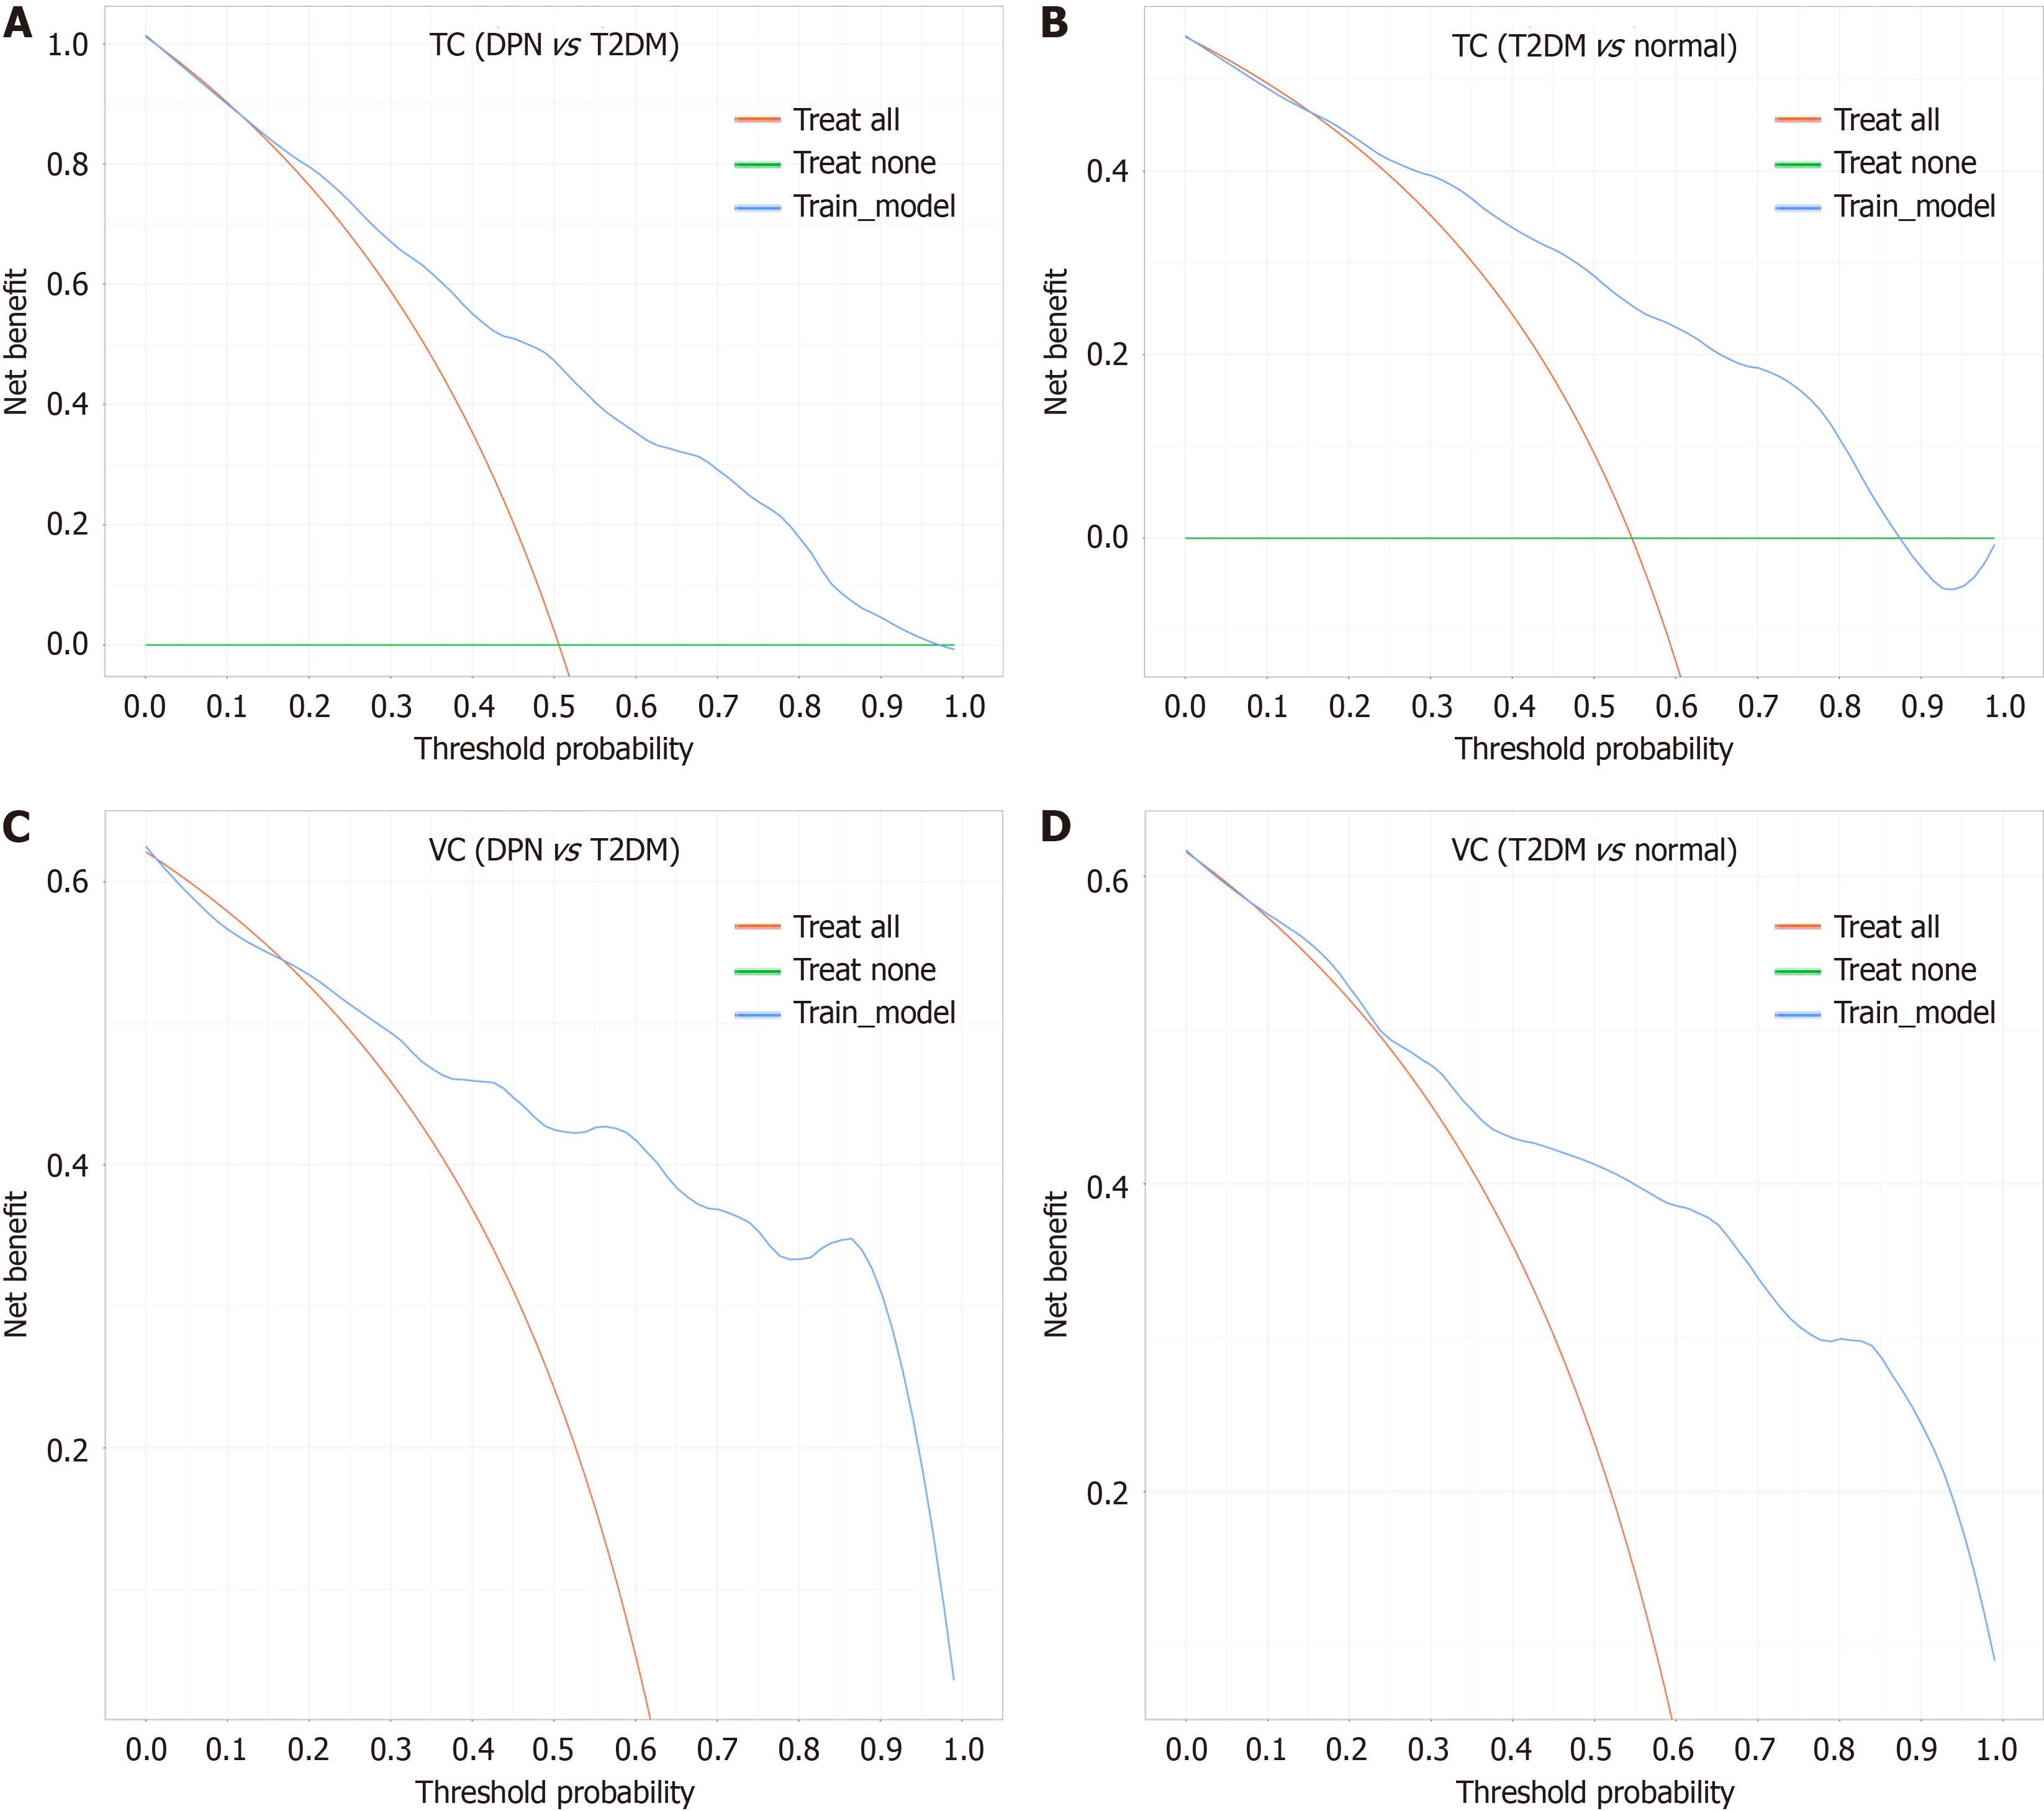
Figure 5 Decision curve analysis.
A and B: Decision curve analysis (DCA) for diabetic peripheral neuropathy prediction in the training cohort (A) and validation cohort (B); C and D: DCA for type 2 diabetes mellitus prediction in the training cohort (C) and validation cohort (D). T2DM: Type 2 diabetes mellitus; DPN: Diabetic peripheral neuropathy; TC: Training cohort; VC: Validation cohort.
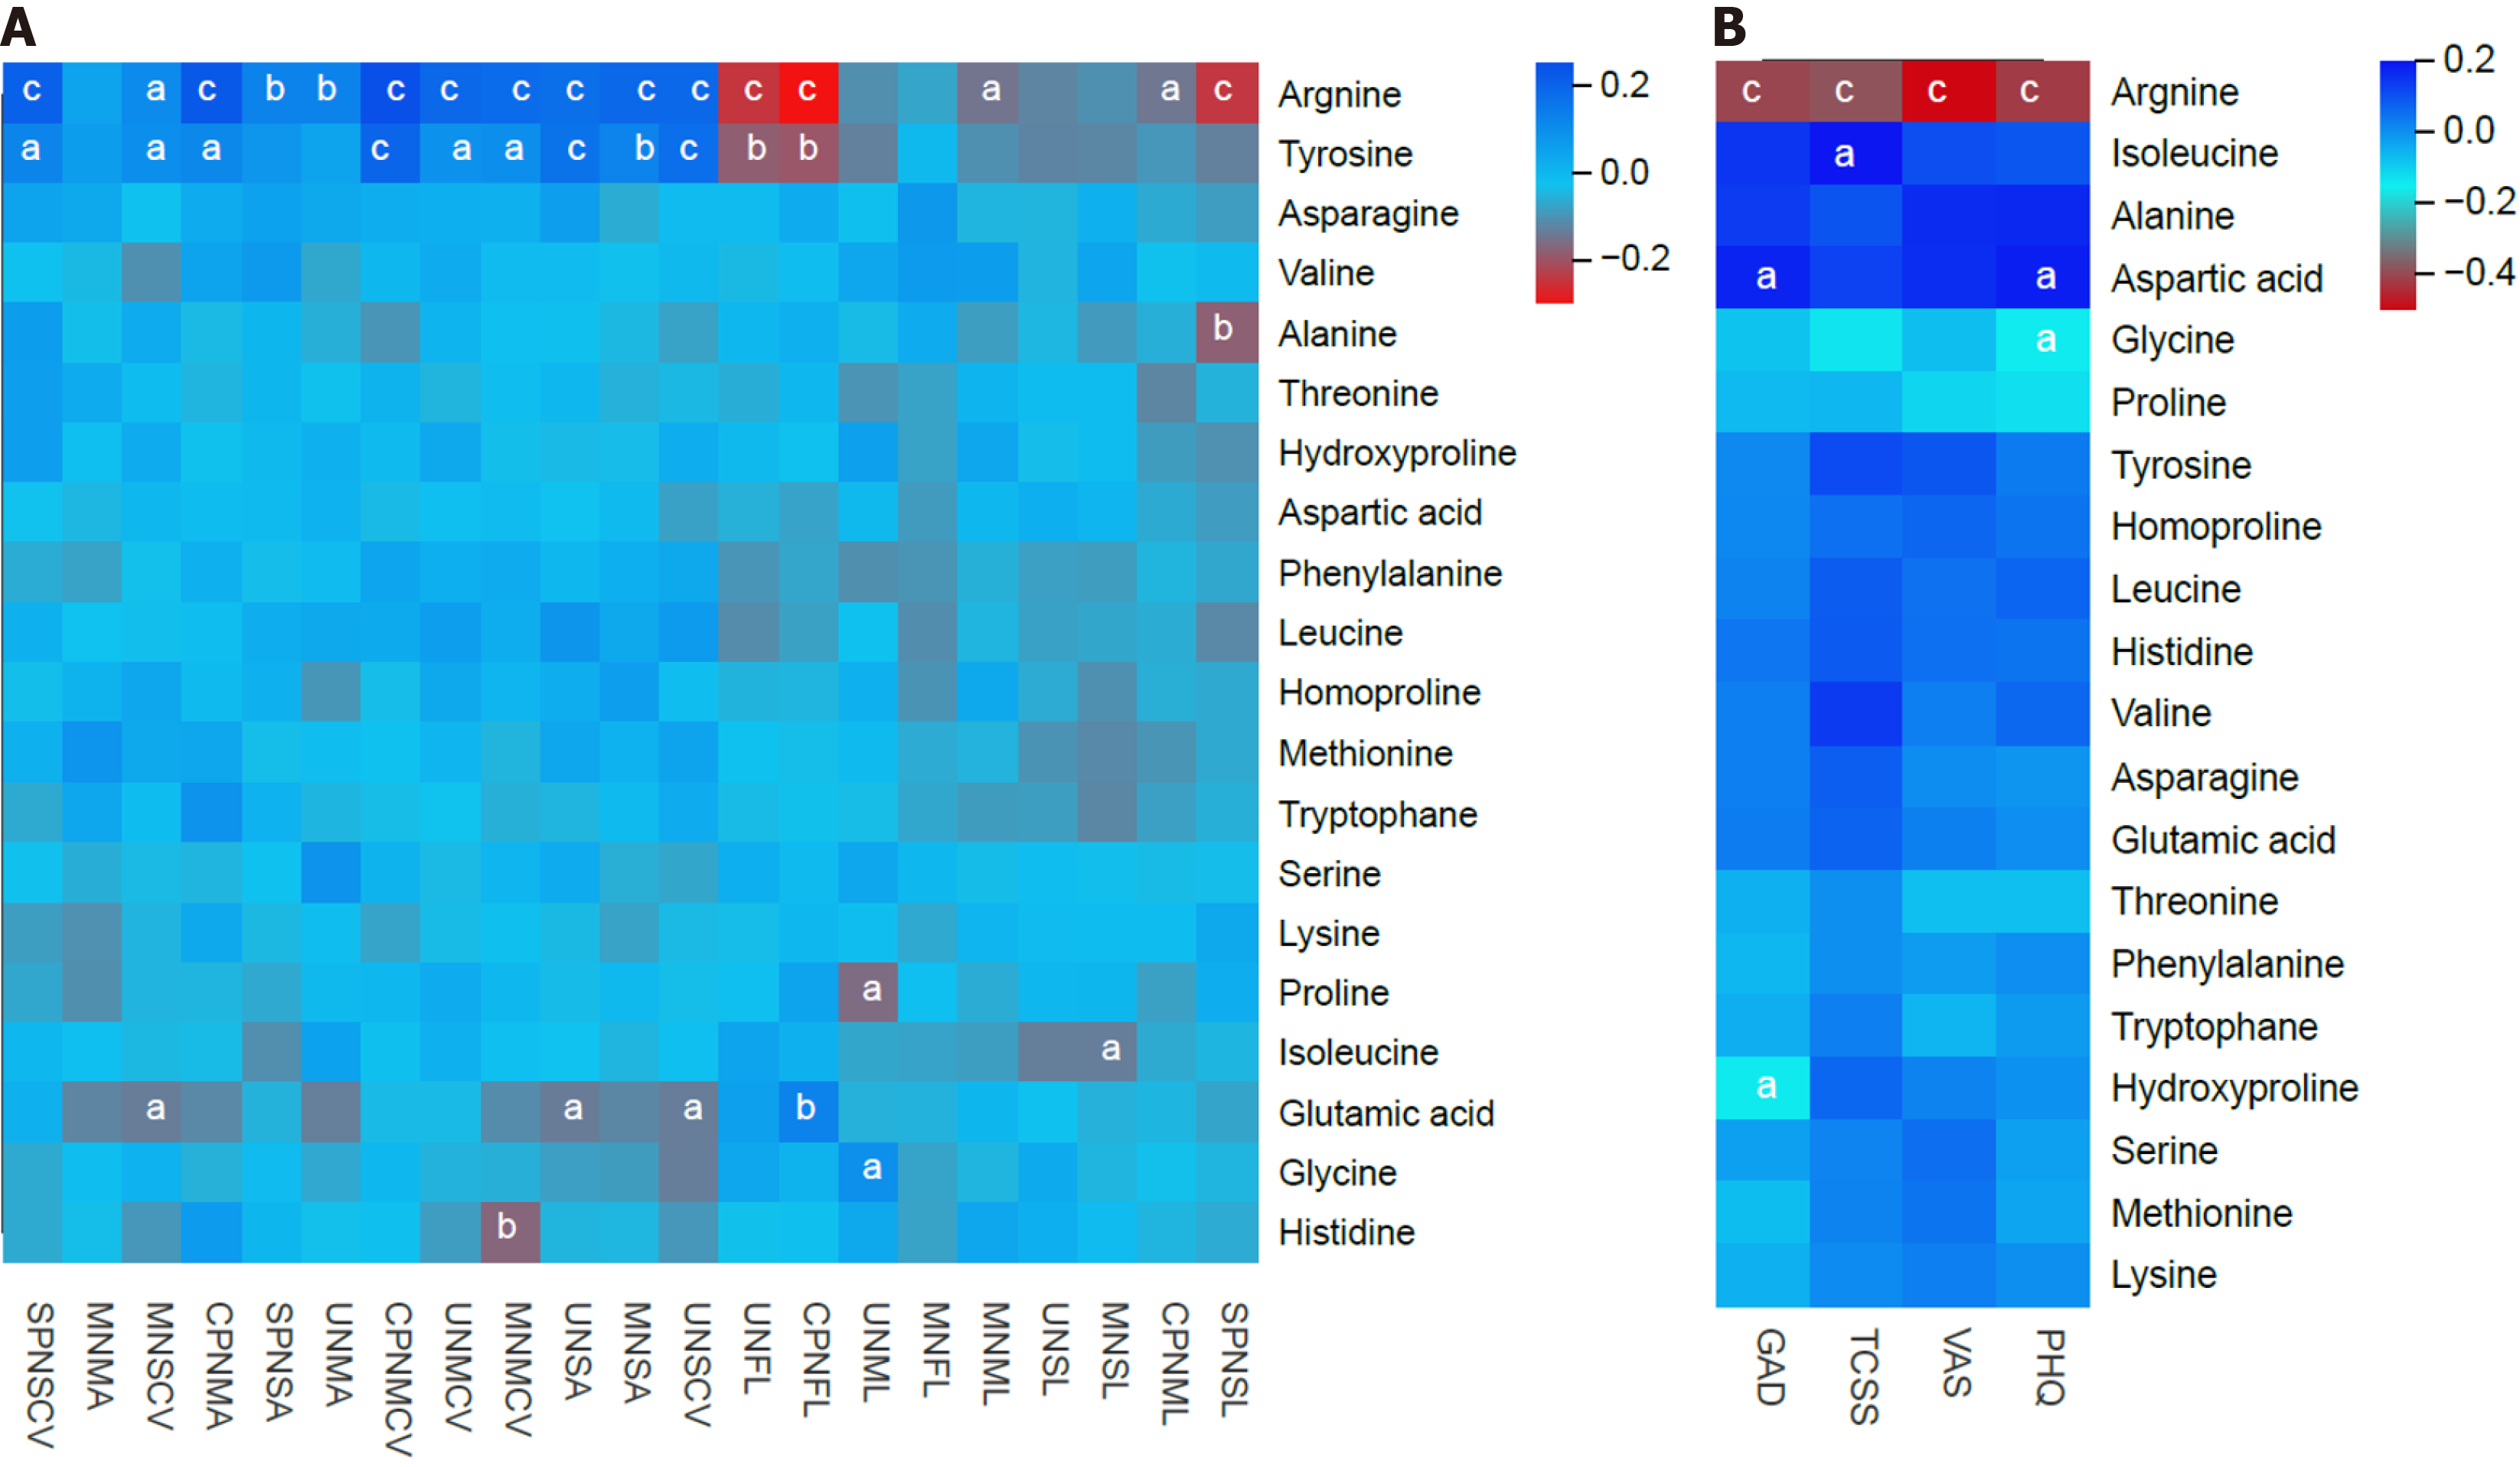
Figure 6 Heatmap correlation between the measured serum amino acid levels and both electromyography parameters and clinical scores.
A: Electromyography parameters; B: Clinical scores. aP < 0.05; bP < 0.01; cP < 0.001; PHQ: Patient health questionnaire; VAS: Visual analog scale; TCSS: Toronto Clinical Scoring System; GAD: Generalized anxiety disorder questionnaire.
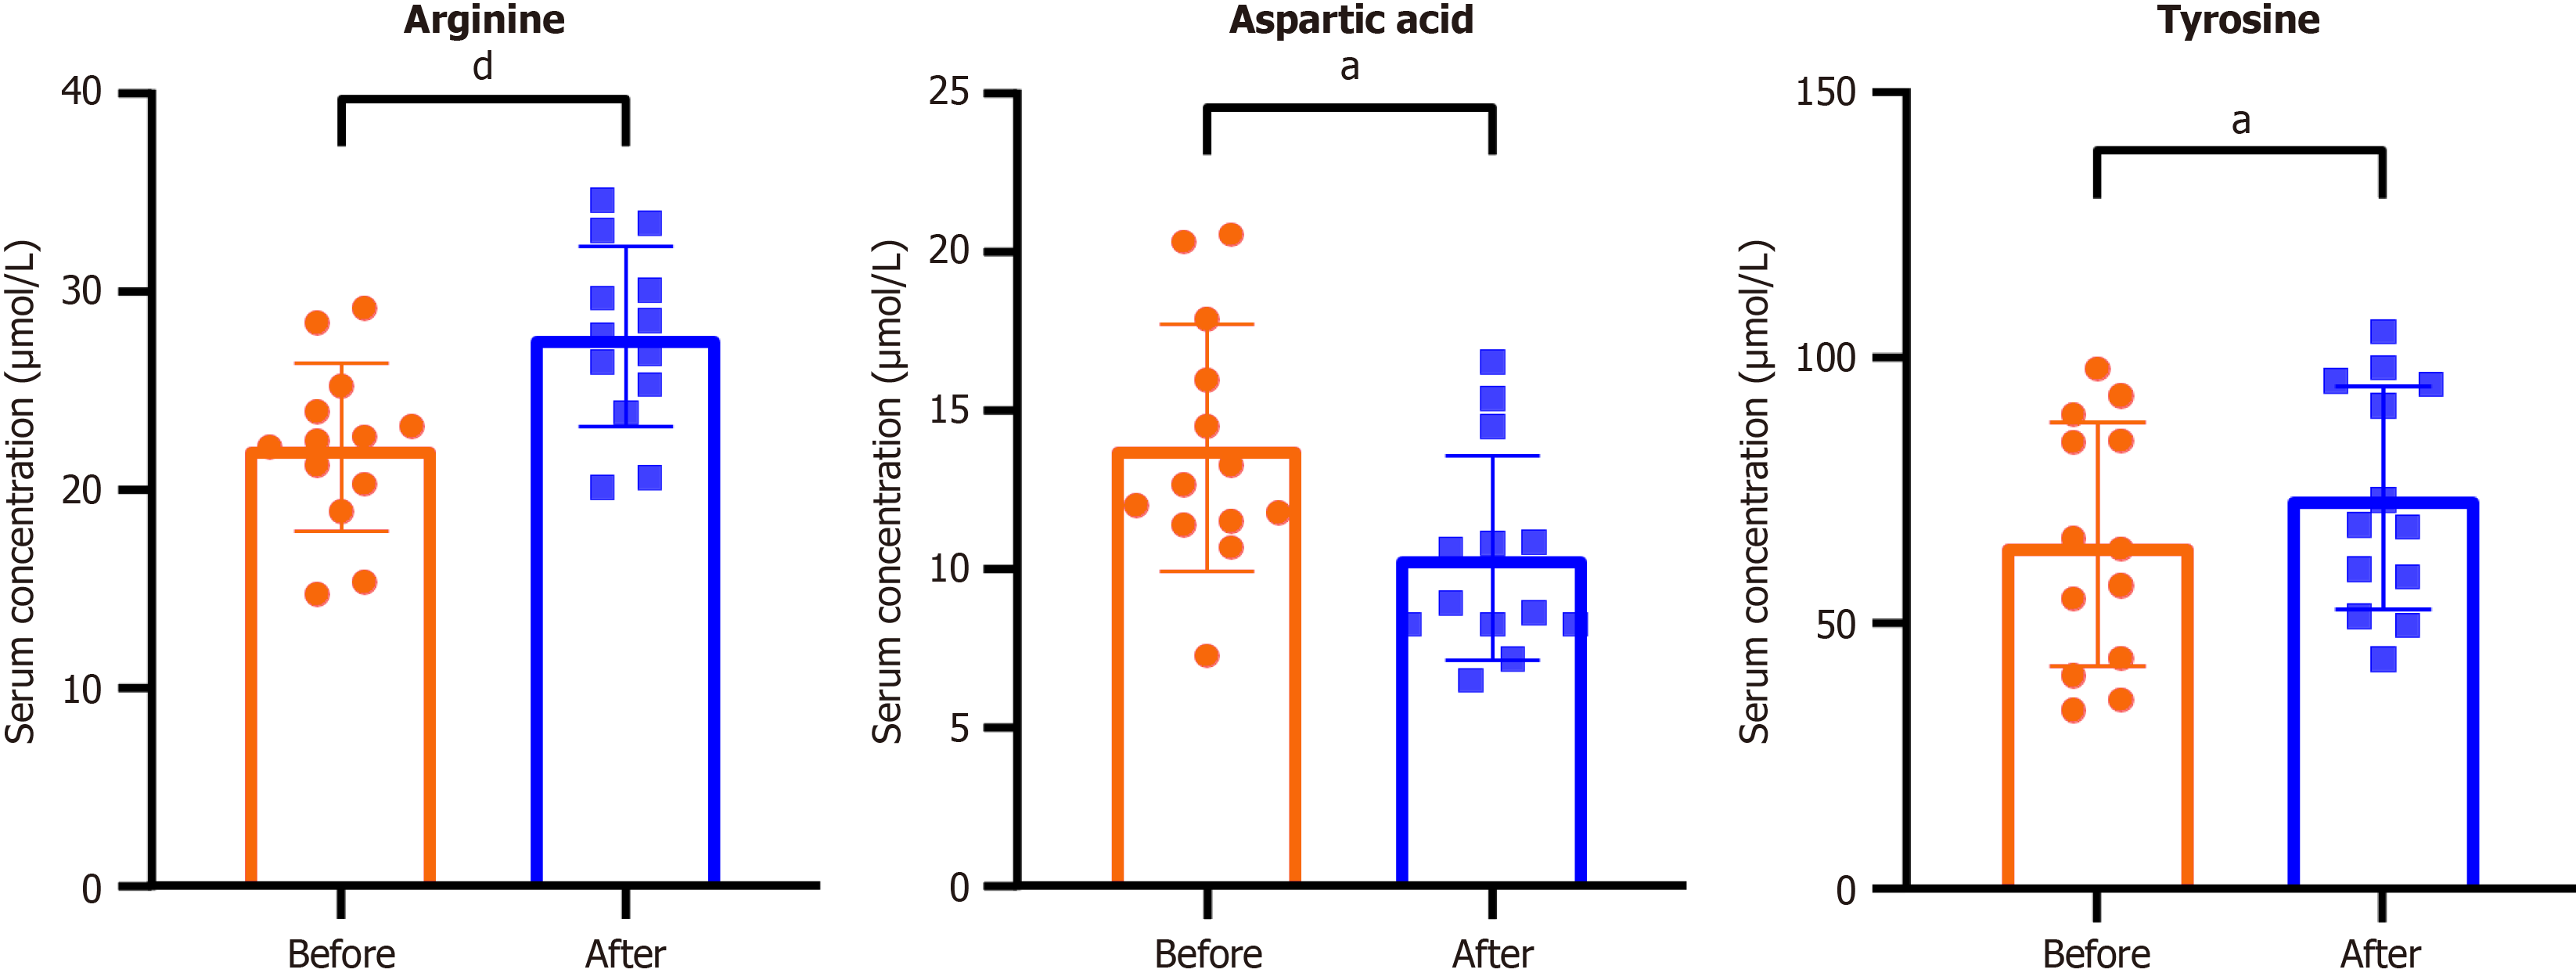
Figure 7 Changes in the serum arginine, aspartic acid and tyrosine levels of 13 diabetic peripheral neuropathy patients after treatment for 3 months.
aP < 0.05; dP < 0.0001.
- Citation: Xu WS, Xing H, Wang QQ, Qi H, He JT, Jin T, Kan YP, Sun SY, Wang JY, Lin FQ. Identification and validation of serum amino acids as diagnostic biomarkers for diabetic peripheral neuropathy. World J Diabetes 2025; 16(6): 105592
- URL: https://www.wjgnet.com/1948-9358/full/v16/i6/105592.htm
- DOI: https://dx.doi.org/10.4239/wjd.v16.i6.105592


