Copyright
©The Author(s) 2025.
World J Diabetes. Jun 15, 2025; 16(6): 105155
Published online Jun 15, 2025. doi: 10.4239/wjd.v16.i6.105155
Published online Jun 15, 2025. doi: 10.4239/wjd.v16.i6.105155
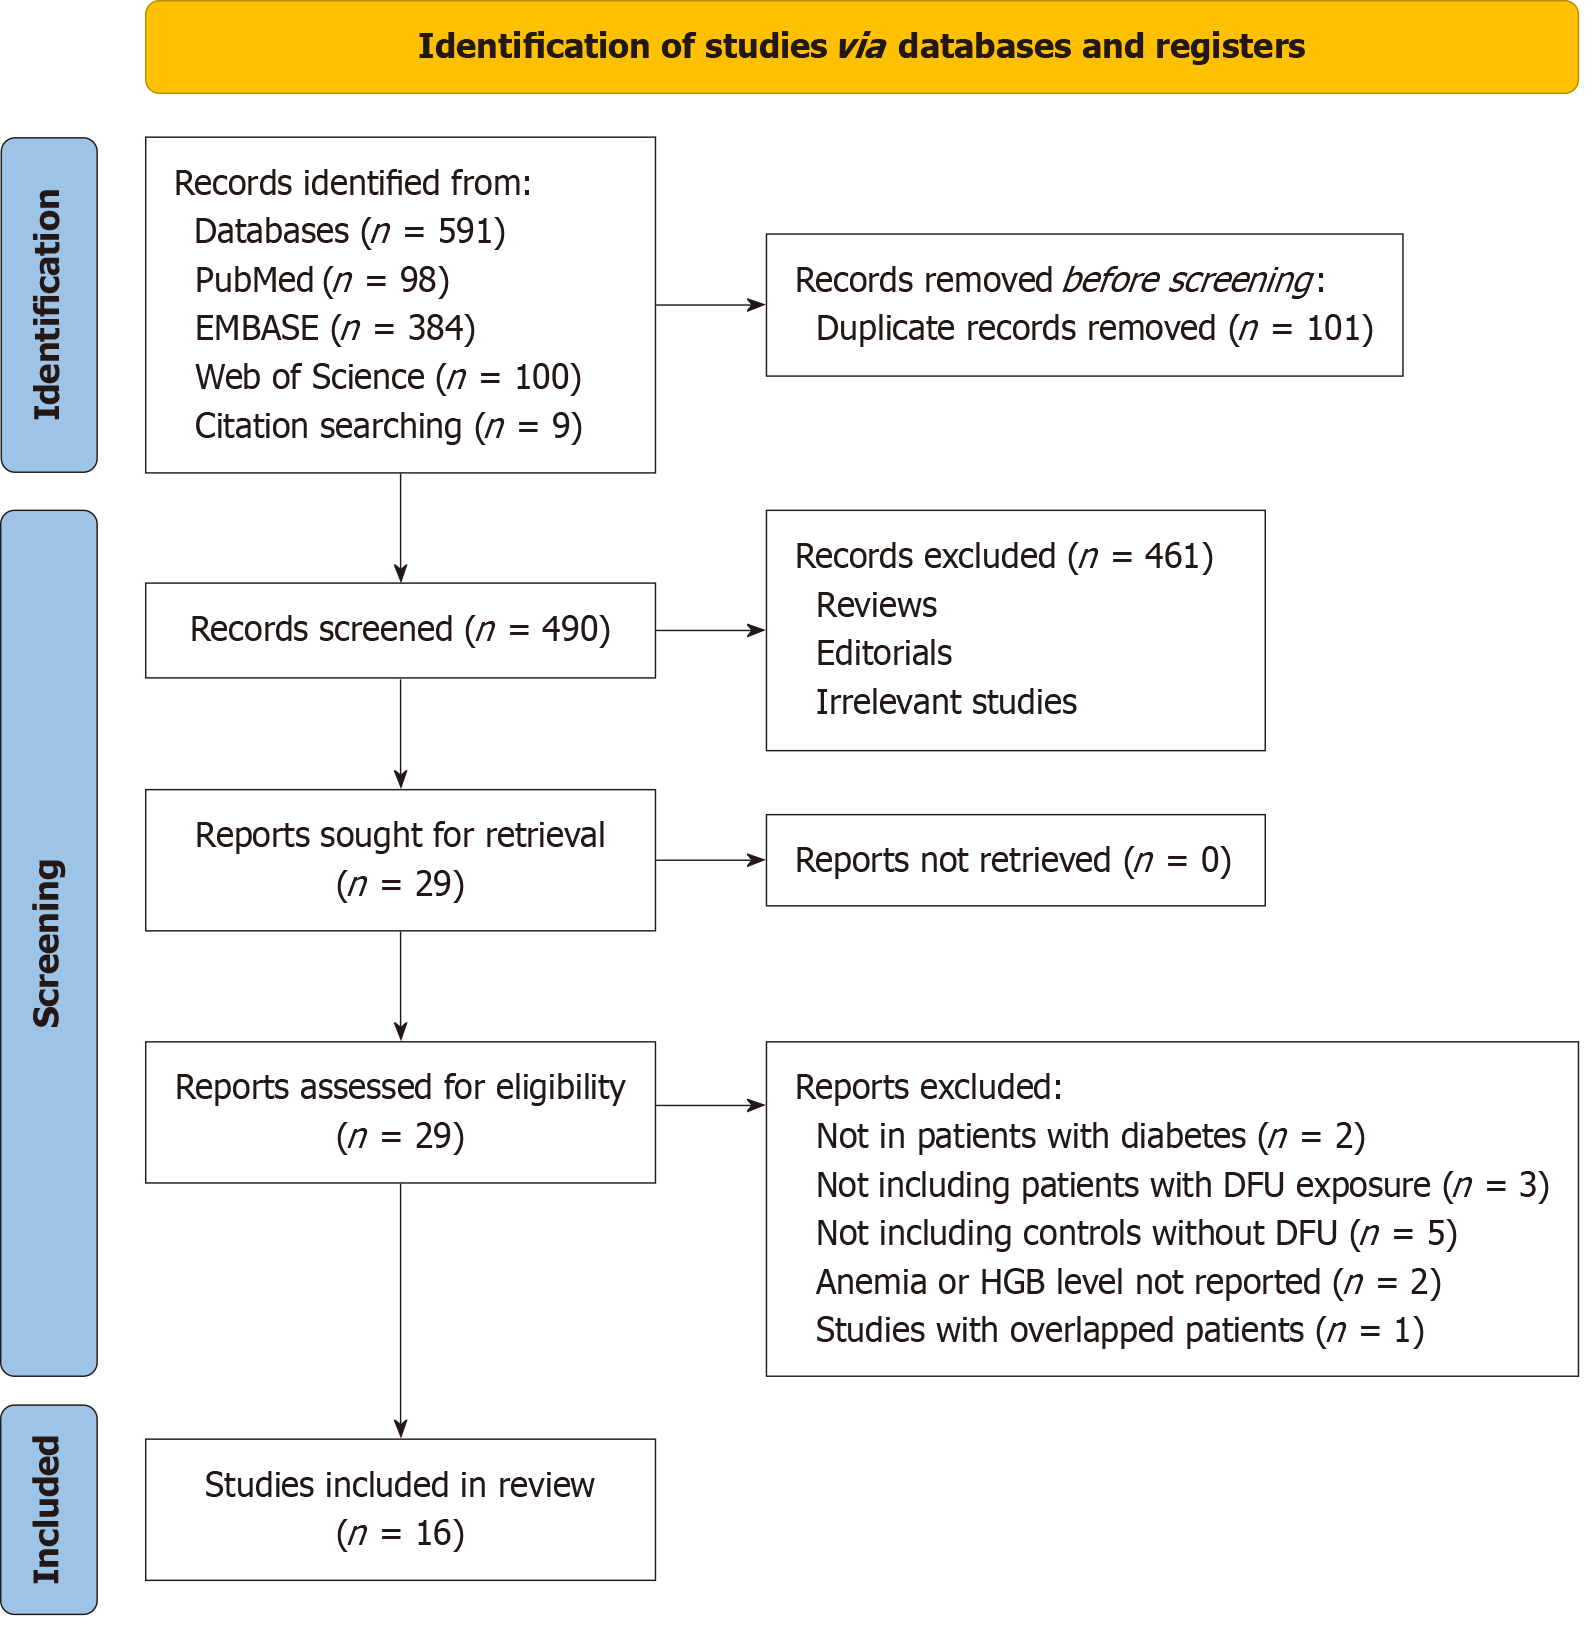
Figure 1 Flowchart of database search and study inclusion.
DFU: Diabetic foot ulcer; HGB: Hemoglobin.
Figure 2 Forest plots for the meta-analysis of the association between anemia and the risk of diabetic foot ulcers in patients with diabetes.
A: Overall meta-analysis; B: Subgroup analysis according to study design; C: Subgroup analysis according to the mean ages of the patients; D: Subgroup analysis according to the proportion of men of the included patients; E: Subgroup analysis according to the analytic models; F: Subgroup analysis according to the Newcastle–Ottawa Scale scores of the included studies. NOS: Newcastle–Ottawa Scale.
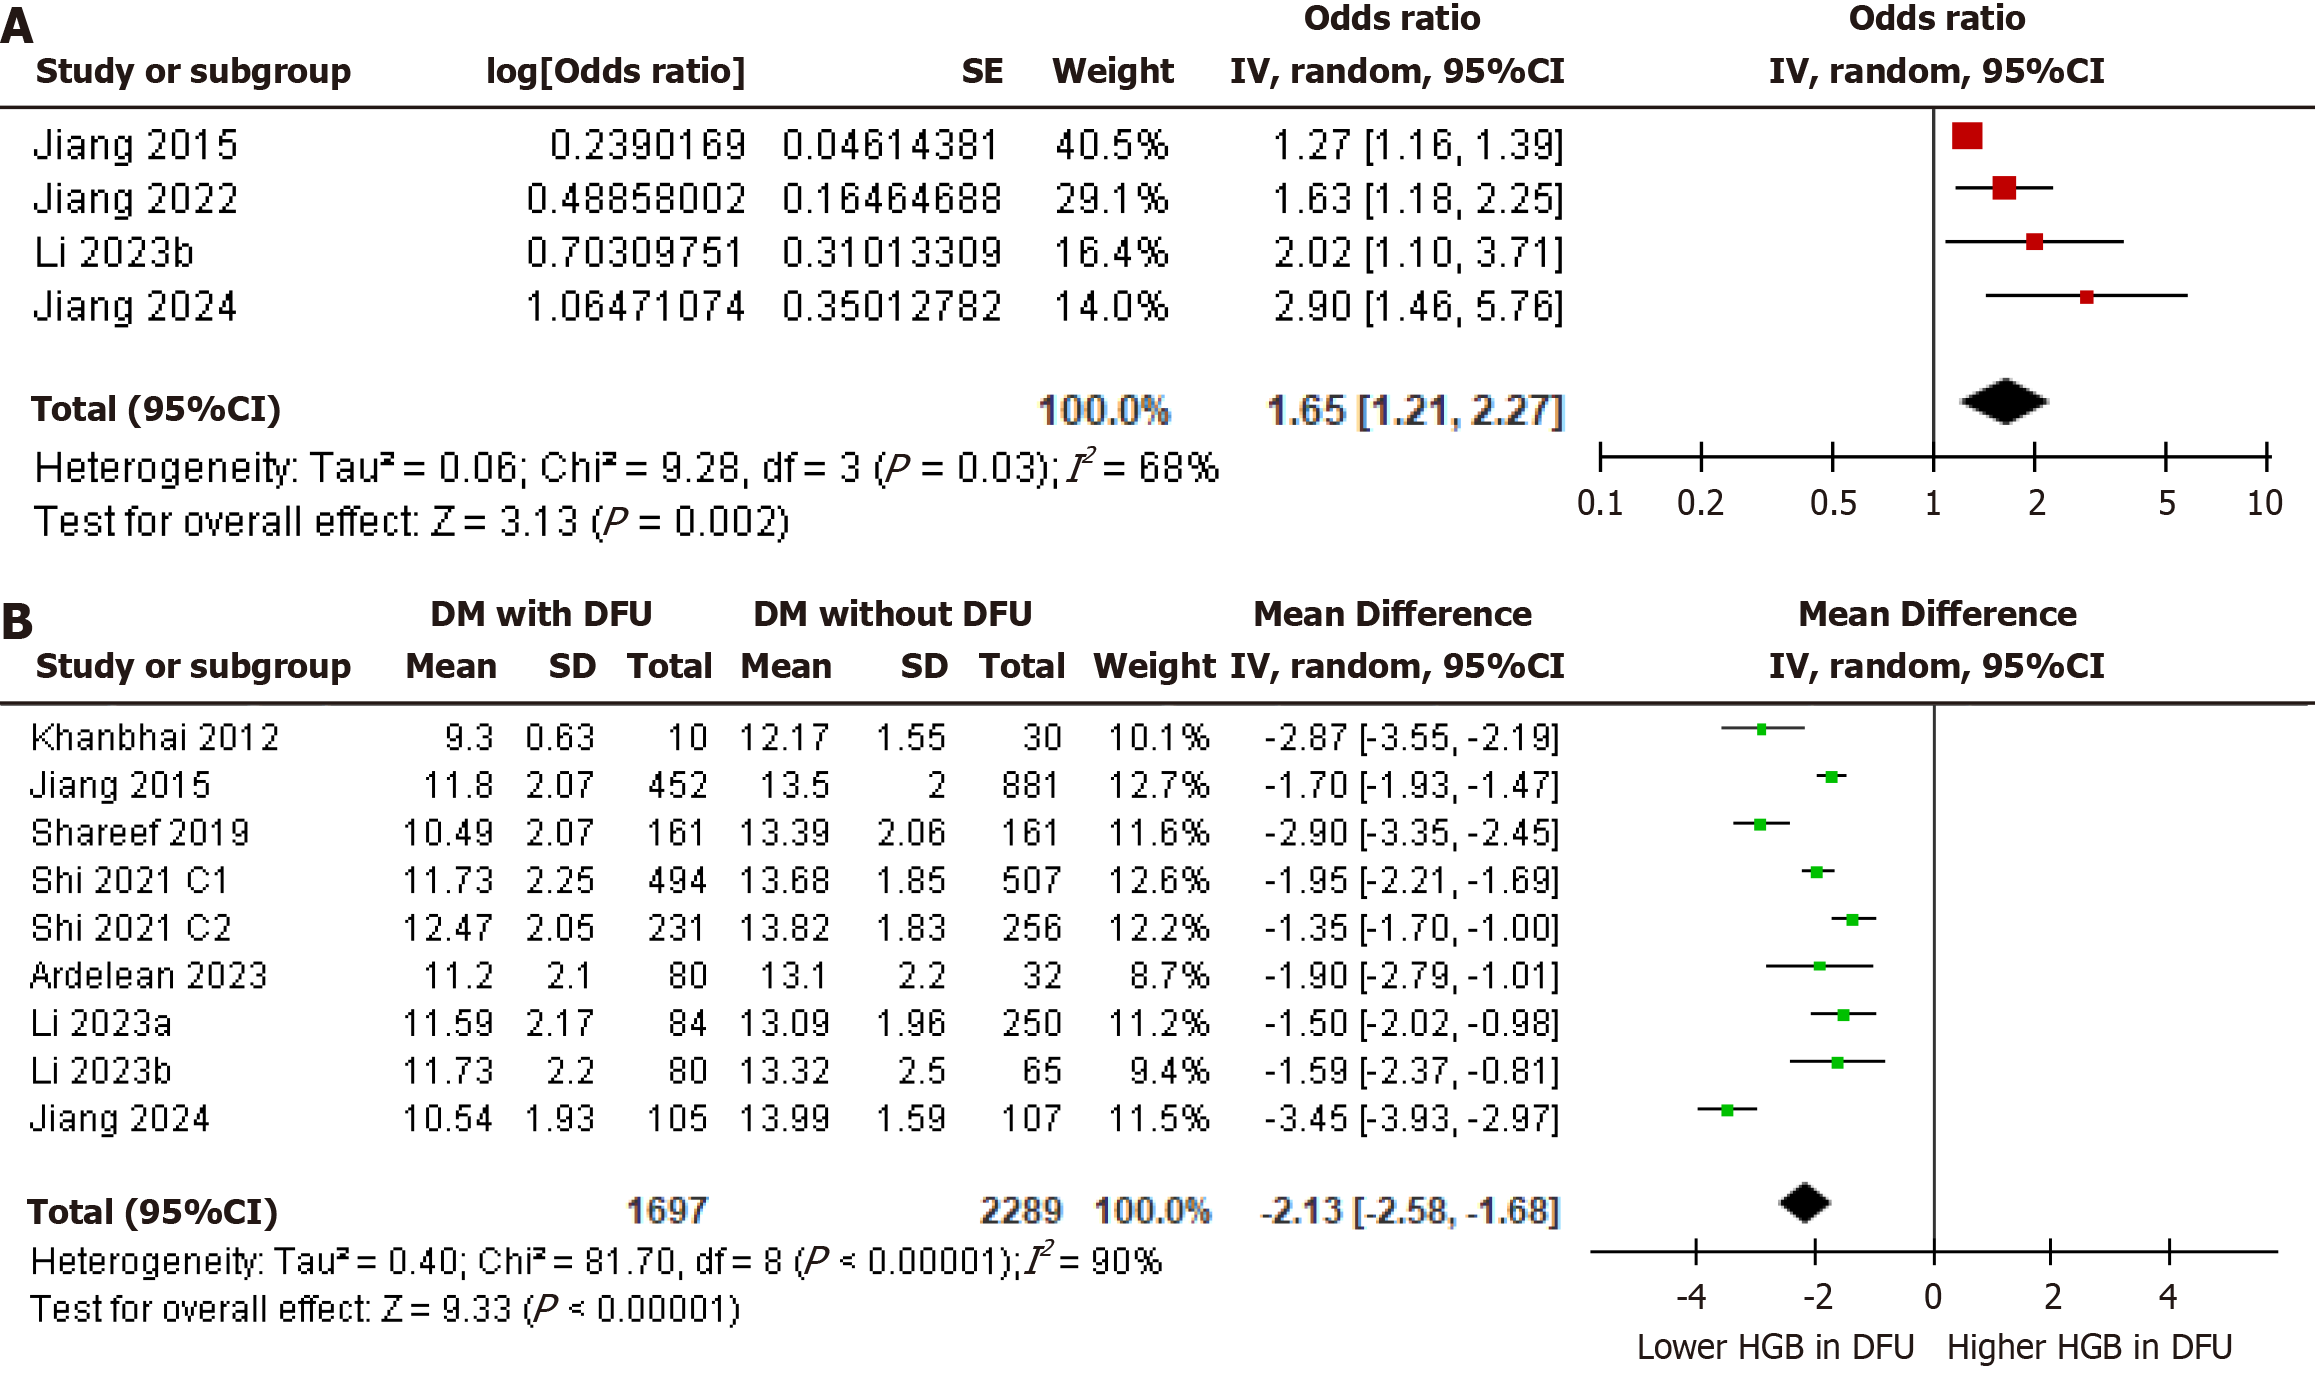
Figure 3 Forest plots for the meta-analysis of the secondary outcomes.
A: Meta-analysis for the risk of diabetic foot ulcers per 1-g/dL decrease of hemoglobin; B: Meta-analysis comparing serum hemoglobin between diabetic patients with and without diabetic foot ulcer. DFU: Diabetic foot ulcer; DM: Diabetes mellitus.
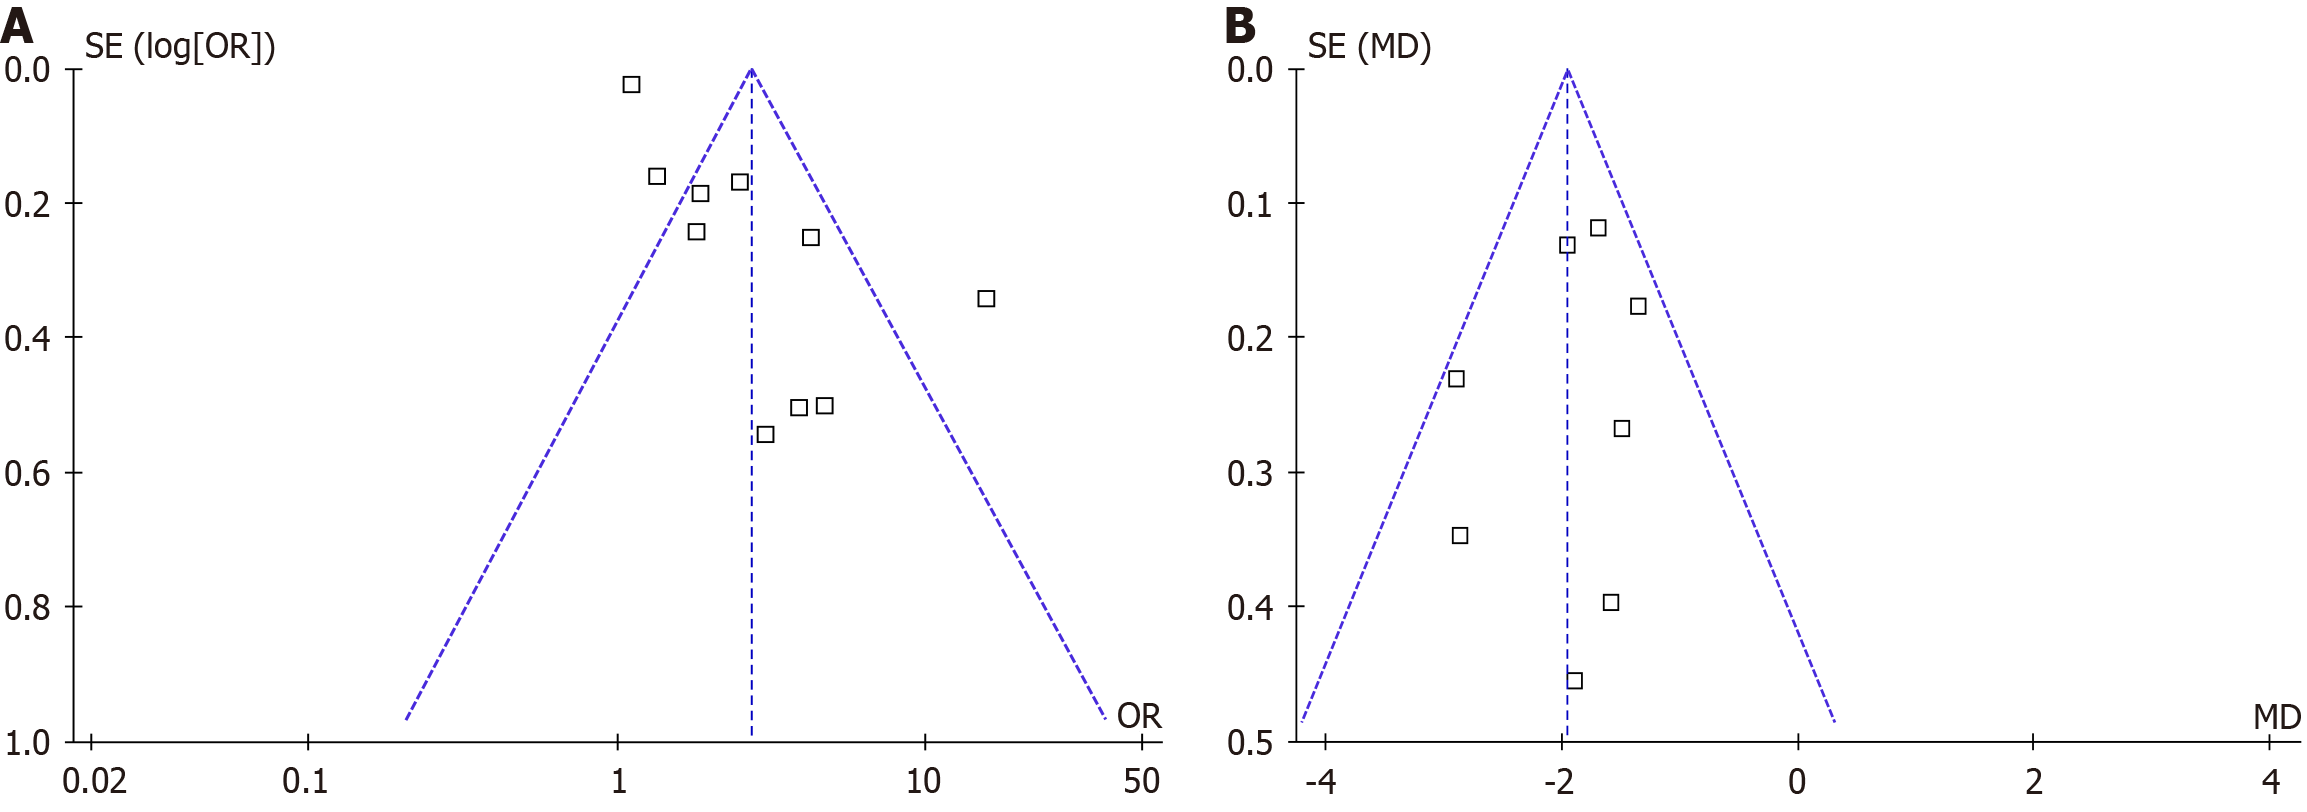
Figure 4 Funnel plots for estimating the potential publication biases underlying the meta-analyses.
A: Funnel plots for the meta-analysis of the association between anemia and the risk of diabetic foot ulcers in patients with diabetes; B: Funnel plots for the meta-analysis comparing serum hemoglobin between diabetic patients with and without diabetic foot ulcers. MD: Mean difference; OR: Odds ratio; SE: Standard error.
- Citation: Lin SS, Chen CR, Xu WC, Fu J, Xu JQ, Liang ZH. Association between anemia and the risk of diabetic foot ulcer: A meta-analysis. World J Diabetes 2025; 16(6): 105155
- URL: https://www.wjgnet.com/1948-9358/full/v16/i6/105155.htm
- DOI: https://dx.doi.org/10.4239/wjd.v16.i6.105155


