Copyright
©The Author(s) 2025.
World J Diabetes. Jun 15, 2025; 16(6): 104973
Published online Jun 15, 2025. doi: 10.4239/wjd.v16.i6.104973
Published online Jun 15, 2025. doi: 10.4239/wjd.v16.i6.104973
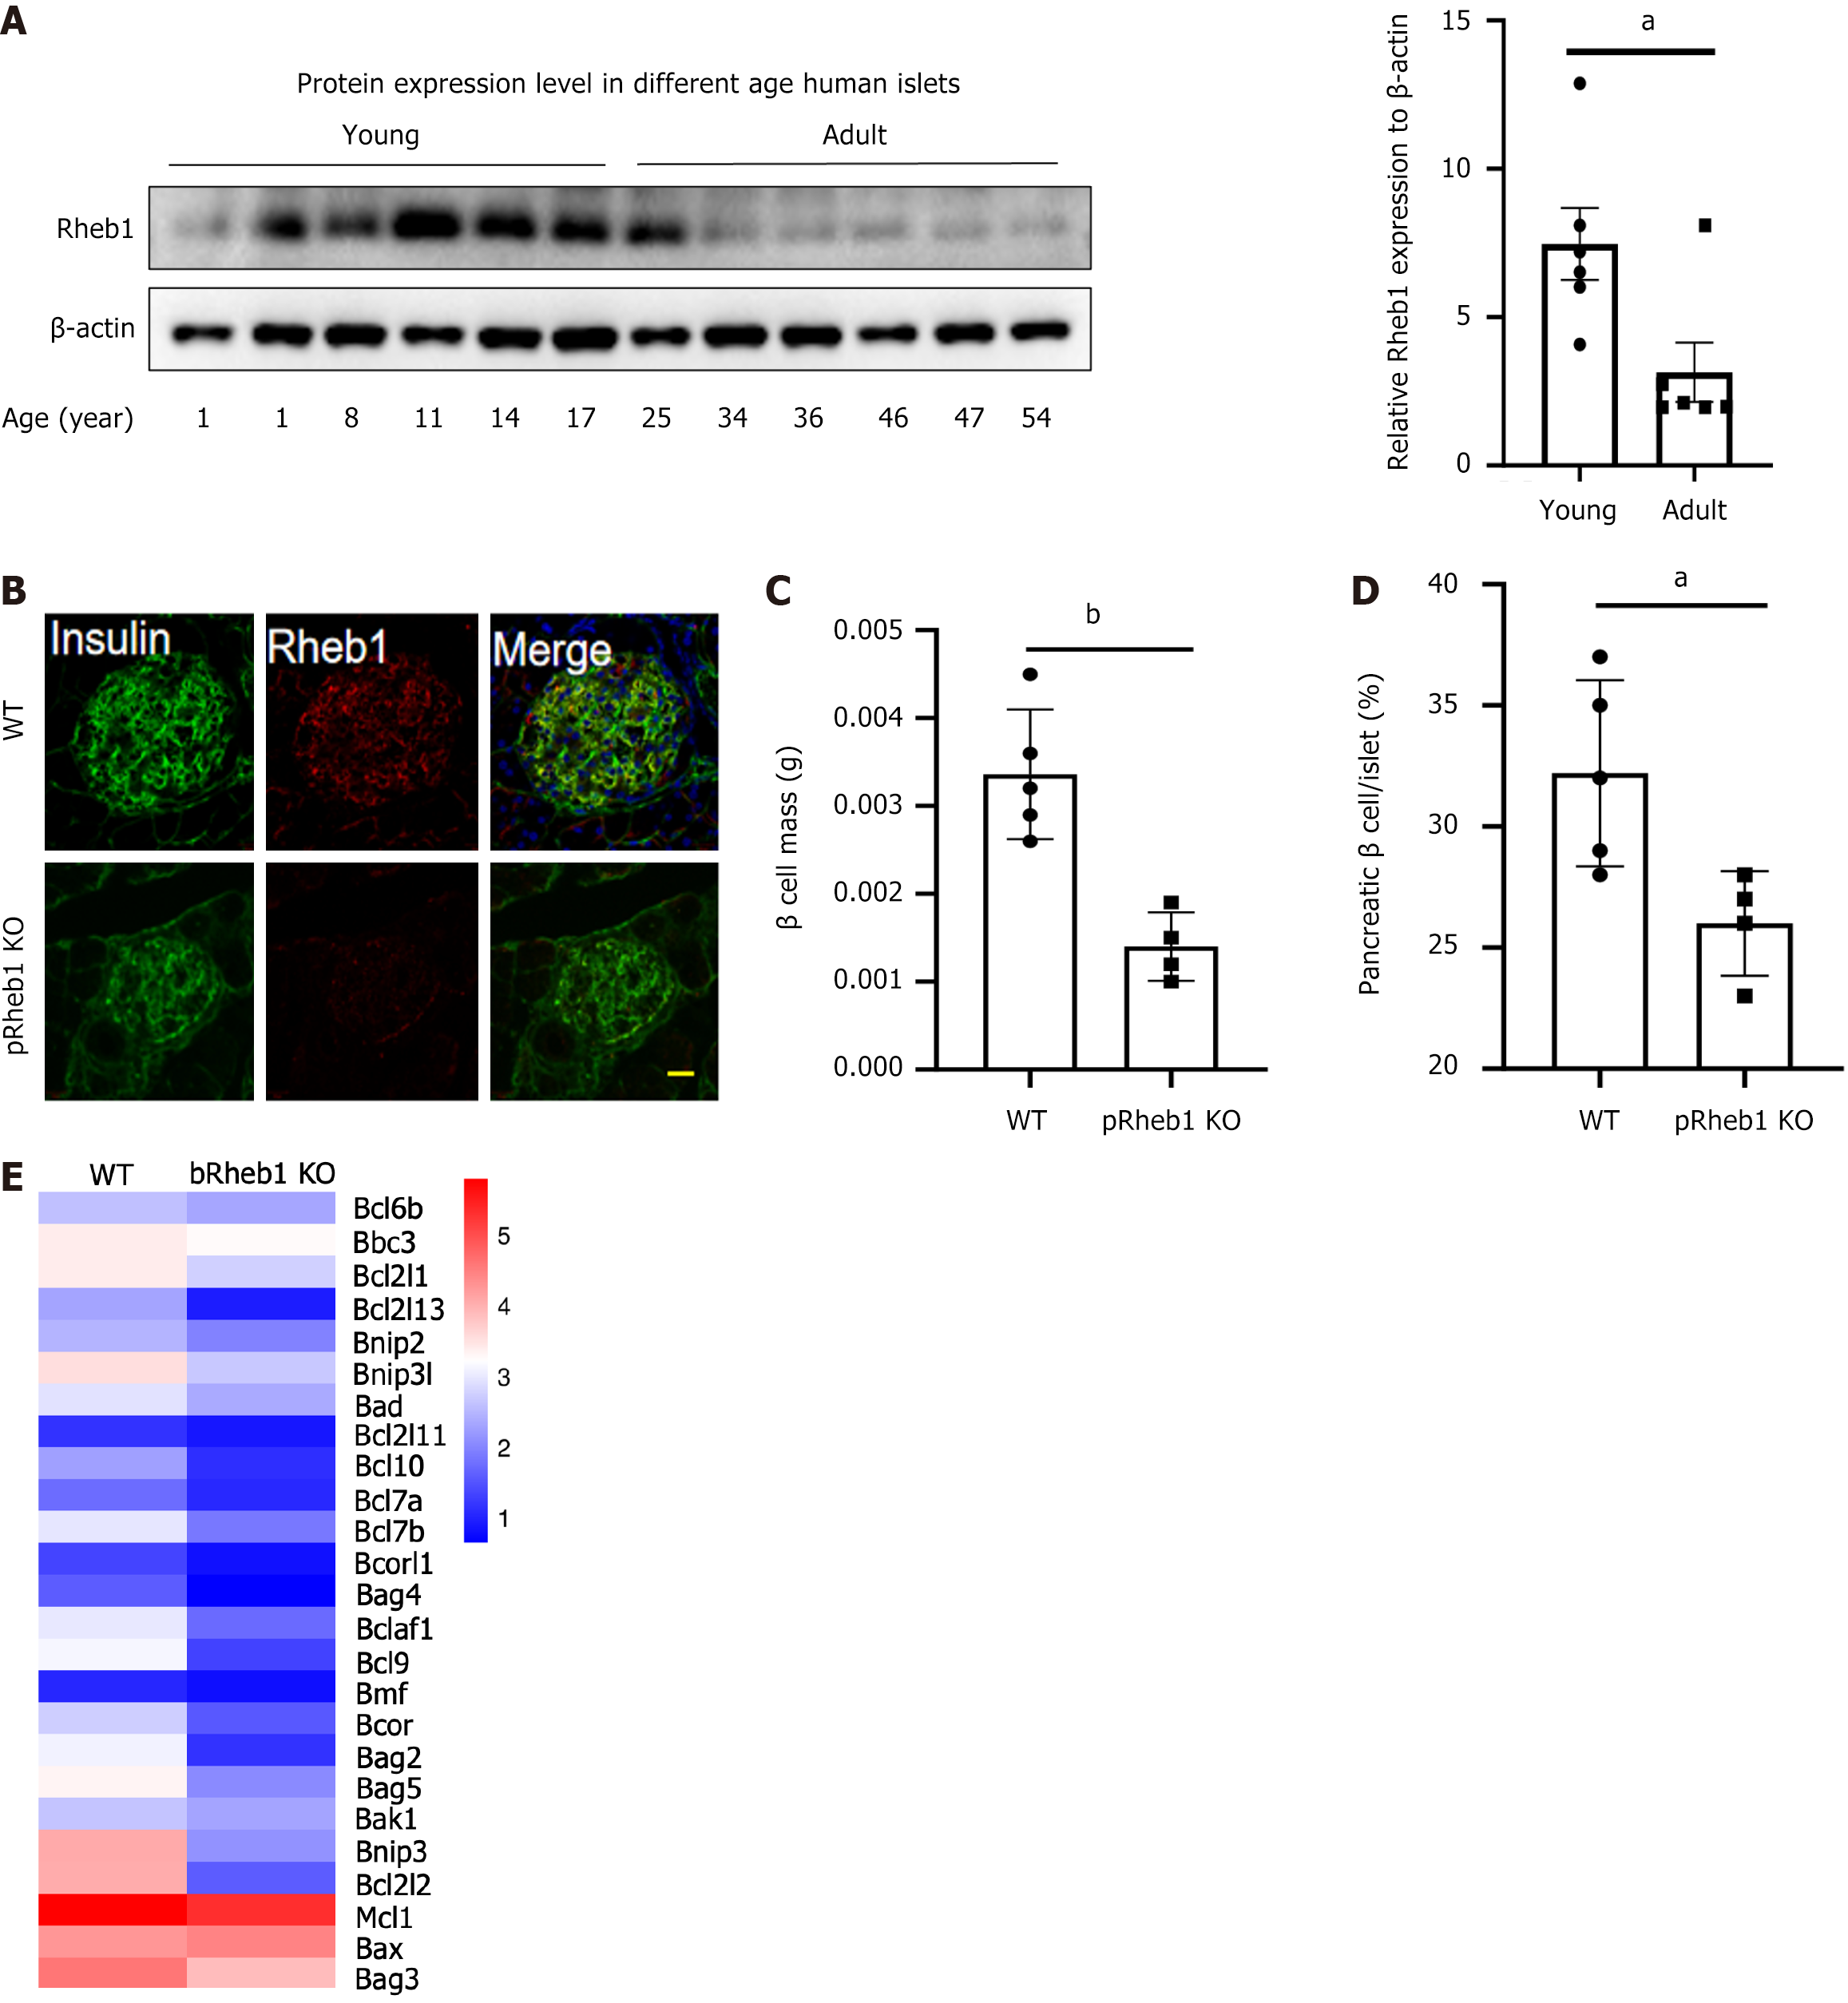
Figure 1 Rheb1 upregulates β cell mass and mTORC1 signaling.
A: Rheb1 expression in the islets isolated from people with different age; B: Immunofluorescence staining of Rheb1 (red) and insulin (as a β-cell marker; green) in pancreatic sections of 8-week-old male pRheb1KO mice (n = 3) and wild-type (WT) mice (n = 3). Scale bars: 10 μm; C and D: Average β-cell mass and β-cell size in pancreatic sections of 2-month-old male pRheb1KO (n = 4) and WT mice (n = 5) subjected to insulin staining; E: Anti-apoptotic genes from RNA-seq of islets of bRheb1KO mice (n = 3) and WT mice (n = 3), of which is reanalyzed from our previous RNA-seq data[3]. All data are represented as the mean ± SD, aP < 0.05, bP < 0.01. WT: Wild-type.
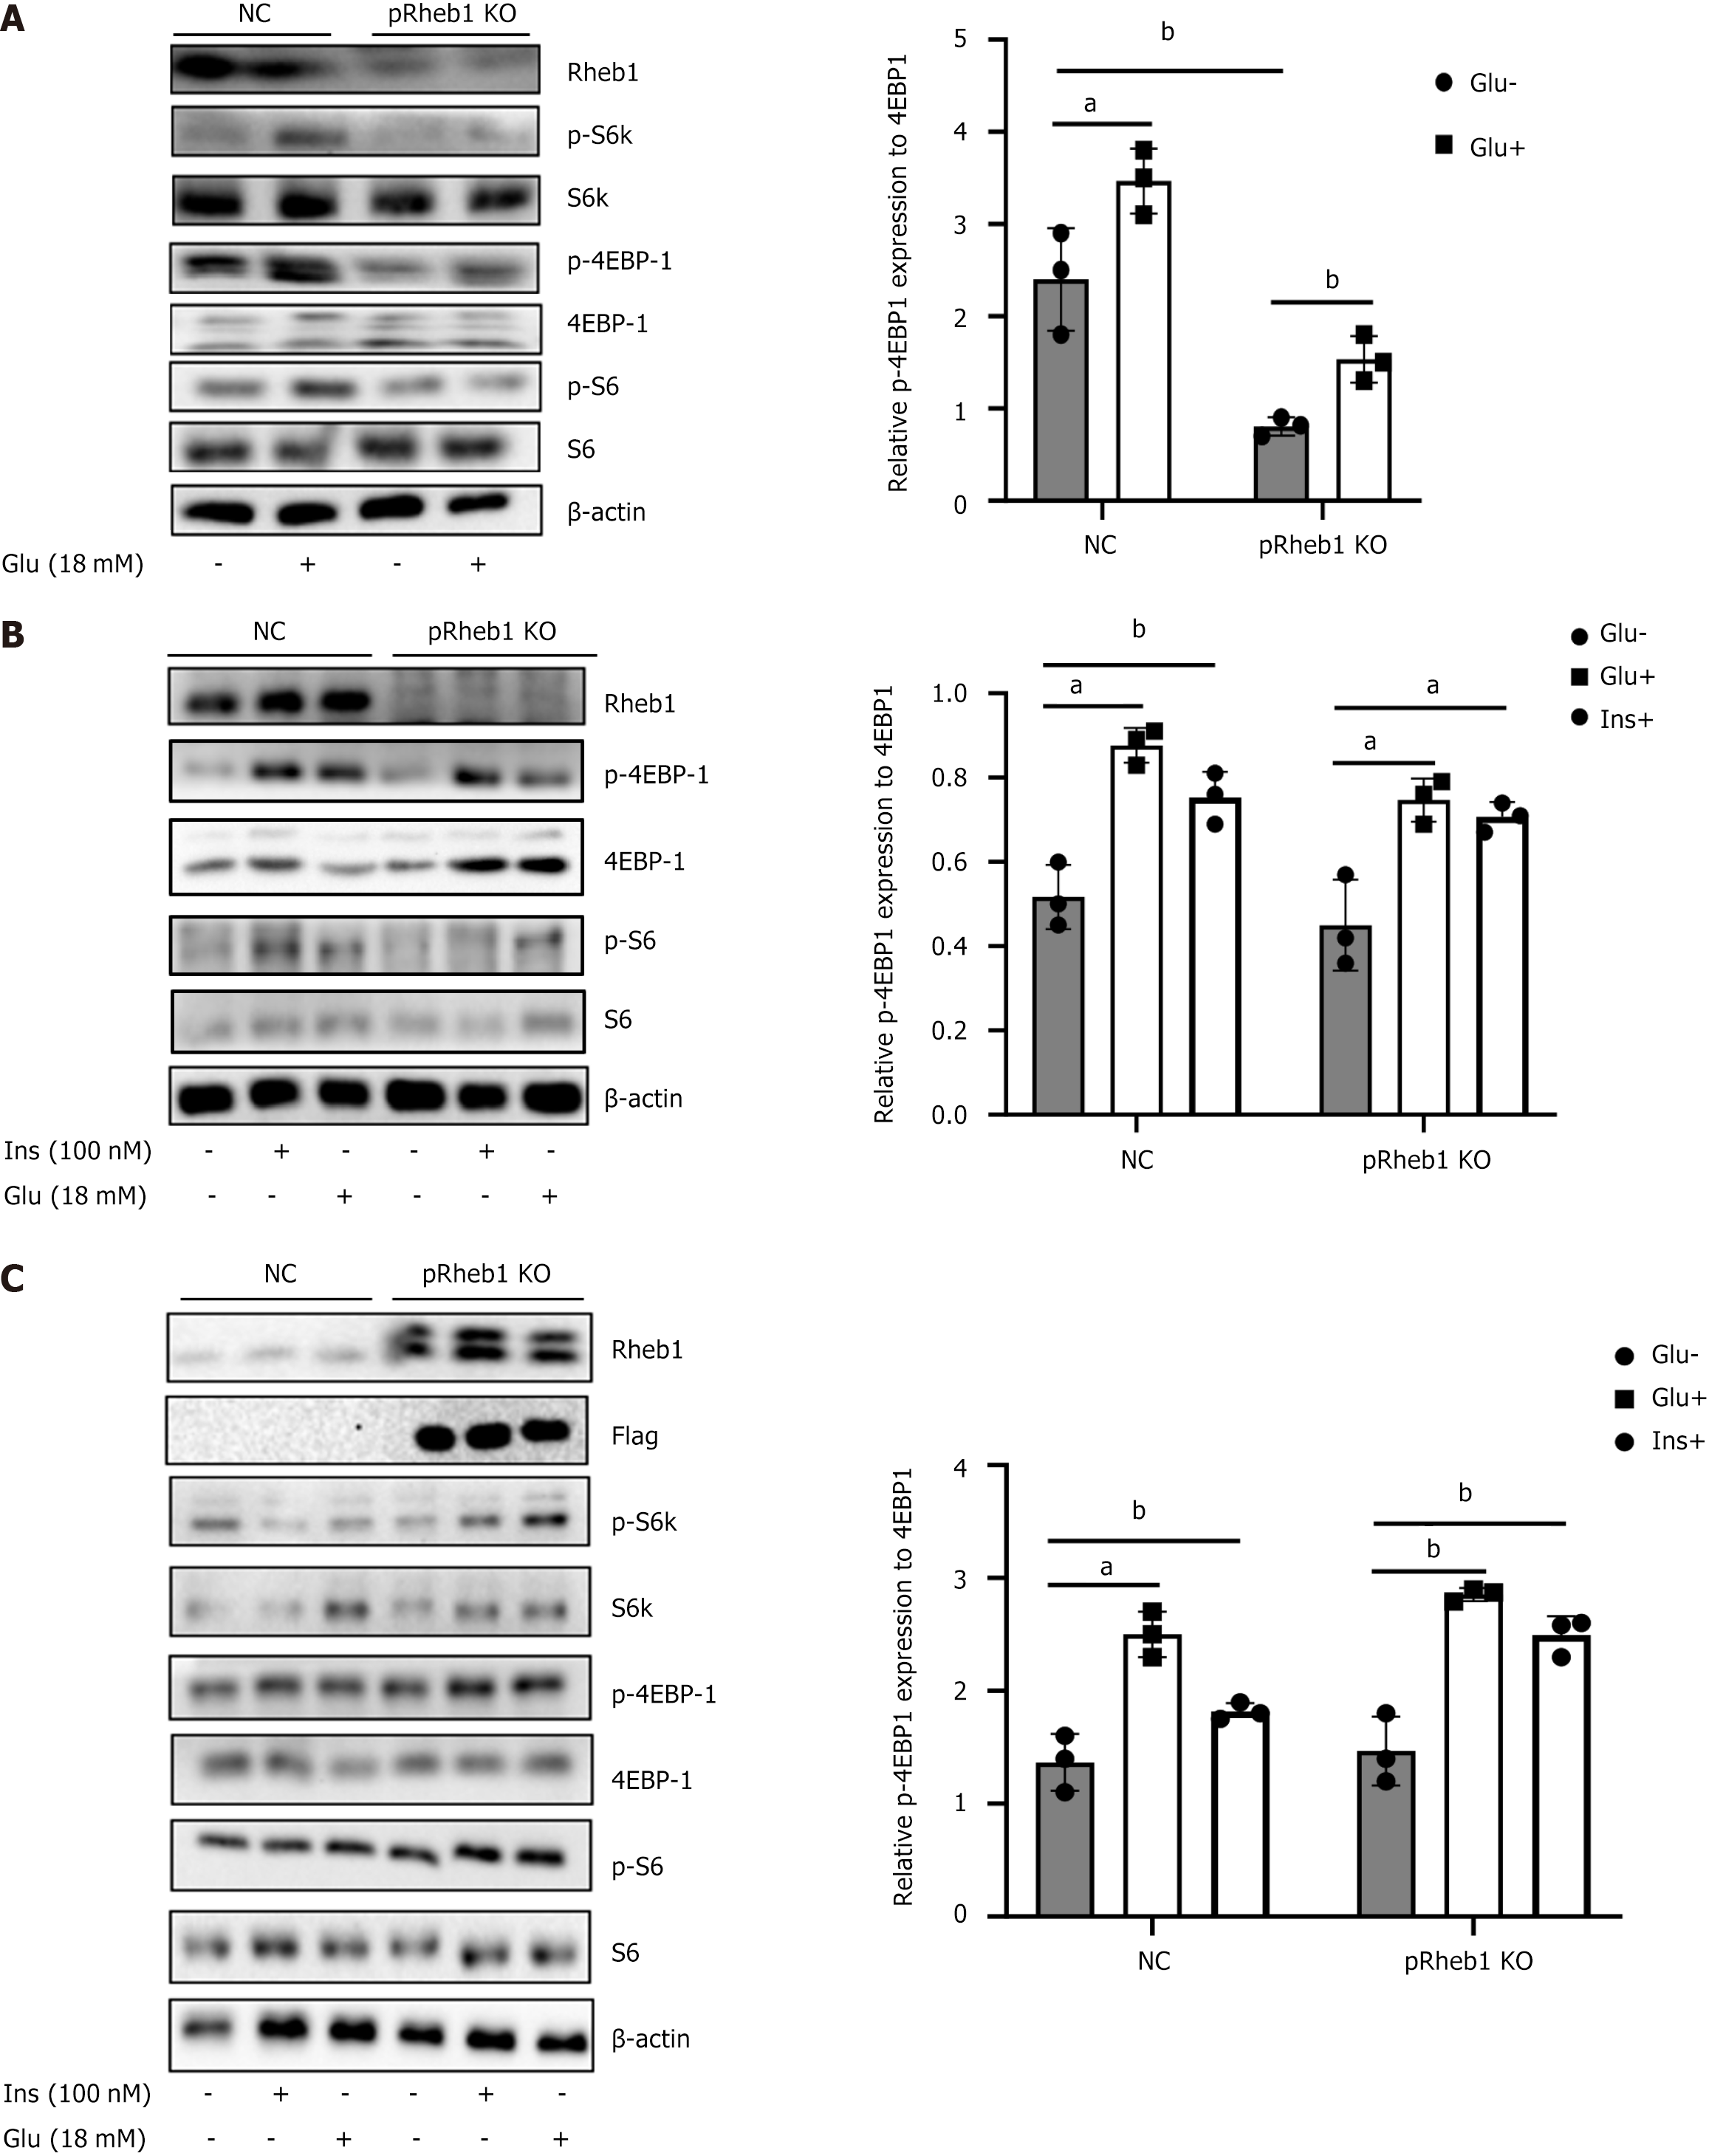
Figure 2 Rheb1 activates mTORC1 signaling in islets.
A: The expression of mTORC1 signaling and its downstream in the islets isolated from pRheb1KO (n = 2) and Flox (n = 2) with or without glucose stimulation; B: The expression of mTOC1 signaling and its downstream in the islets isolated from pRheb1KO (n = 3) and Flox (n = 3) with or without glucose and insulin stimulation; C: Western blot analysis of C57 islets treated with GFP (n = 3) or Rheb1OE (n = 3) adenovirus for 48 hours with or without glucose and insulin stimulation. All data are represented as the mean ± SD, aP < 0.05, bP < 0.01. NC: Negative control.
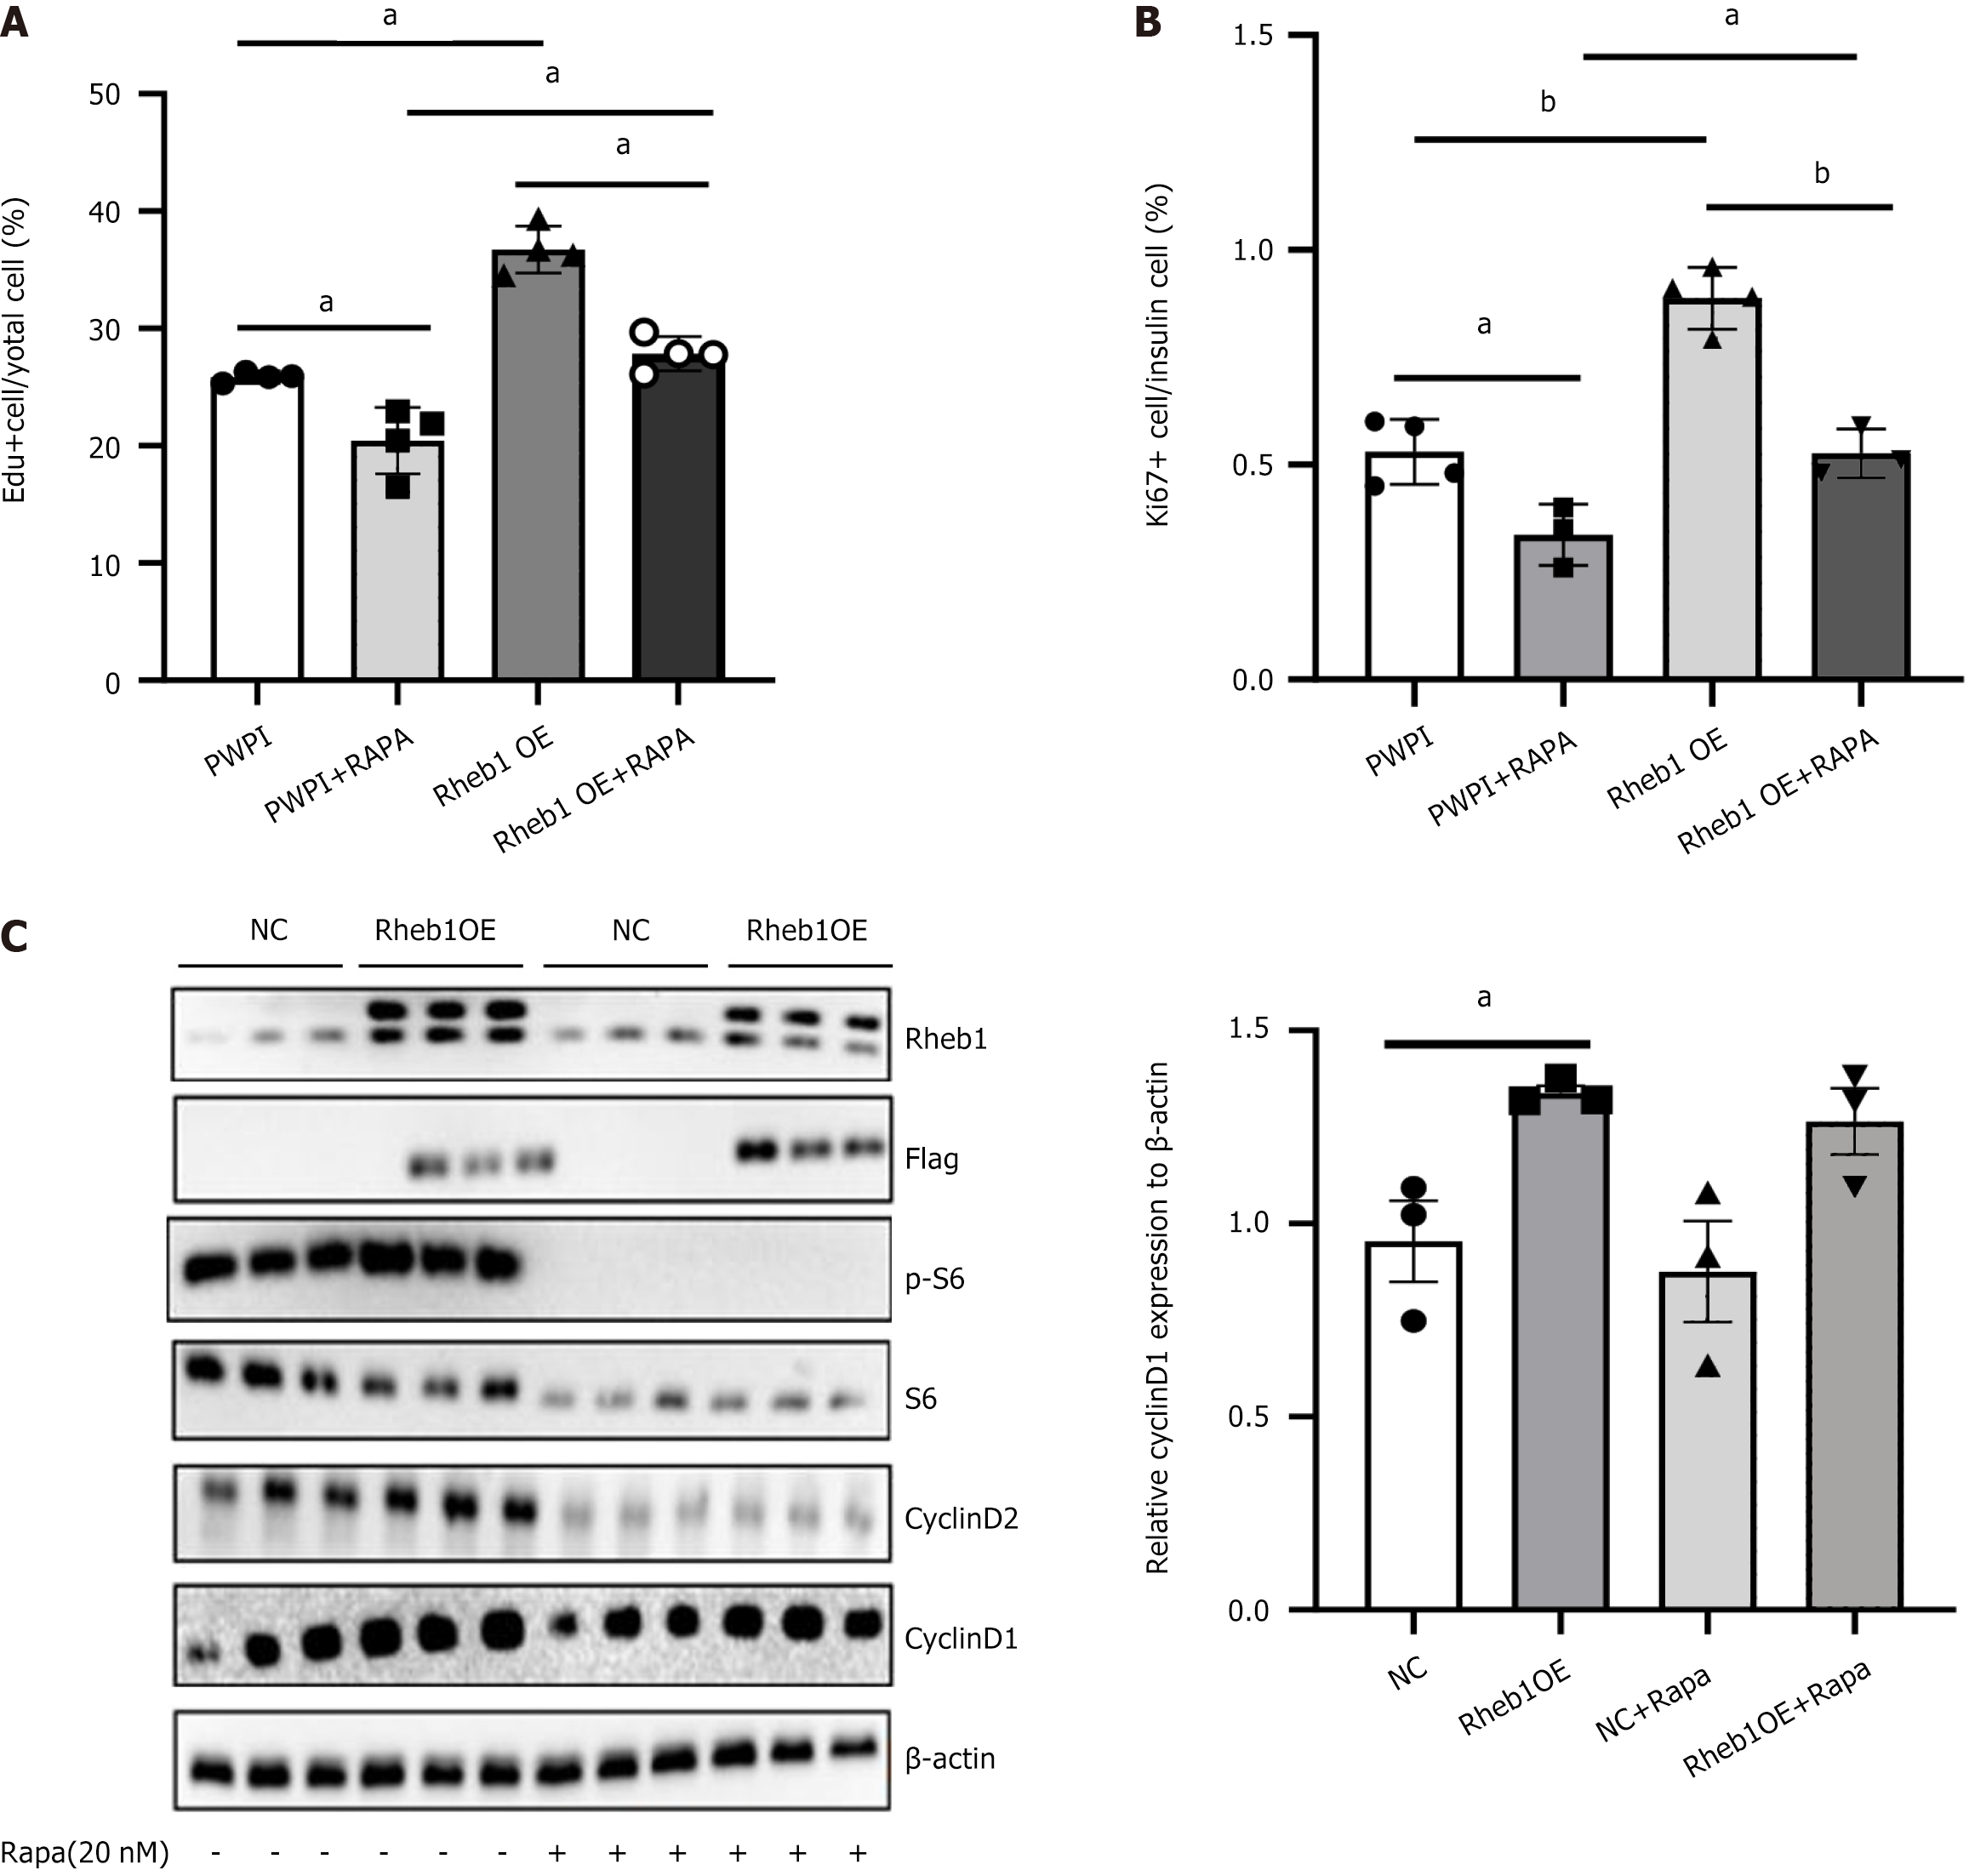
Figure 3 Rheb1 promotes β cell proliferation only partly depend on the mTORC1.
A: The population of 5-ethy-nyl-2’-deoxyuridine + cells of MIN6 cells treated with PWPI or Rheb1OE lentivirus with or without rapamycin treatment; B: The population of Ki67+ cells of insulin+ islet treated with GFP or Rheb1OE adenovirus with or without rapamycin treatment; C: Western blot analysis of C57 mice islets treated with GFP or Rheb1OE adenovirus for 48 hours with or without rapamycin treatment (n = 3/group). All data are represented as the mean ± SD, aP < 0.05, bP < 0.001. NC: Negative control; Edu: 5-ethy-nyl-2’-deoxyuridine.
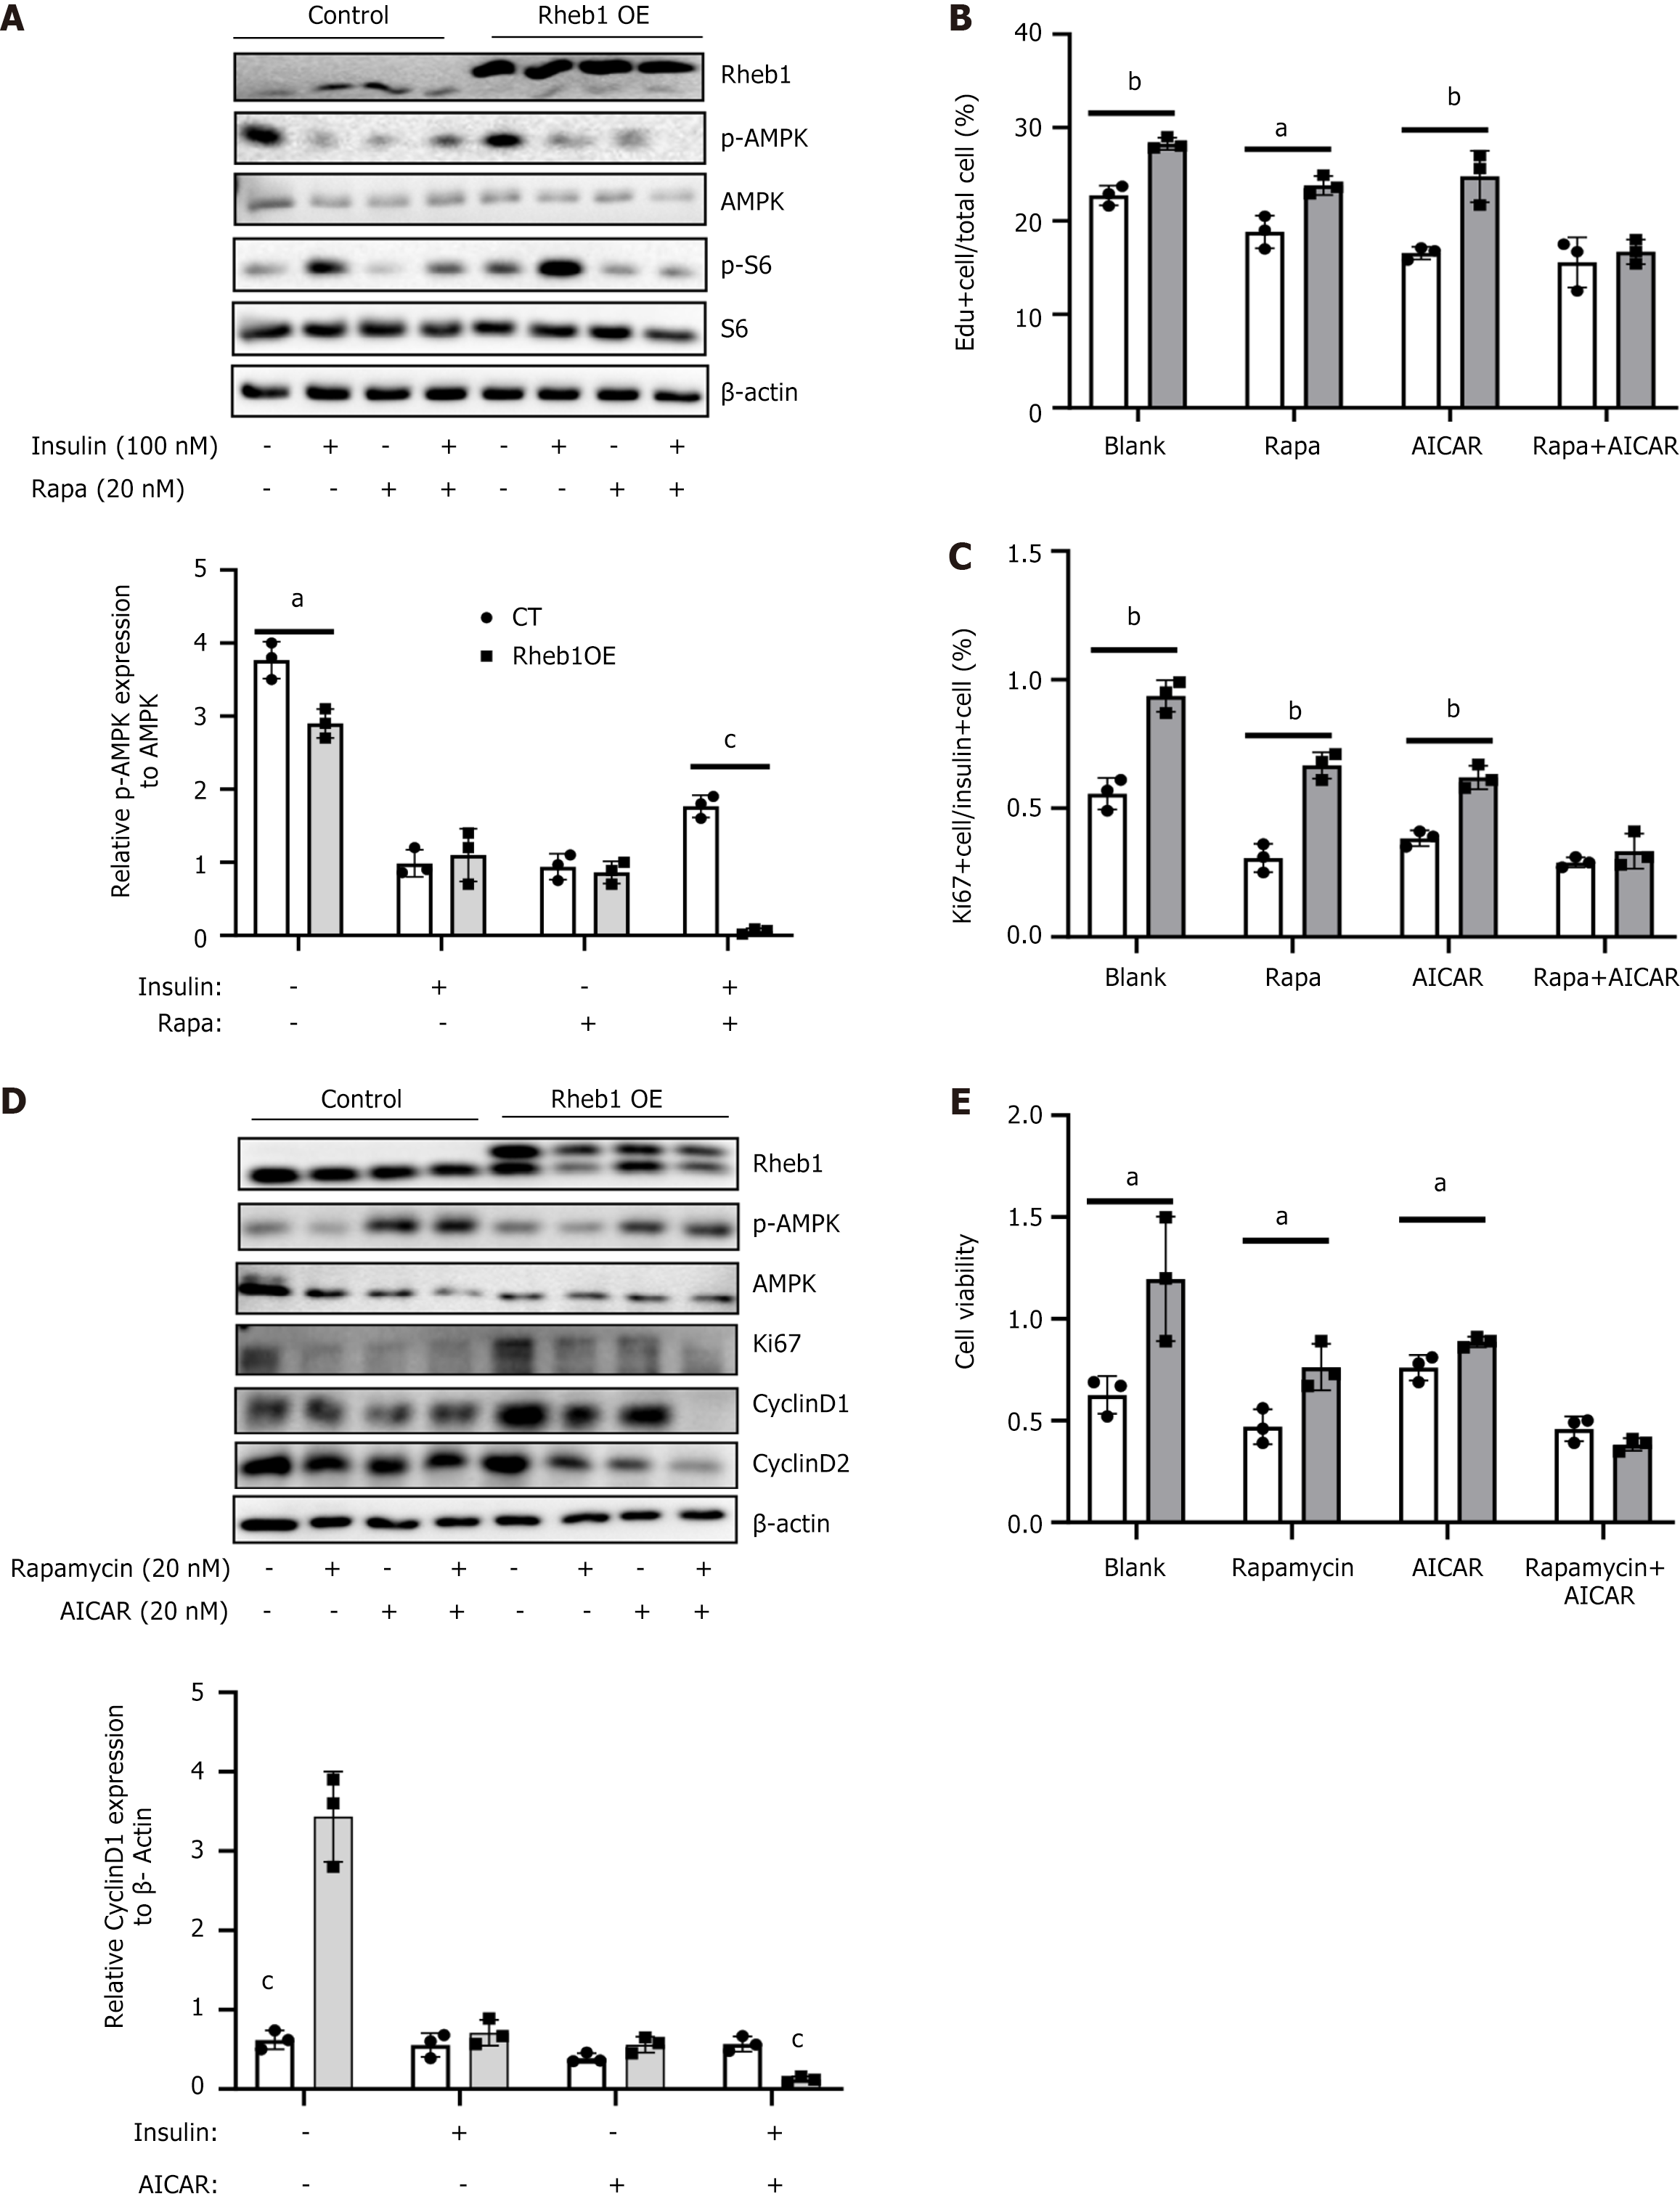
Figure 4 Rheb1 regulates β cell proliferation via mTORC1 and AMPK signaling simultaneously.
A: The expression of AMPK signaling and its downstream in the MIN6 cell treated with GFP or Rheb1OE adenovirus for 48 hours with or without rapamycin treatment; B: The population of 5-ethy-nyl-2’-deoxyuridine + cells of MIN6 cell treated with GFP or Rheb1OE adenovirus for 48 hours with or without rapamycin and AICAR treatment; C: The population of Ki67+ cells of insulin+ islet treated with GFP or Rheb1OE adenovirus with or without rapamycin and AICAR treatment; D: Western blot analysis of MIN6 cell treated with GFP or Rheb1OE adenovirus for 48 hours with or without rapamycin and AICAR treatment; E: Cell vitality analysis of MIN6 cell treated with GFP or Rheb1OE adenovirus for 48 hours with or without rapamycin and AICAR treatment. All data are represented as the mean ± SD, aP < 0.05, bP < 0.01, cP < 0.001.
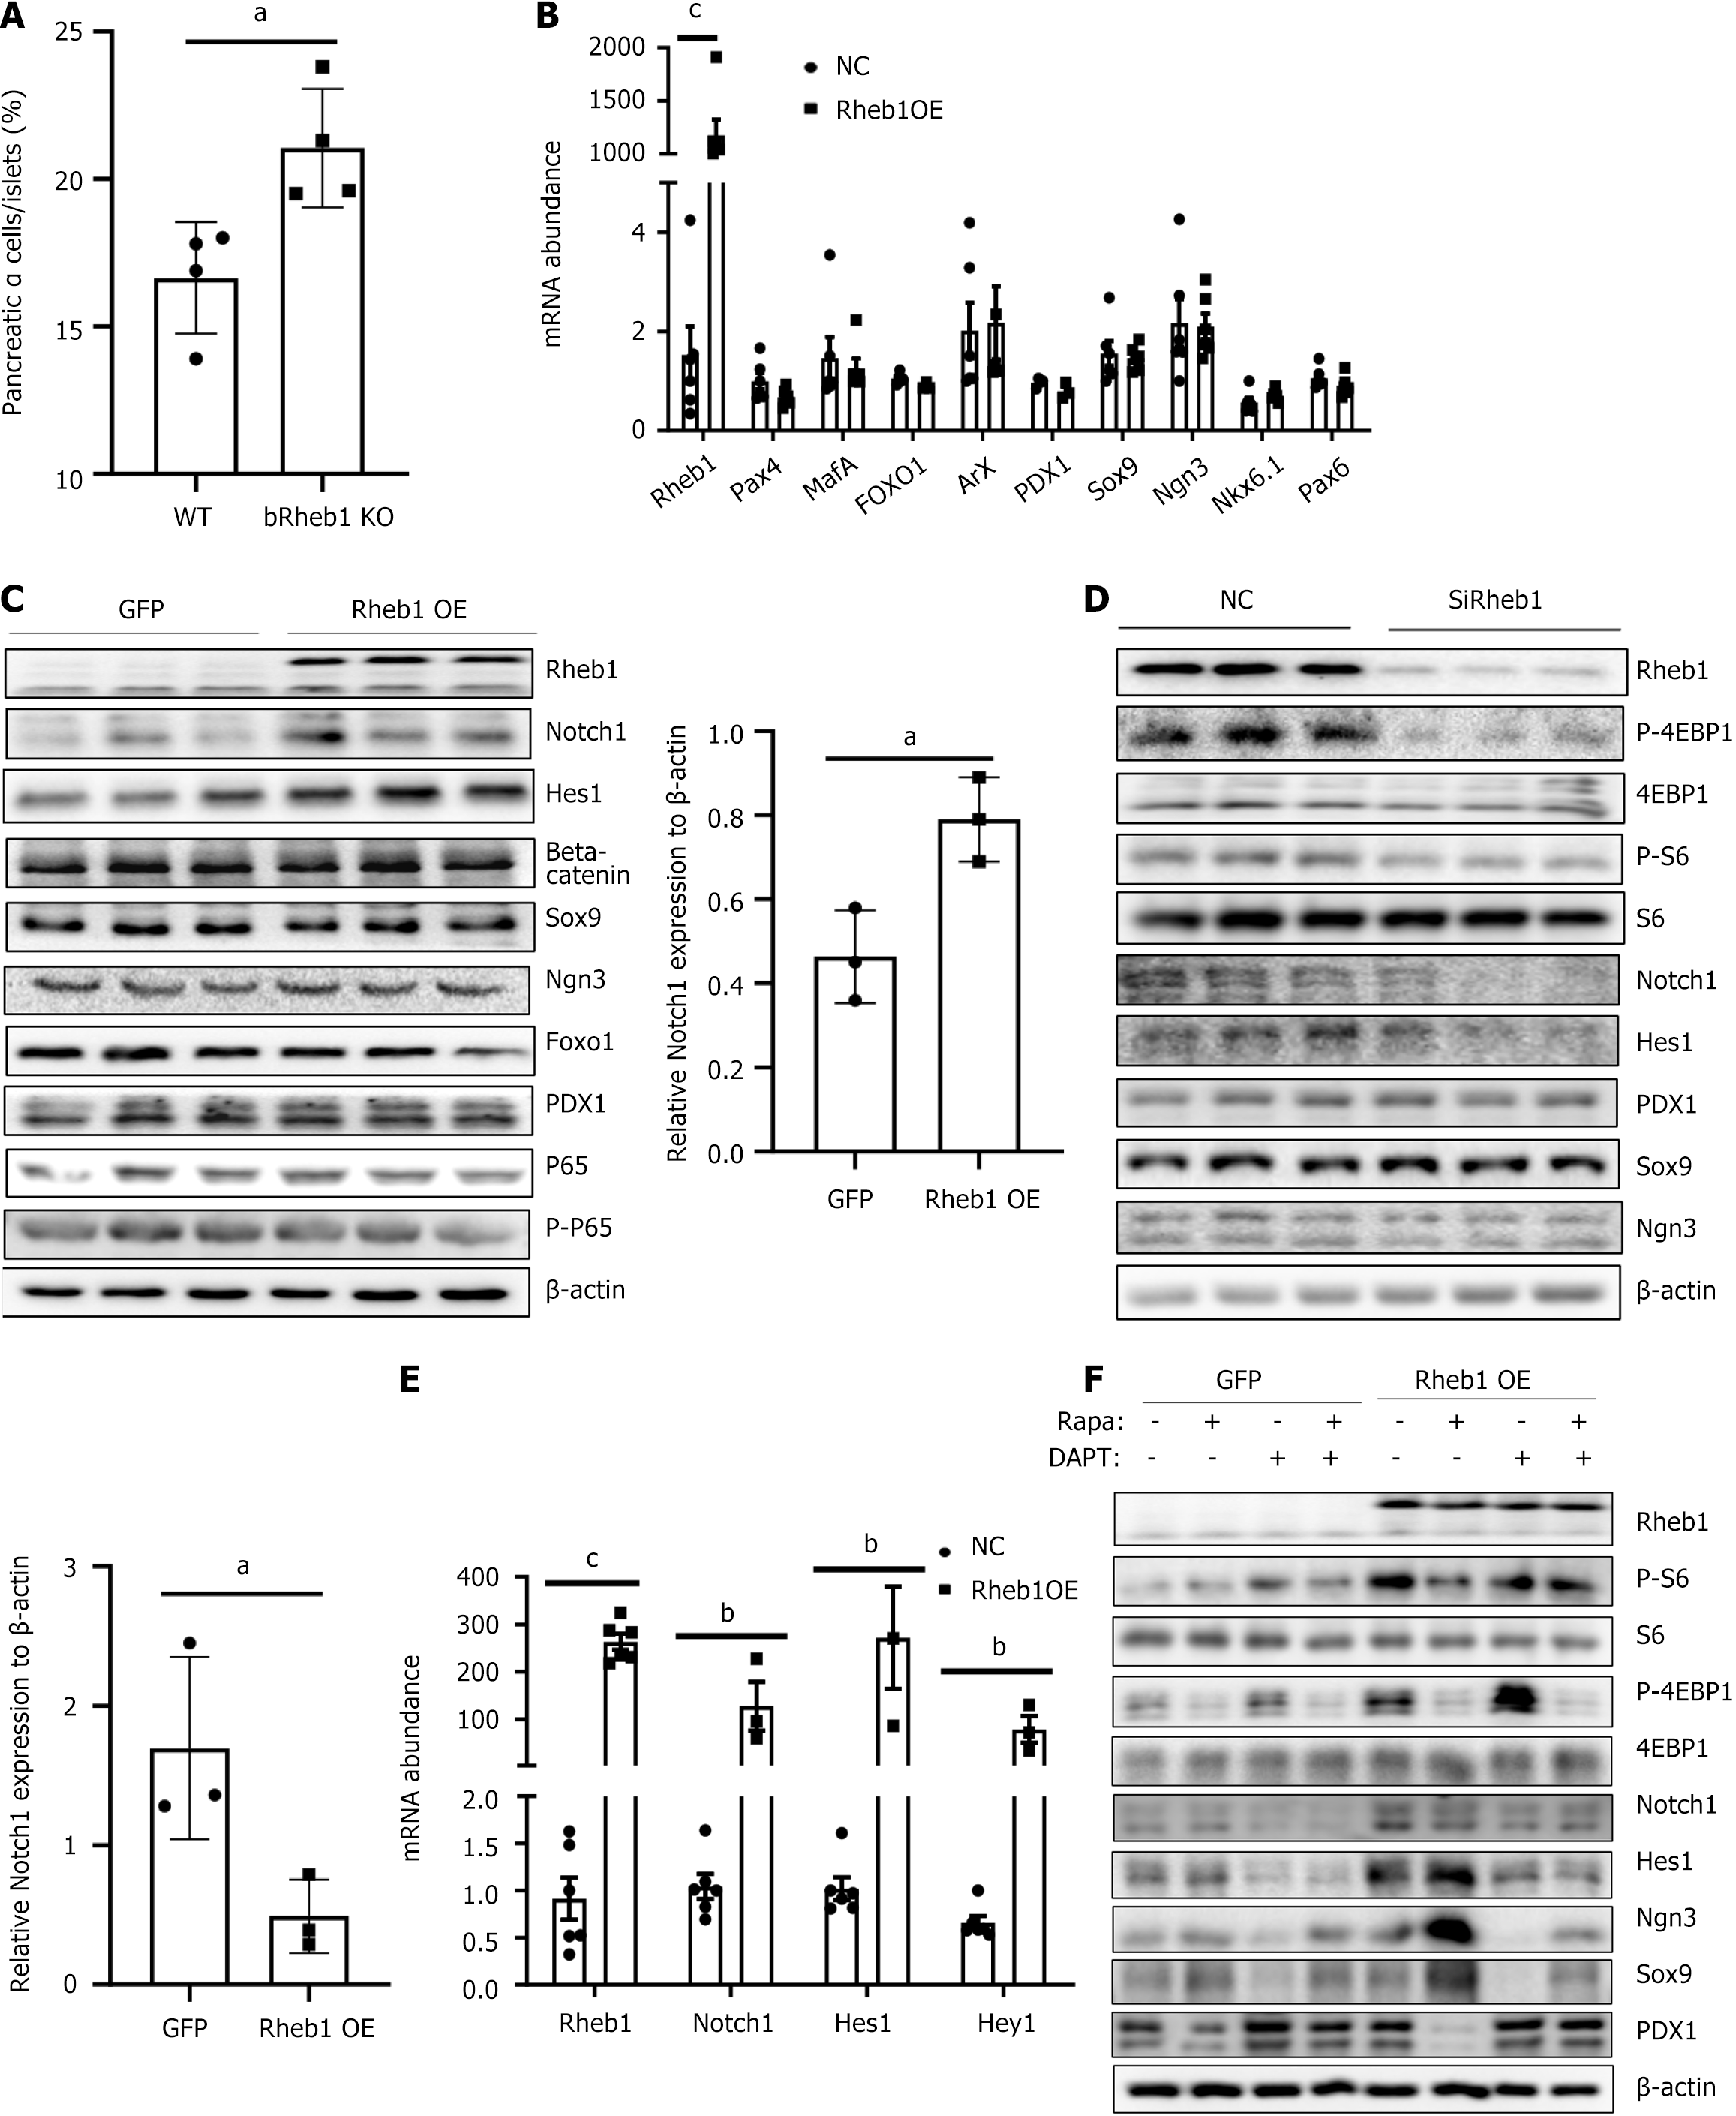
Figure 5 Rheb1 keeps β-cell identity balance through mTORC1 and Notch1 signaling.
A: Average α-cell proportion in pancreatic sections of 2-month-old male bRheb1KO and WT mice subjected to glucagon staining (n = 4/group); B and C: The mRNA (B) and protein (C) levels of β-cell dedifferentiation related markers in MIN6 cell infected with GFP or Rheb1 adenovirus; D: Western blot analysis of MIN6 cell treated with a Rheb1-specific siRNA or a siRNA control for 48 hours; E: The mRNA levels of Notch pathway in MIN6 cells infected with GFP or Rheb1OE adenovirus for 48 hours; F: Western blot analysis of MIN6 cell infected with GFP or Rheb1OE adenovirus, treated with different levels of rapamycin and DAPT. All data are represented as the mean ± SD, aP < 0.05, bP < 0.01, cP < 0.001. NC: Negative control; WT: Wild-type.
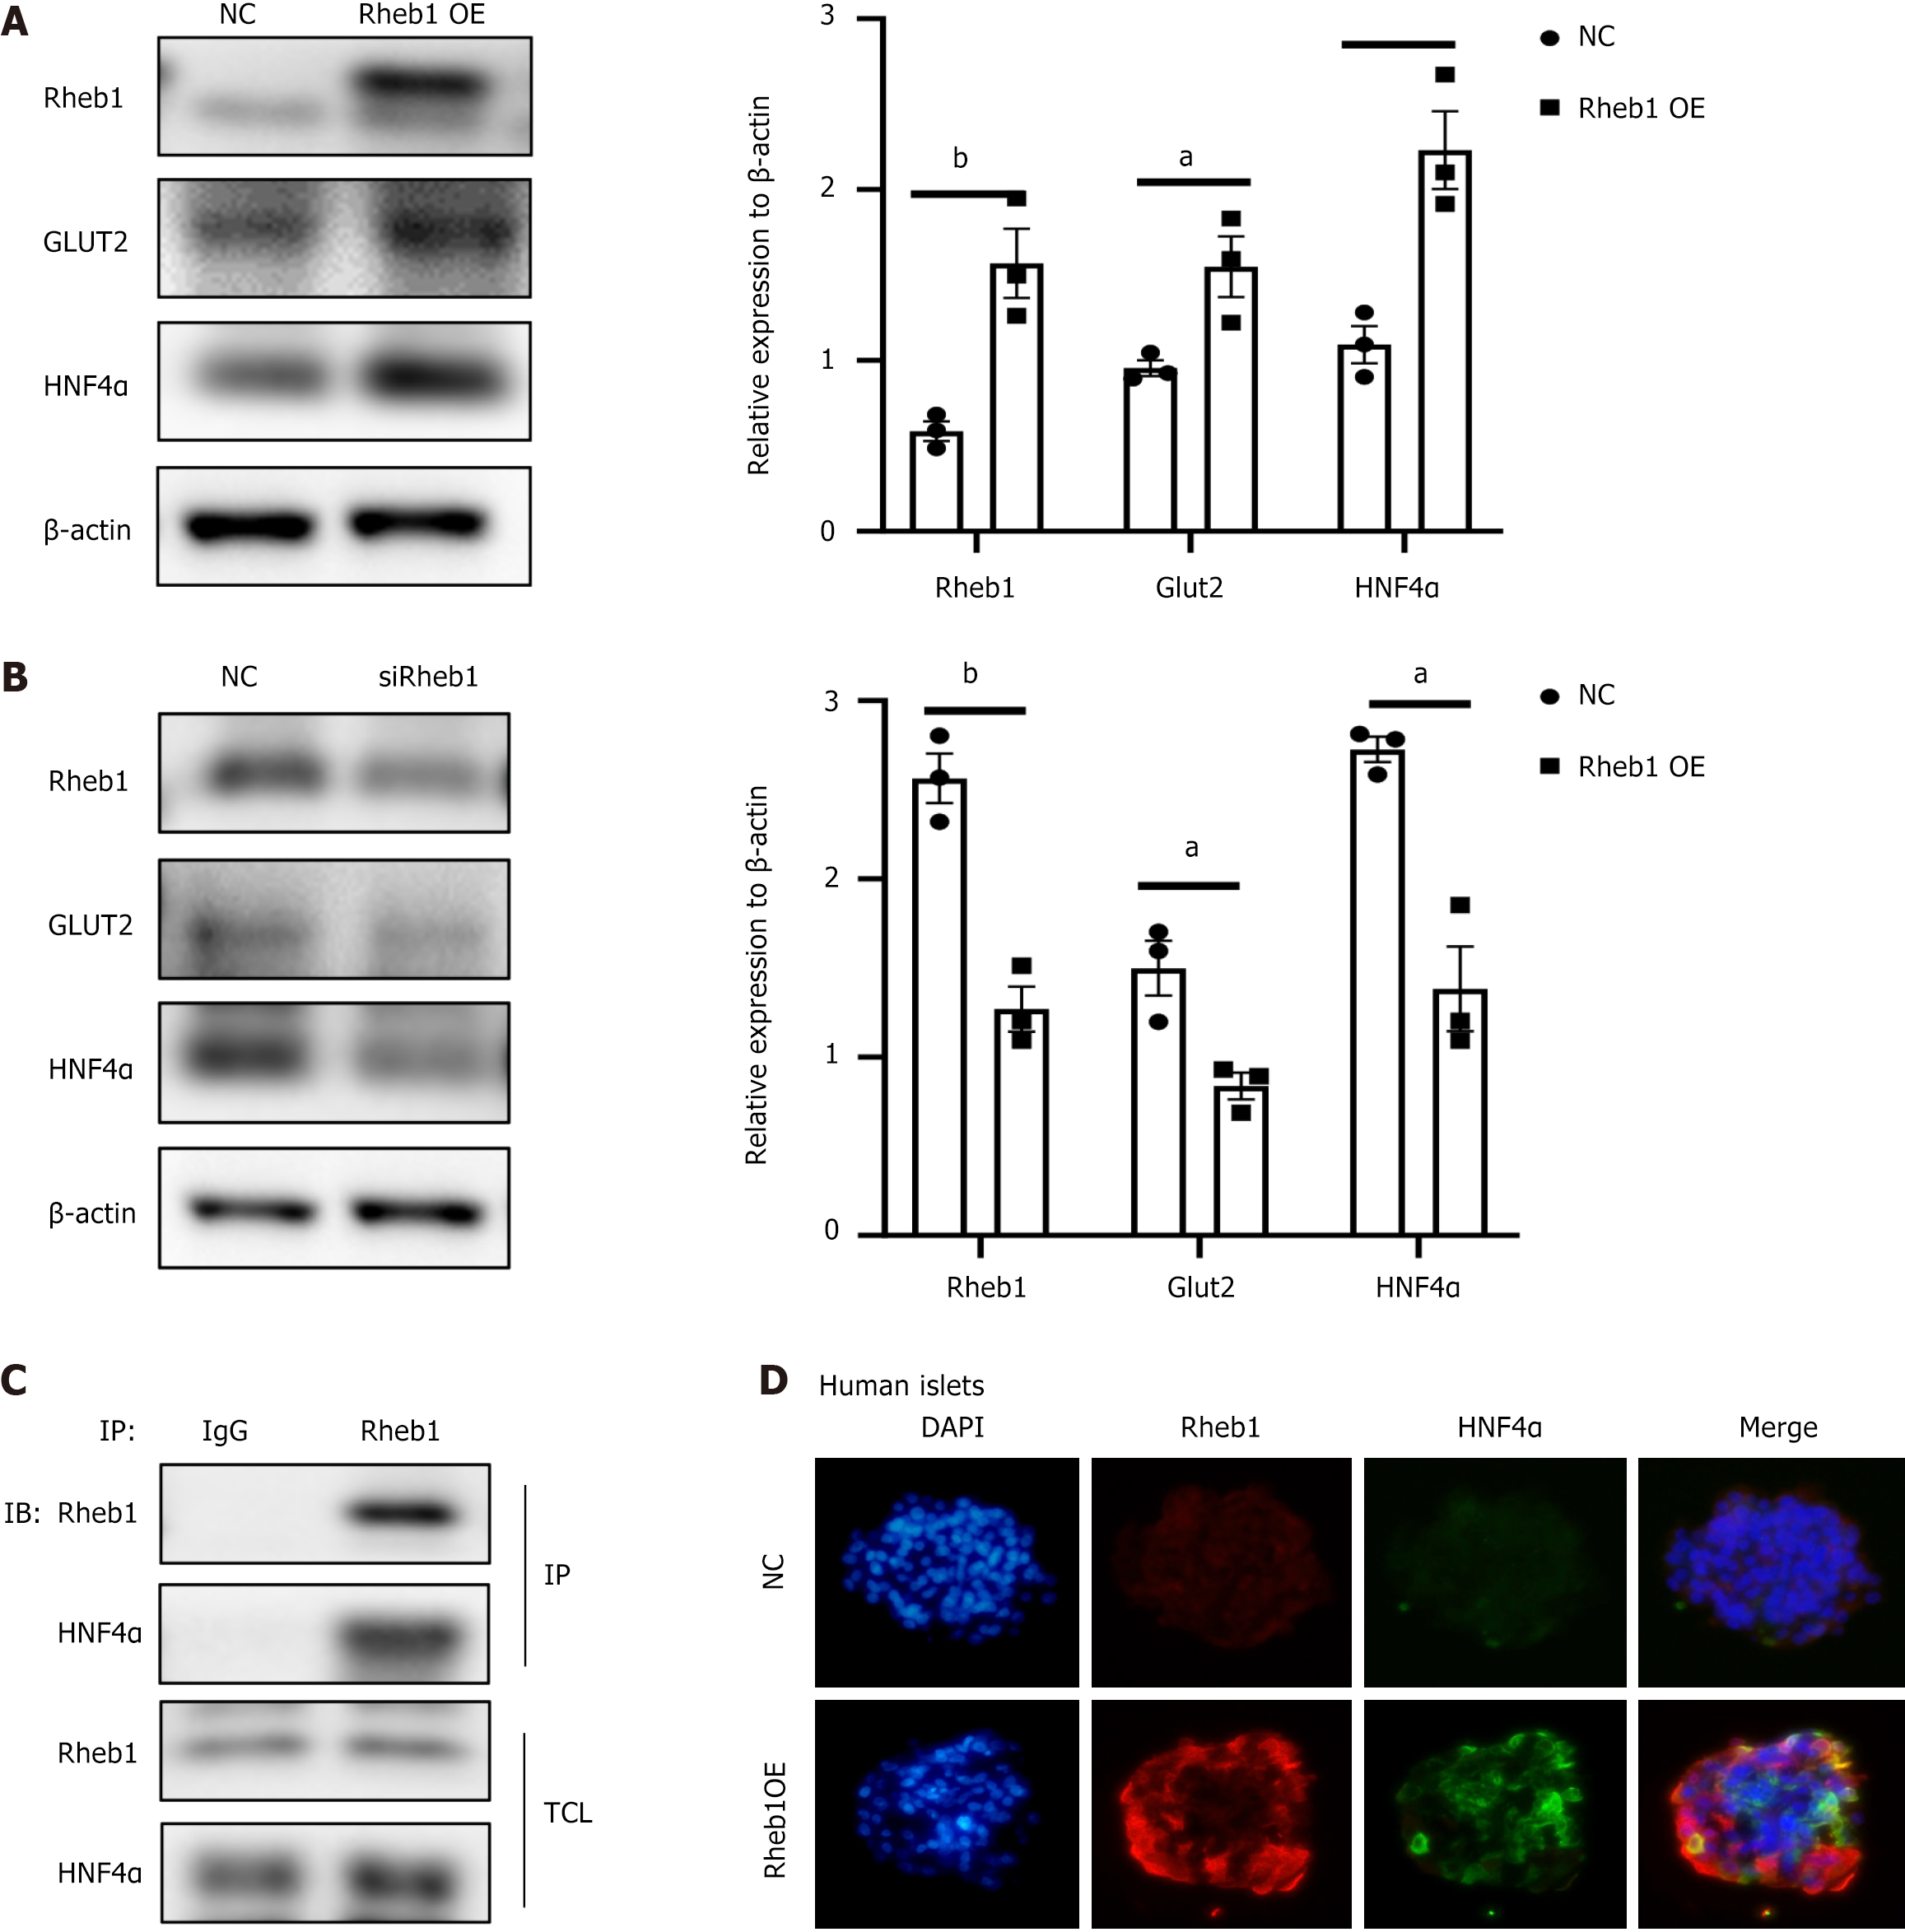
Figure 6 Rheb1 regulates transcription factor HNF4α.
A: Protein expression level of HNF4α was increased in Rheb1 overexpressed MIN6 cells (n = 3); B: Protein expression level of HNF4α was decreased in Rheb1 knockout MIN6 cells; C: The interaction between Rheb1 and HNF4α were analyzed by co-IP in MIN6 cells; D: After overexpression Rheb1 in human islets for 48 hours, immunofluorescence staining of Rheb1 and HNF4α in human islets. All data are represented as the mean ± SD, aP < 0.05, bP < 0.01. NC: Negative control.
- Citation: Yang Y, Song WJ, Zhang JJ. Ras homolog enriched in brain 1 regulates β cell mass and β cell function via mTORC1/AMPK/Notch1 pathways. World J Diabetes 2025; 16(6): 104973
- URL: https://www.wjgnet.com/1948-9358/full/v16/i6/104973.htm
- DOI: https://dx.doi.org/10.4239/wjd.v16.i6.104973


