Copyright
©The Author(s) 2025.
World J Diabetes. Jun 15, 2025; 16(6): 103520
Published online Jun 15, 2025. doi: 10.4239/wjd.v16.i6.103520
Published online Jun 15, 2025. doi: 10.4239/wjd.v16.i6.103520
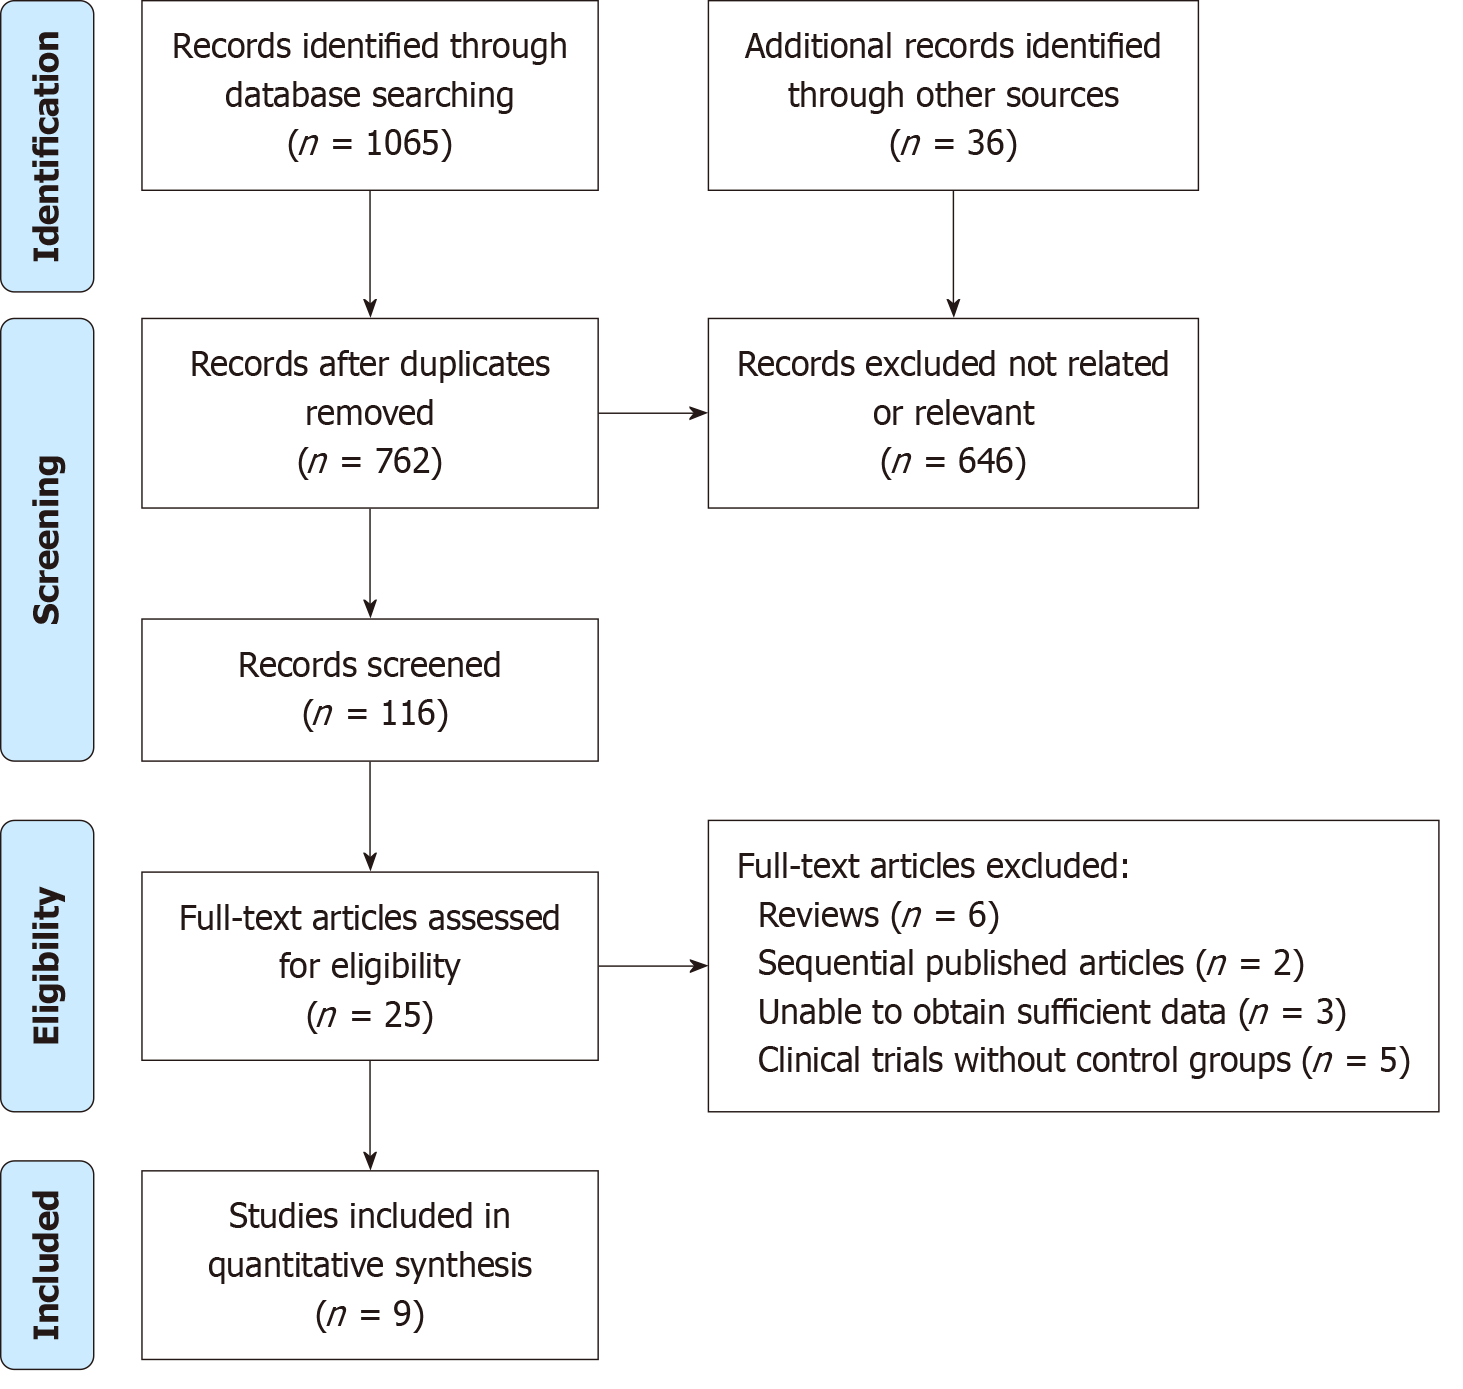
Figure 1
Selection process of included studies.
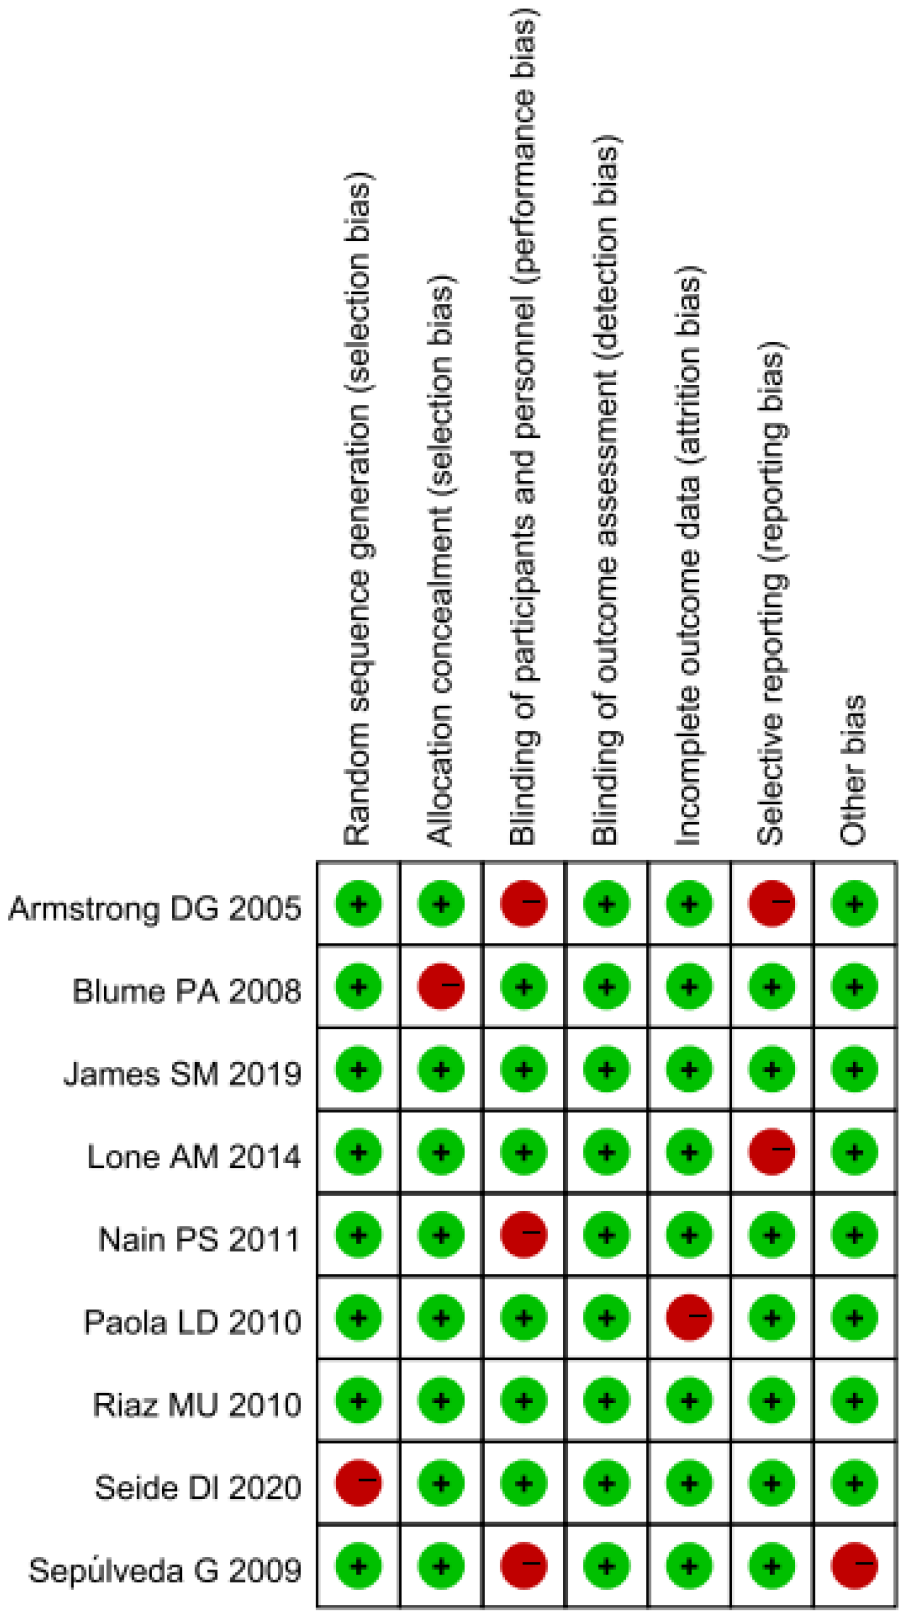
Figure 2 Quality assessment of included studies using Cochrane Collaboration's tool criteria.
Red in figure indicates high risk, and green means low risk.
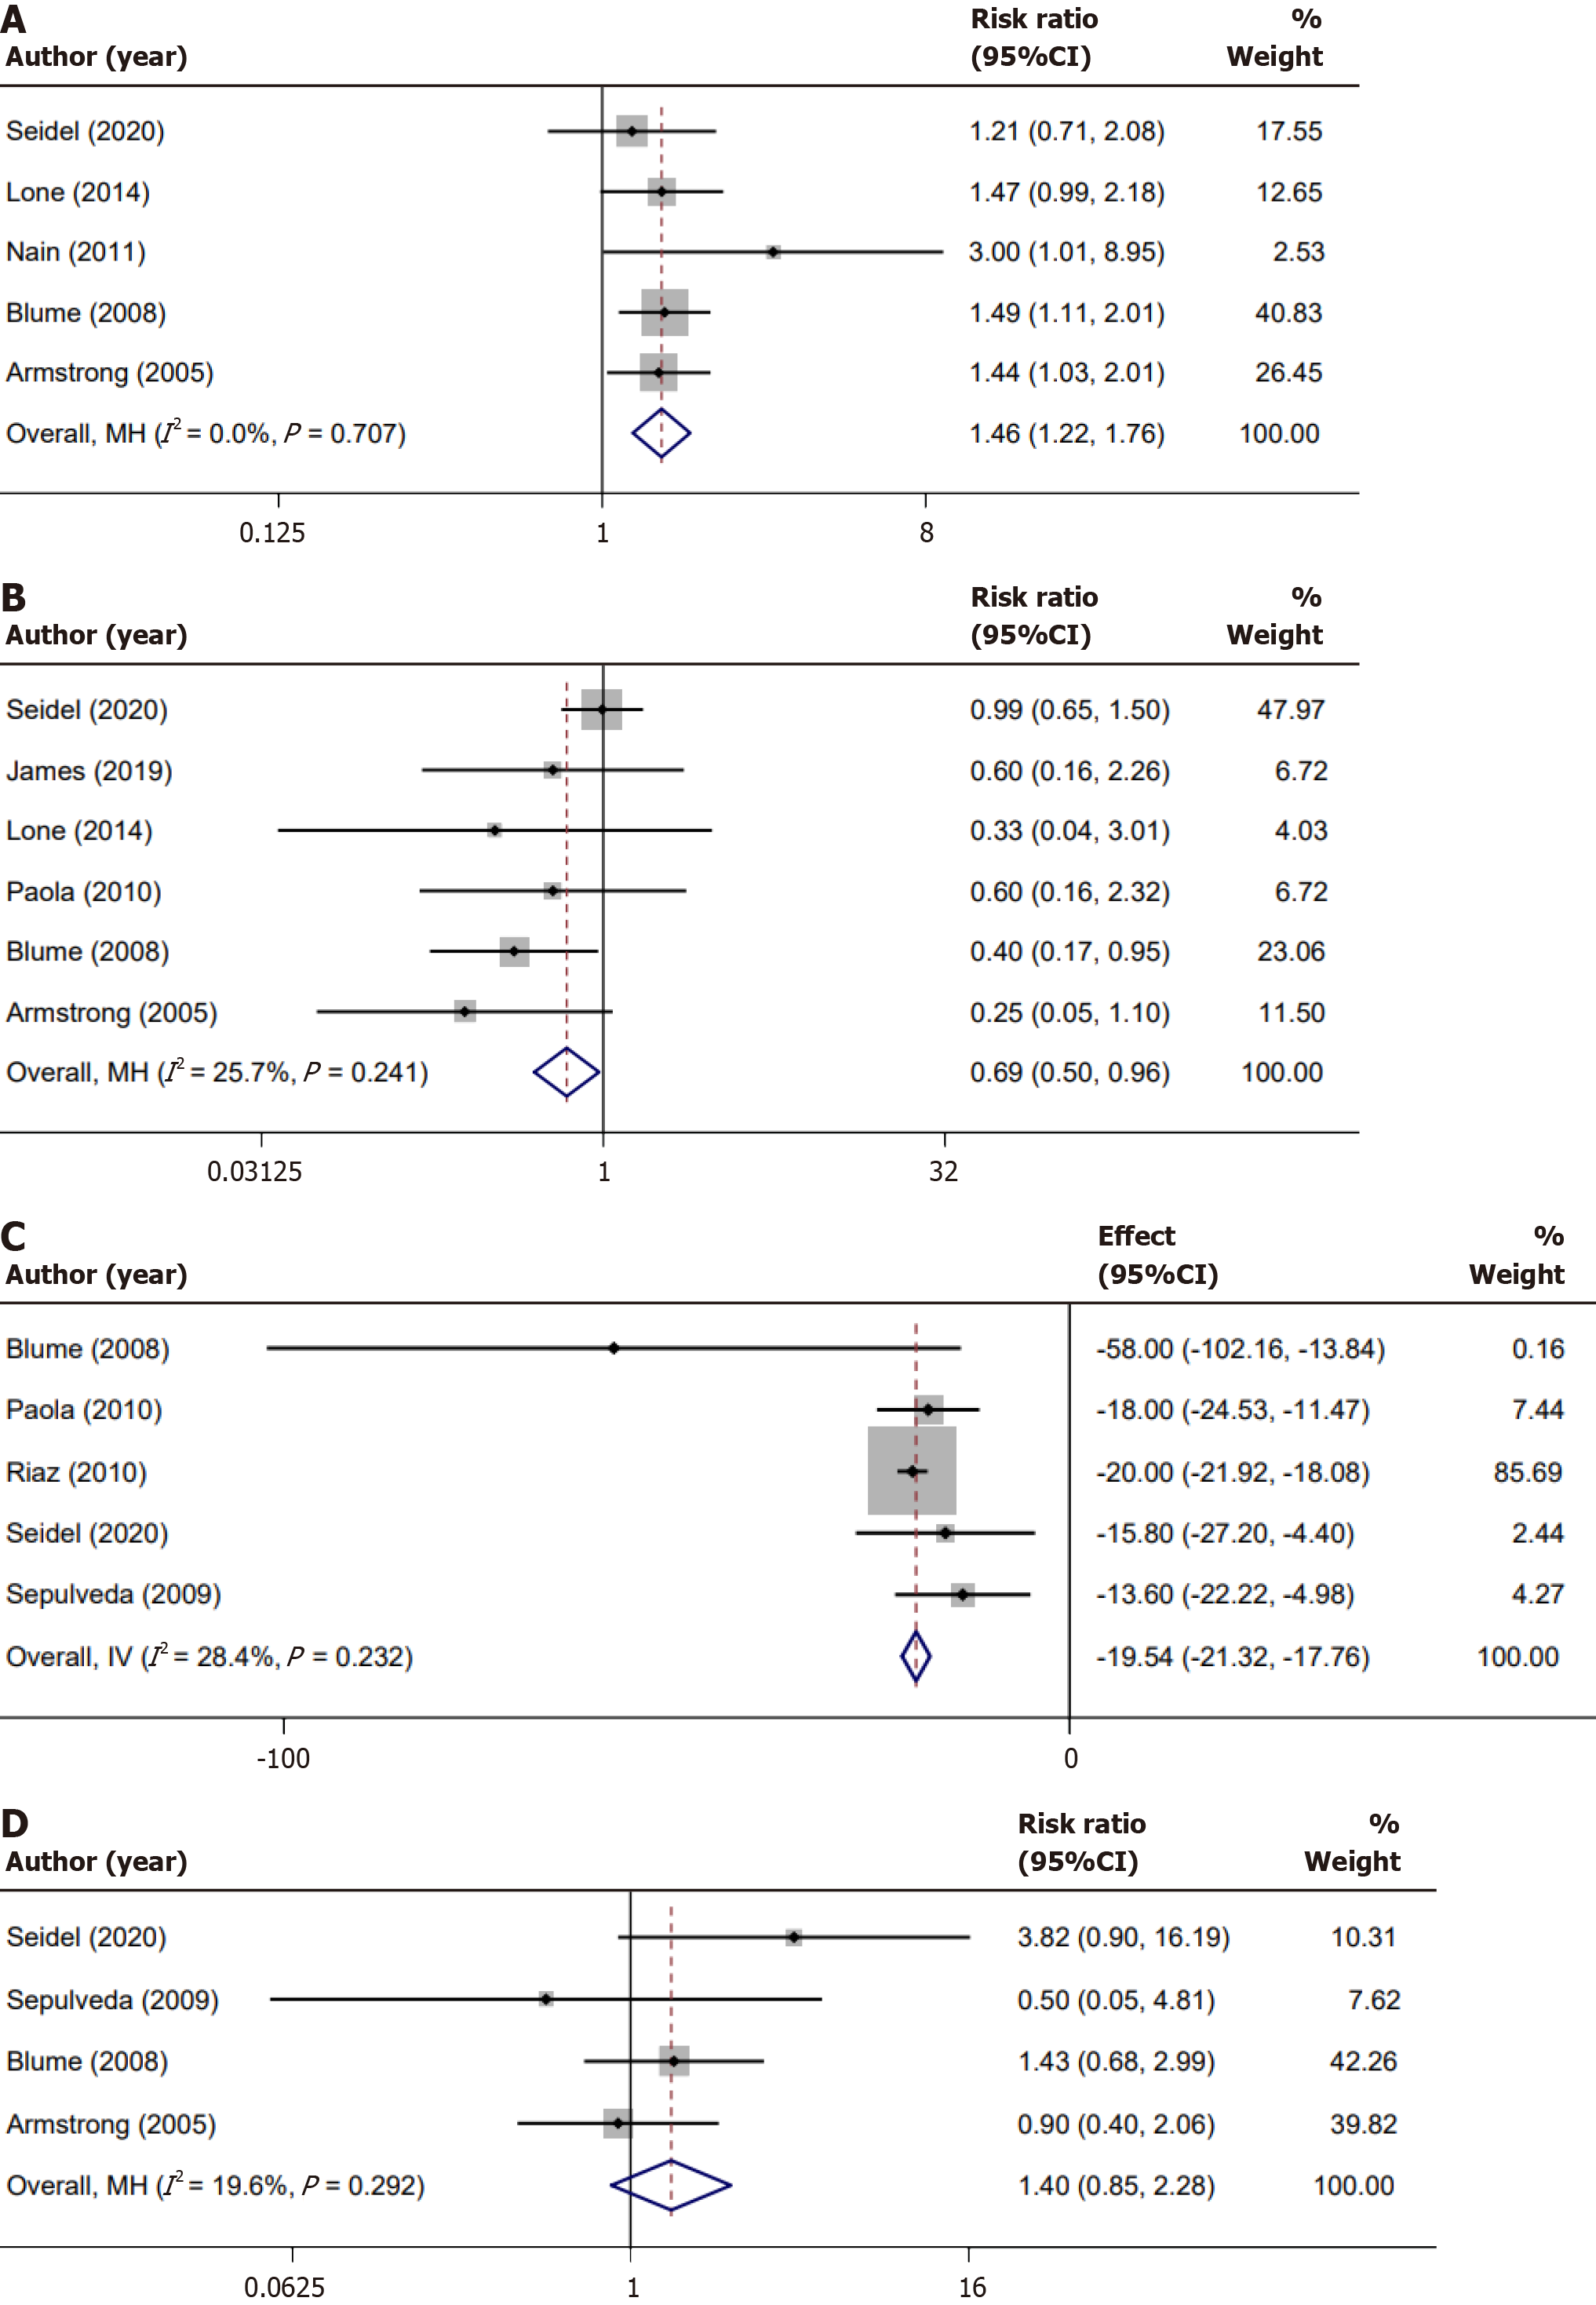
Figure 3 Forest plots.
A: The wound healing rate; B: The amputation rate; C: The 90% granulation tissue formation time; D: The adverse event incidence rate.
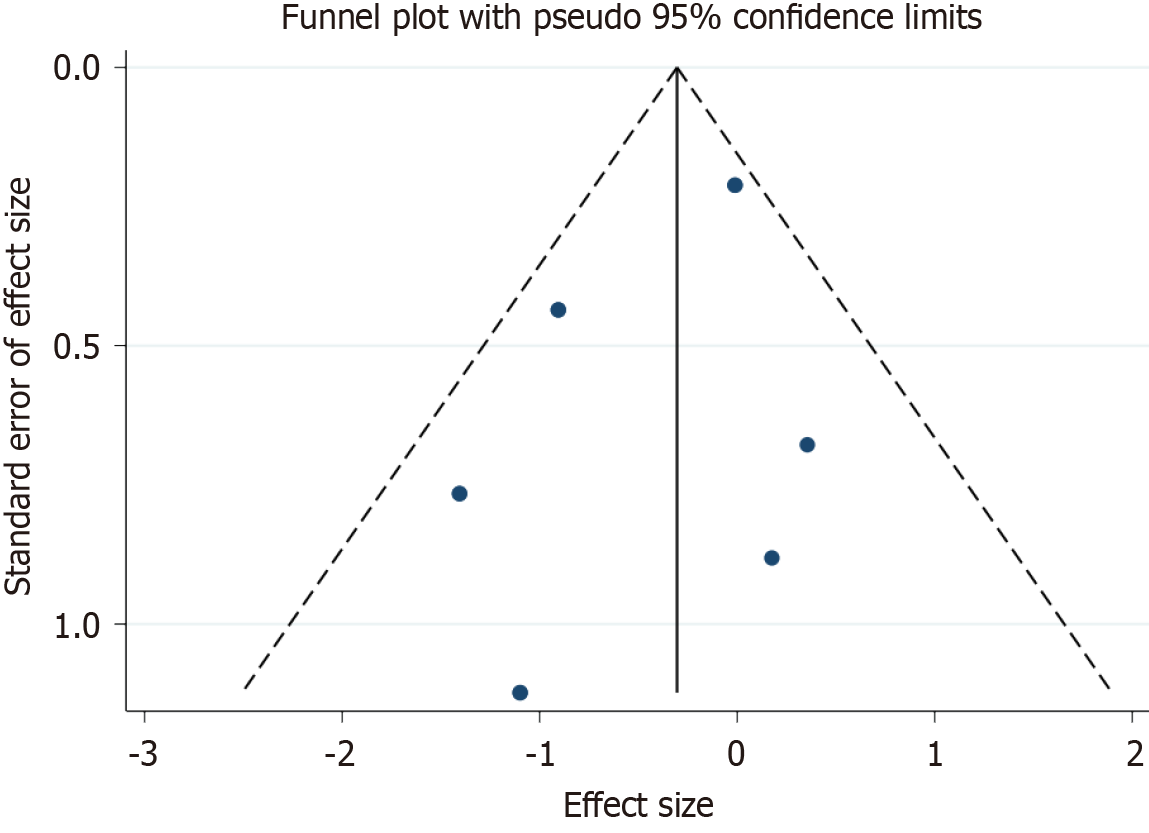
Figure 4
Funnel plot for publication bias in all included studies.
- Citation: Deng YX, Wang XC, Xia ZY, Wan MY, Jiang DY. Efficacy and safety of negative pressure wound therapy for the treatment of diabetic foot ulcers: A meta-analysis. World J Diabetes 2025; 16(6): 103520
- URL: https://www.wjgnet.com/1948-9358/full/v16/i6/103520.htm
- DOI: https://dx.doi.org/10.4239/wjd.v16.i6.103520


