Copyright
©The Author(s) 2025.
World J Diabetes. May 15, 2025; 16(5): 91200
Published online May 15, 2025. doi: 10.4239/wjd.v16.i5.91200
Published online May 15, 2025. doi: 10.4239/wjd.v16.i5.91200
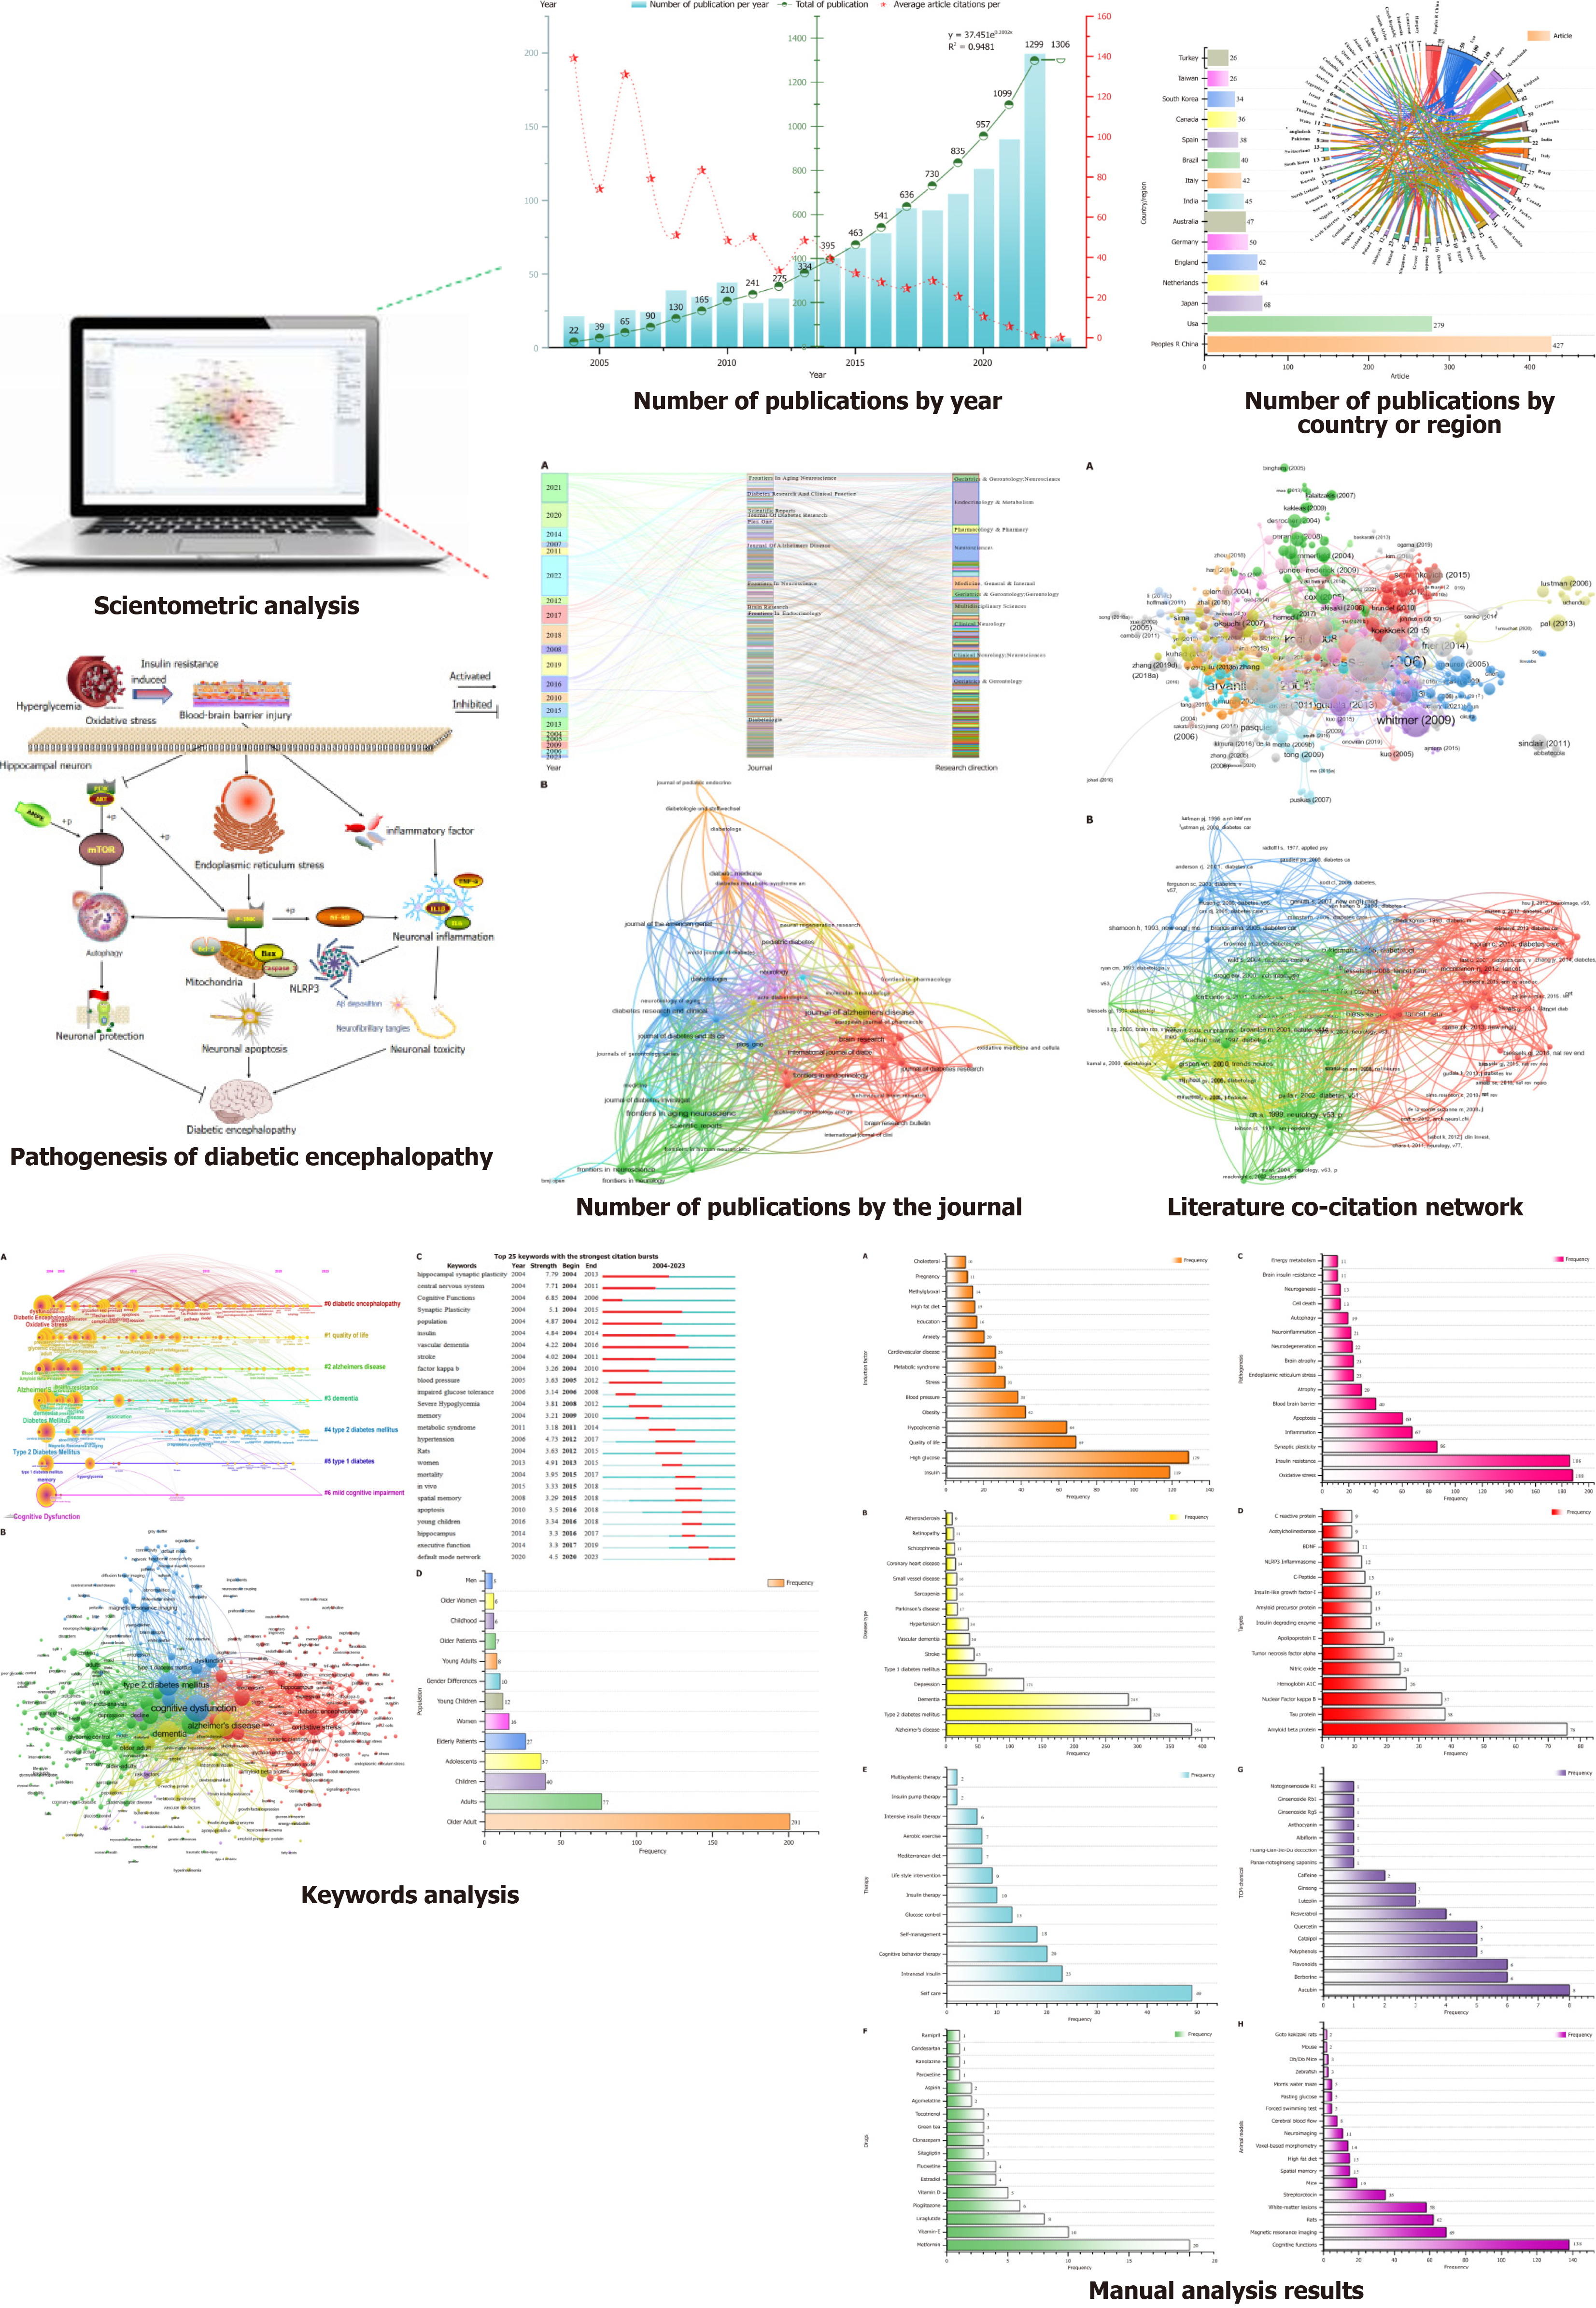
Figure 1 Flow chart of the study of diabetic encephalopathy.
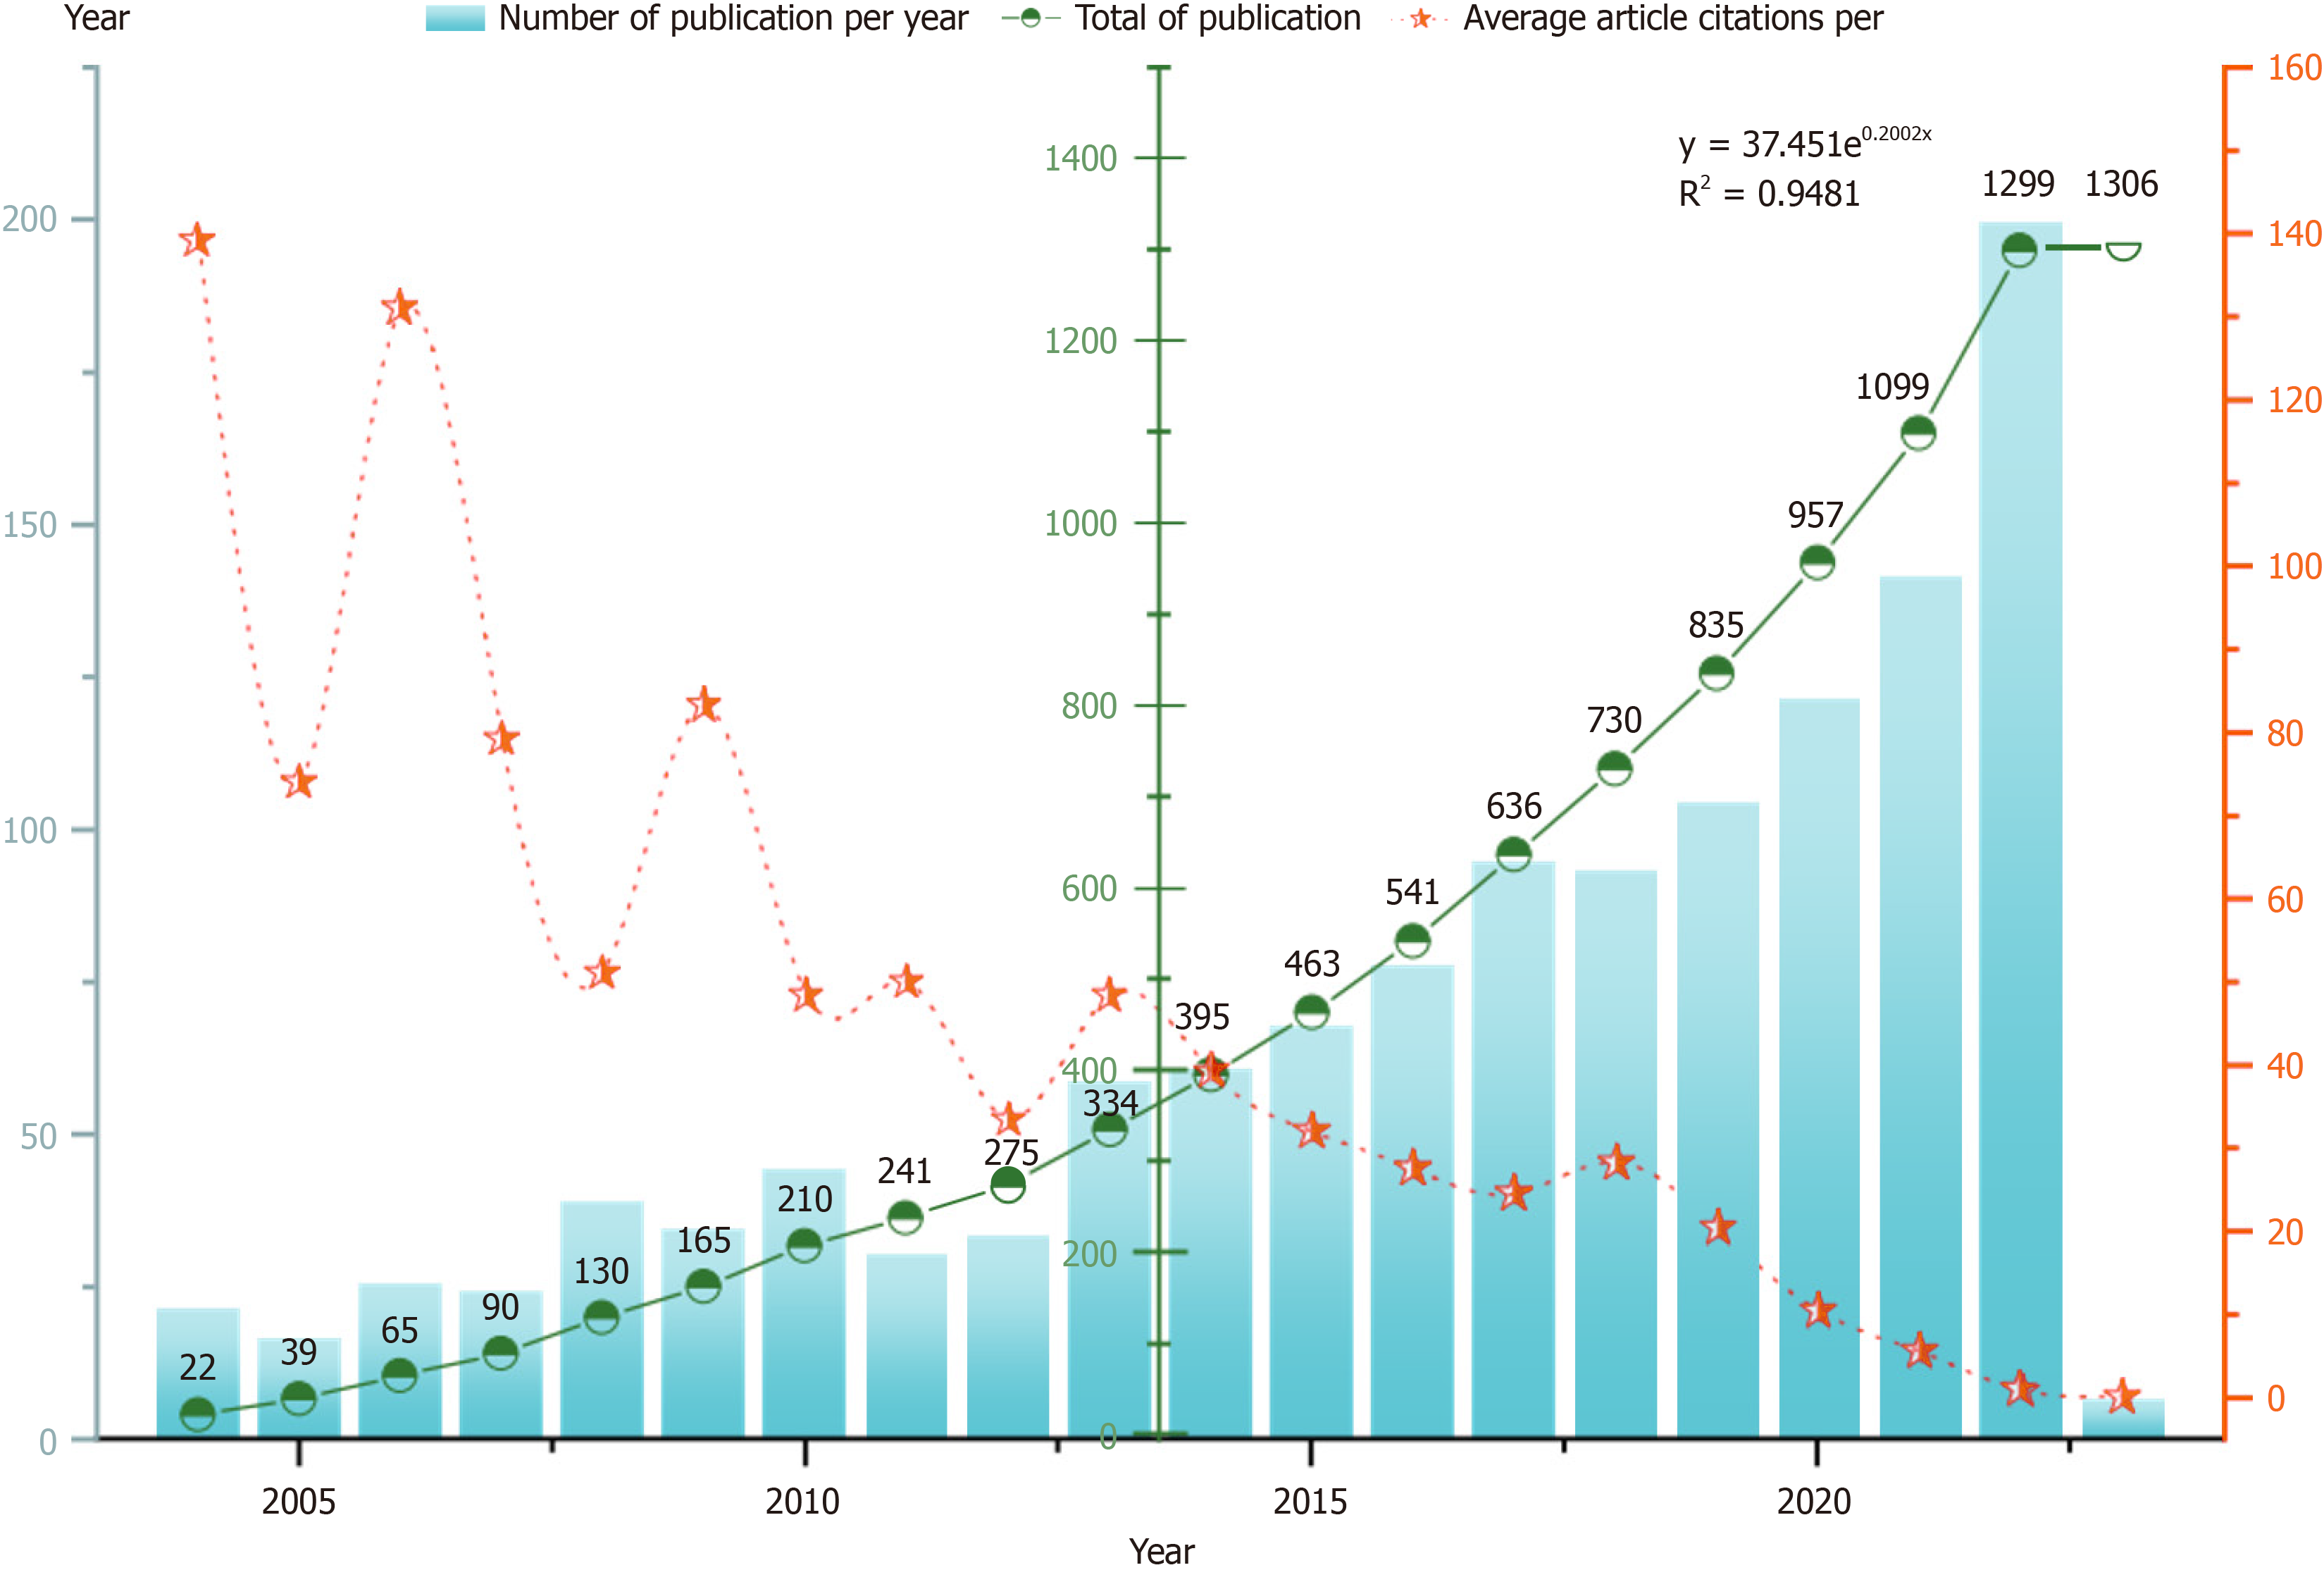
Figure 2 Number of publications by year and gerontology.
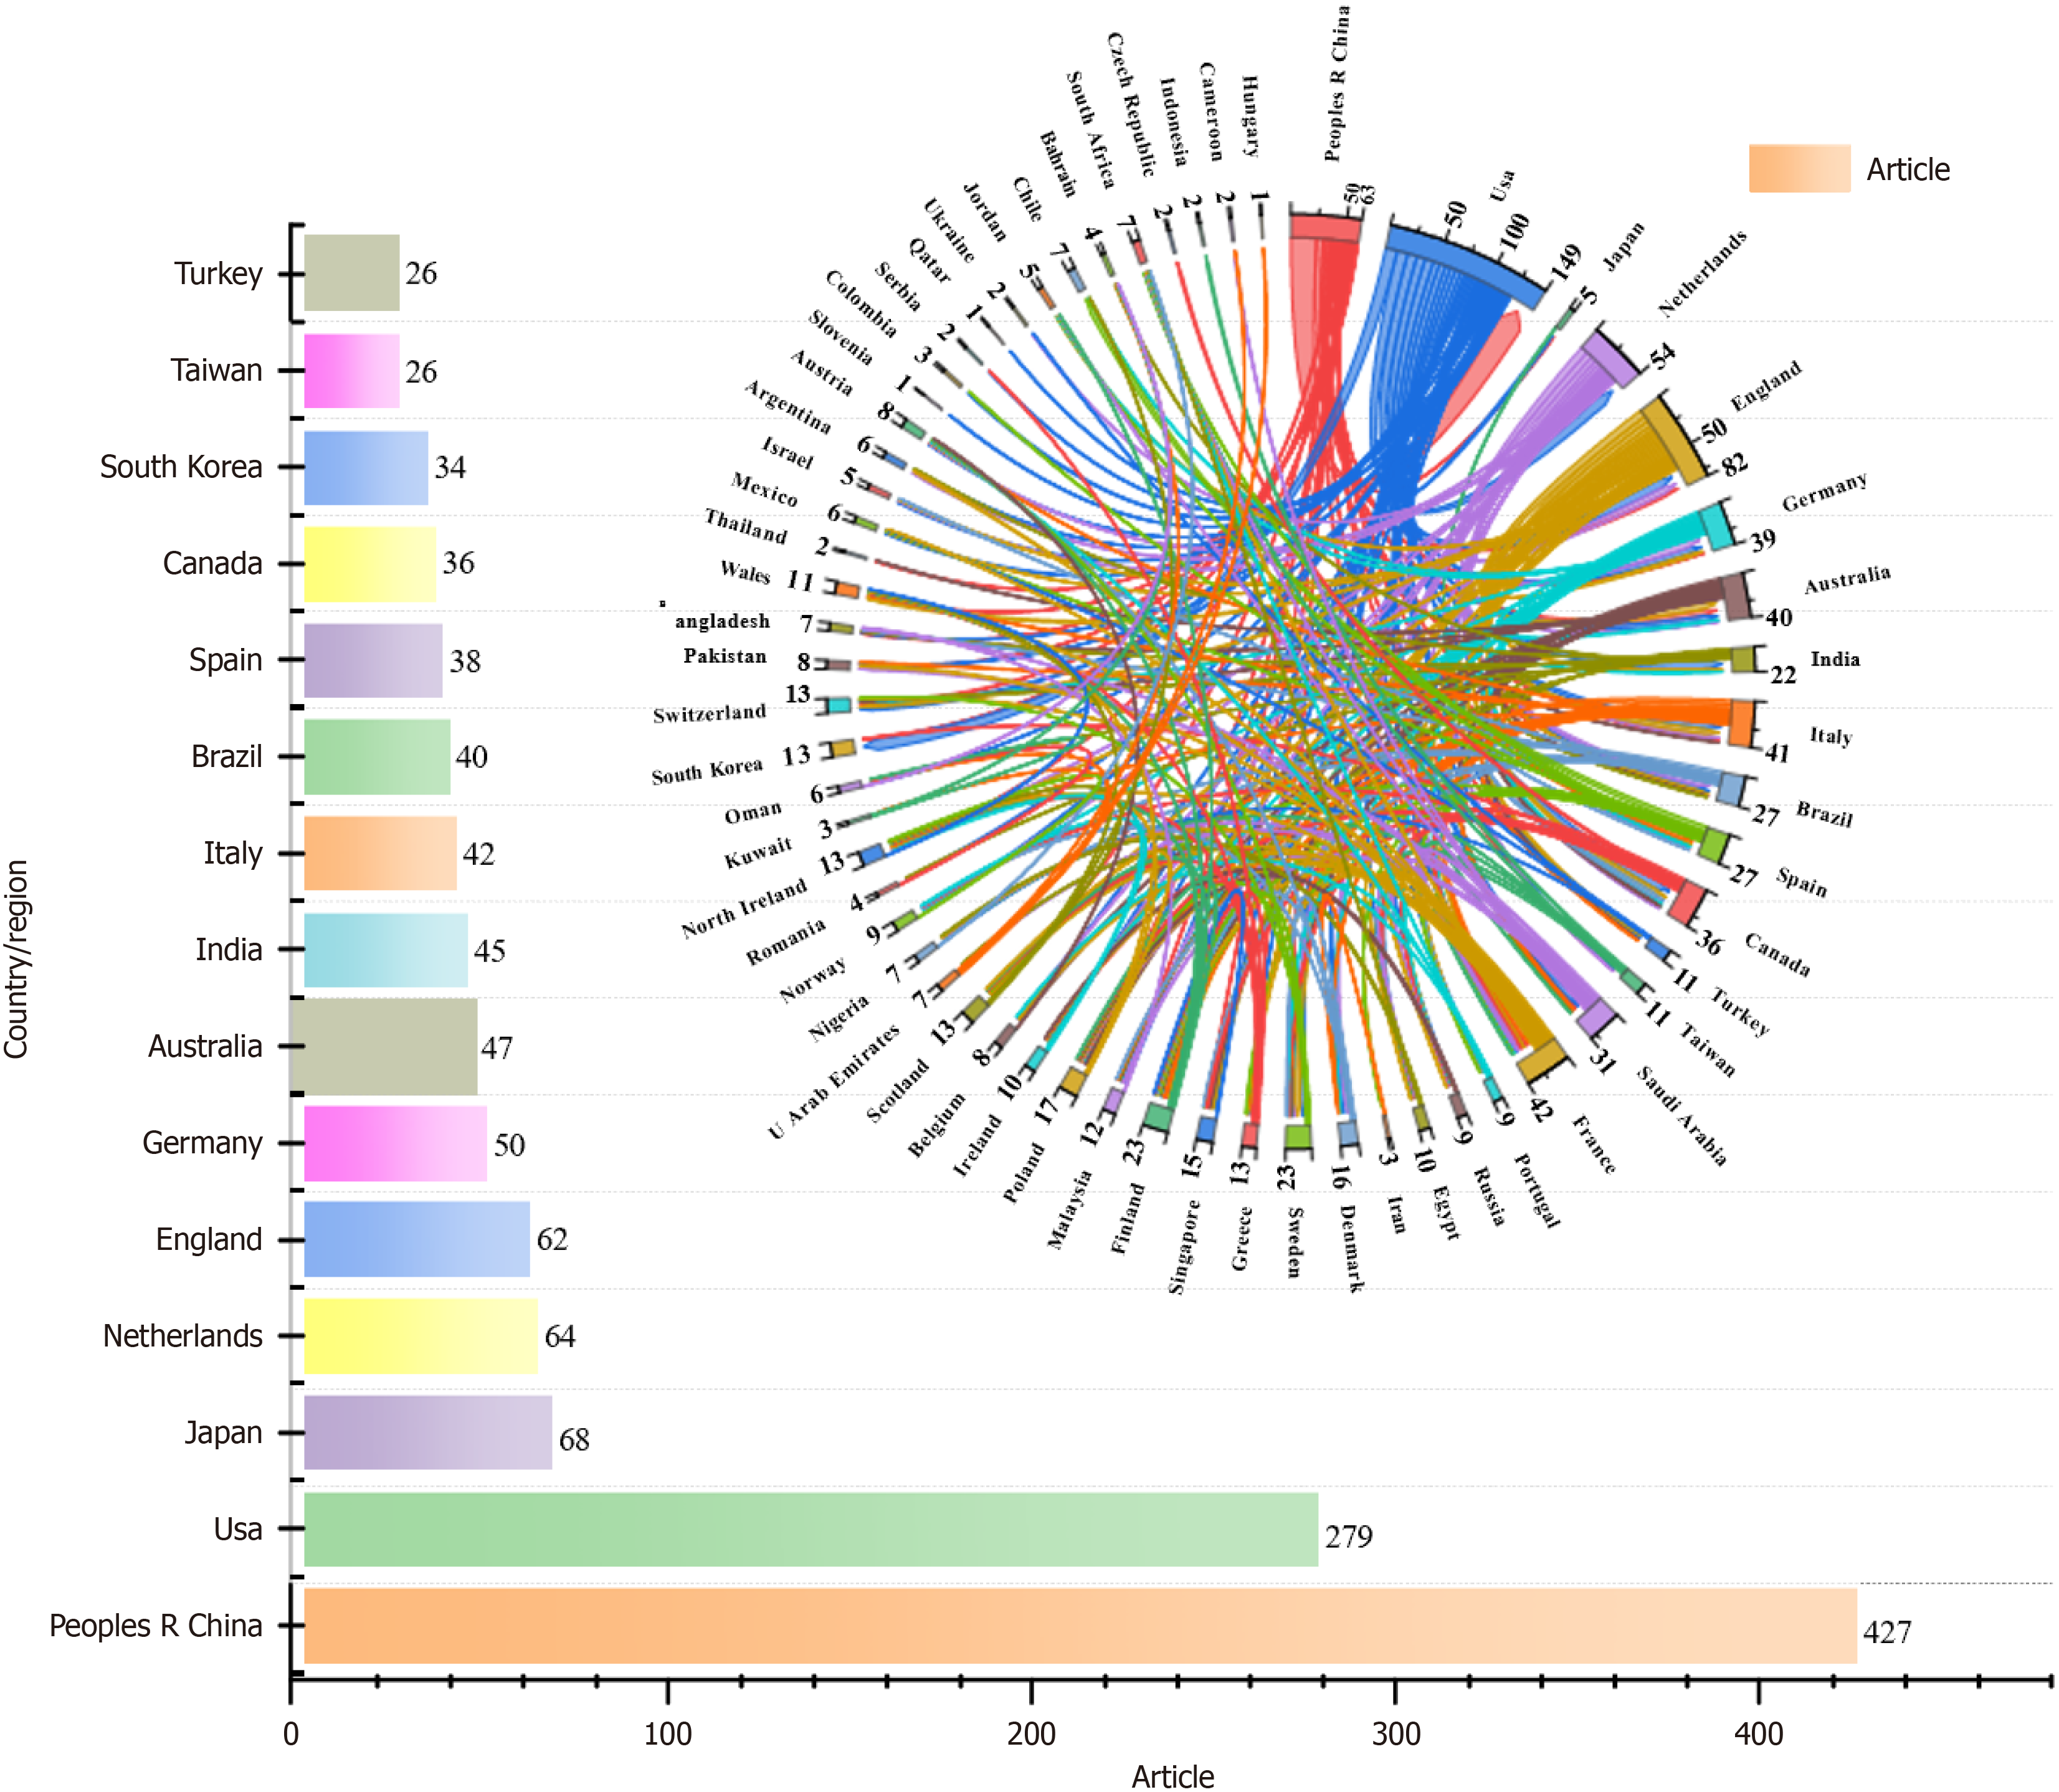
Figure 3 Country/region analysis.
Number of publications by country or region, and cooperative relationships among countries or regions.
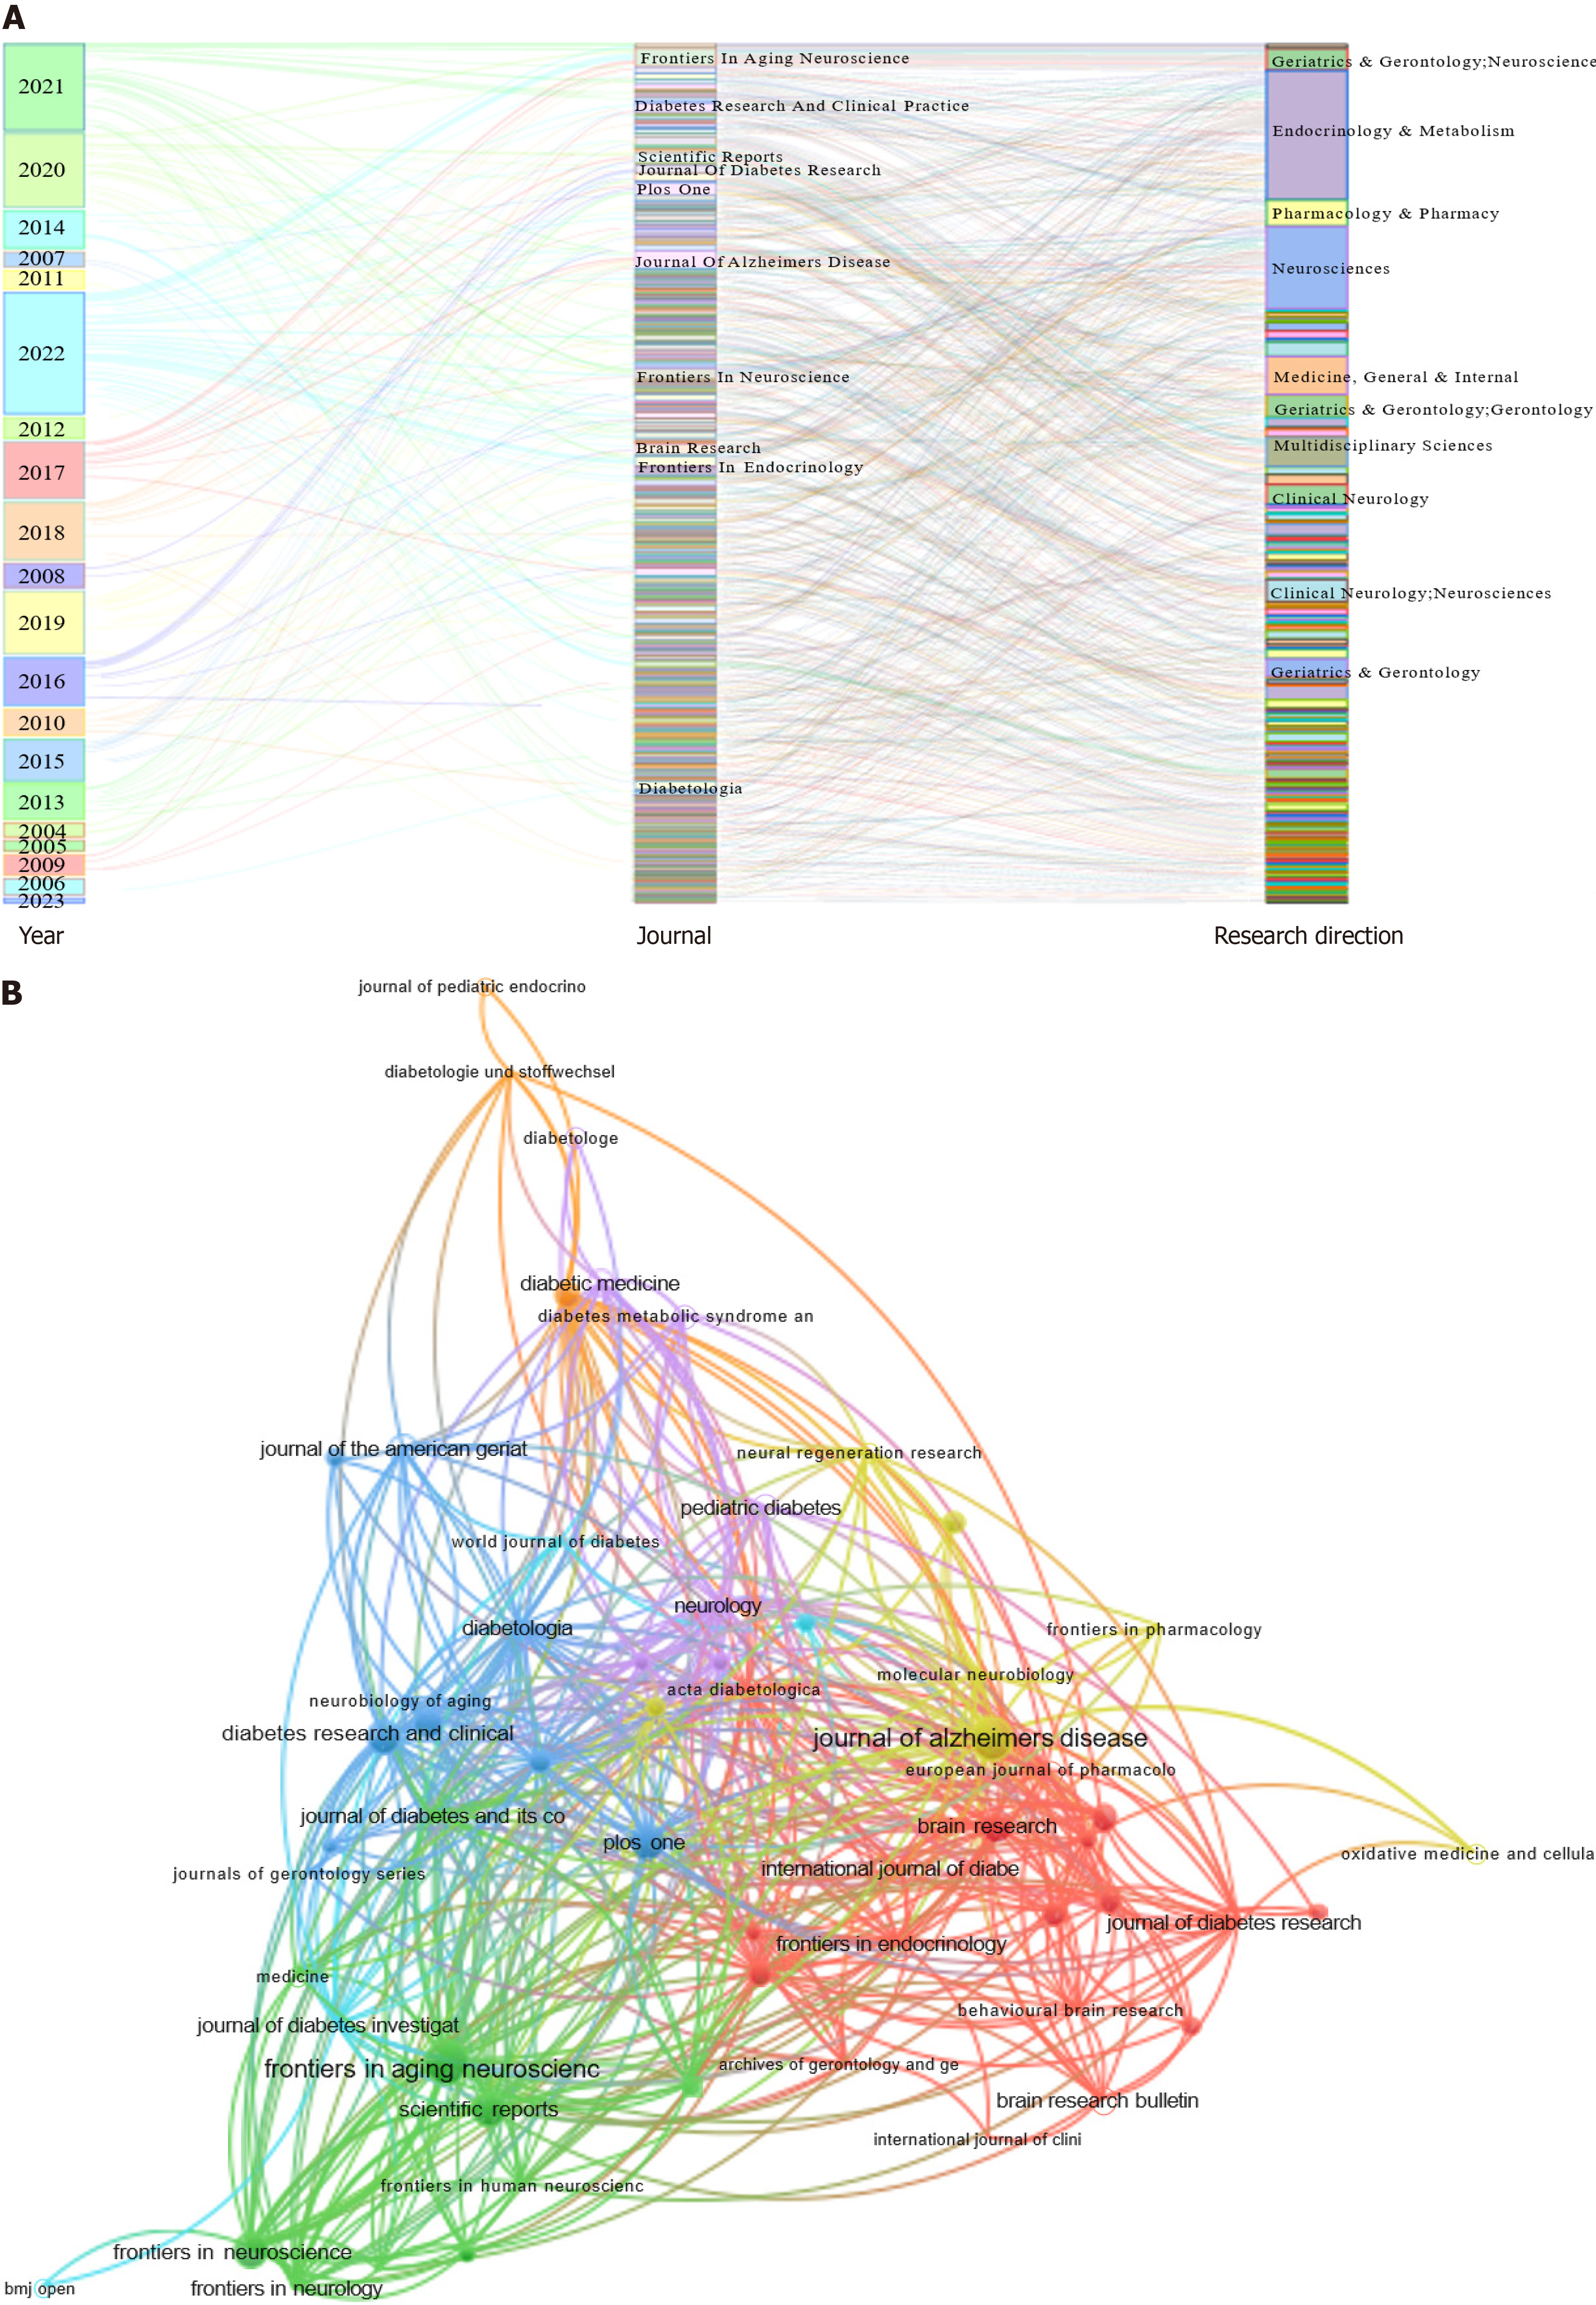
Figure 4 Journal analysis.
A: Articles related to diabetic encephalopathy published in a different journal; B: Research on mutual citations of journals.
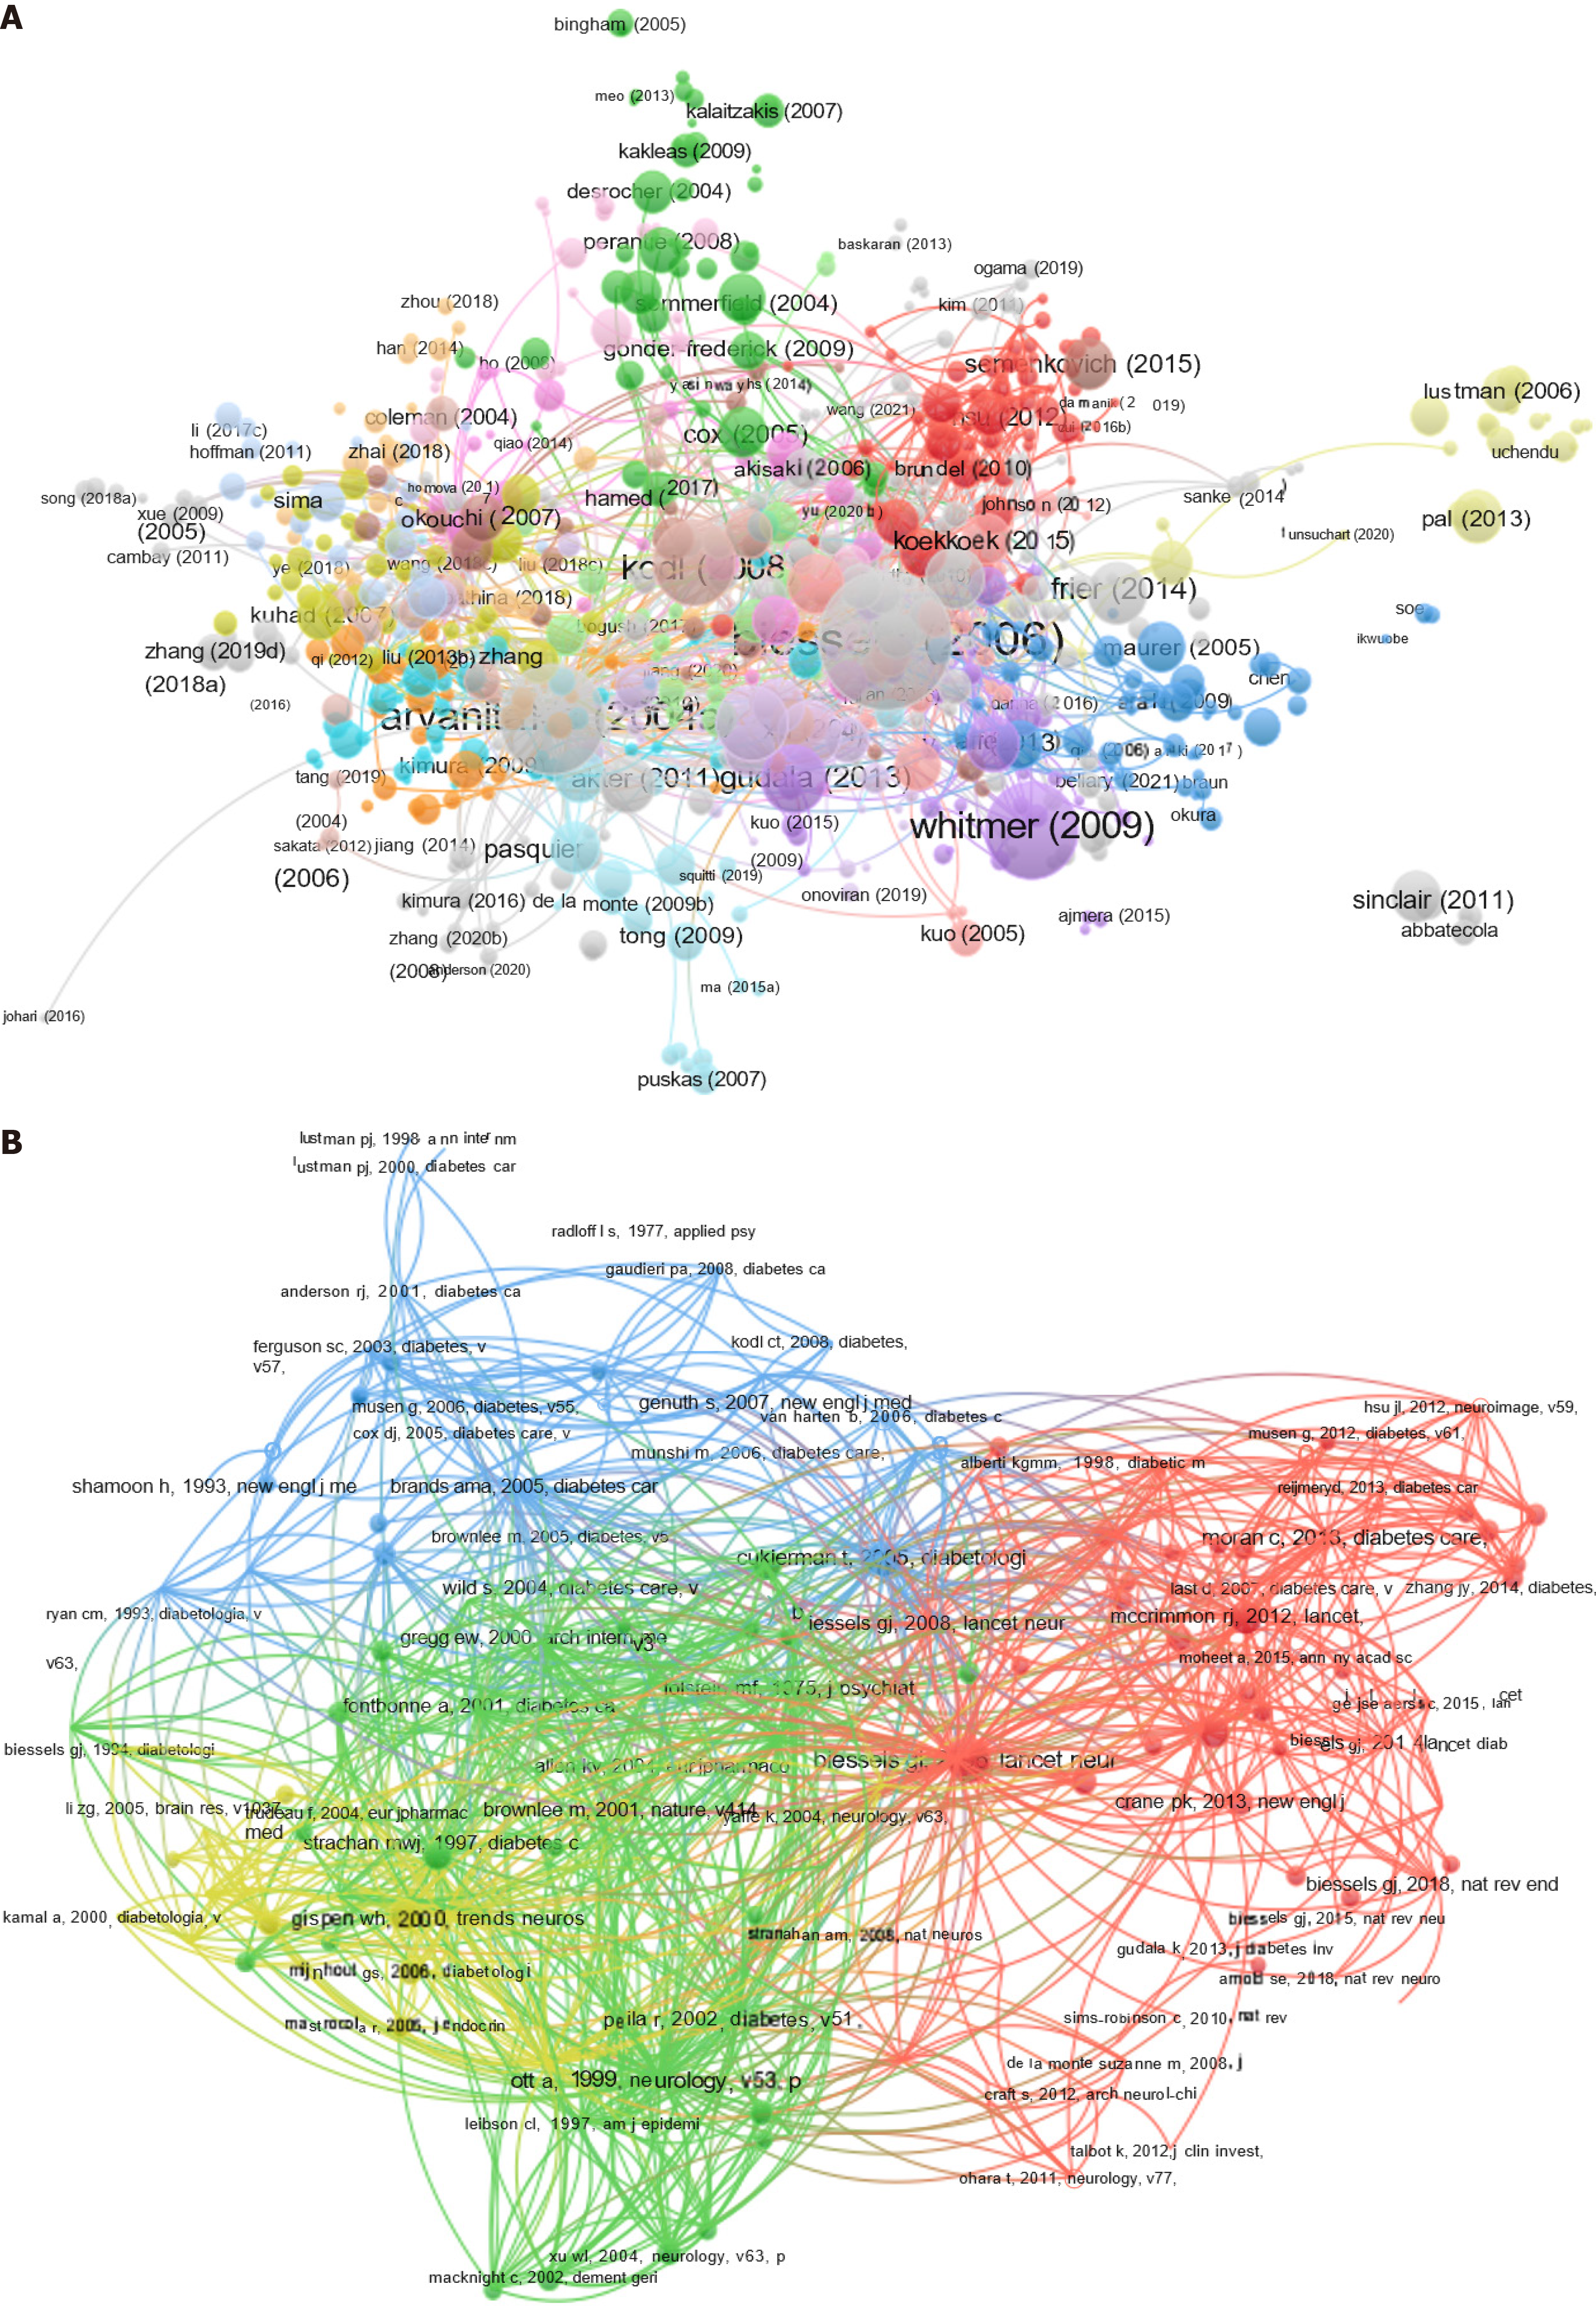
Figure 5 Literature and cited references analysis.
A: Literature citation network; B: Reference citation network.
Figure 6 Keyword analysis.
A: Keyword timeline view; B: Keyword co-occurrence network; C: Top 25 keywords with the strongest citation bursts; D: Population distribution.
Figure 7 Manual analysis results.
A: Induction factor; B: Disease type; C: Disease mechanism; D: Disease targets; E: Disease therapy; F: Disease drugs; G: Traditional Chinese medicine; H: Animal model.
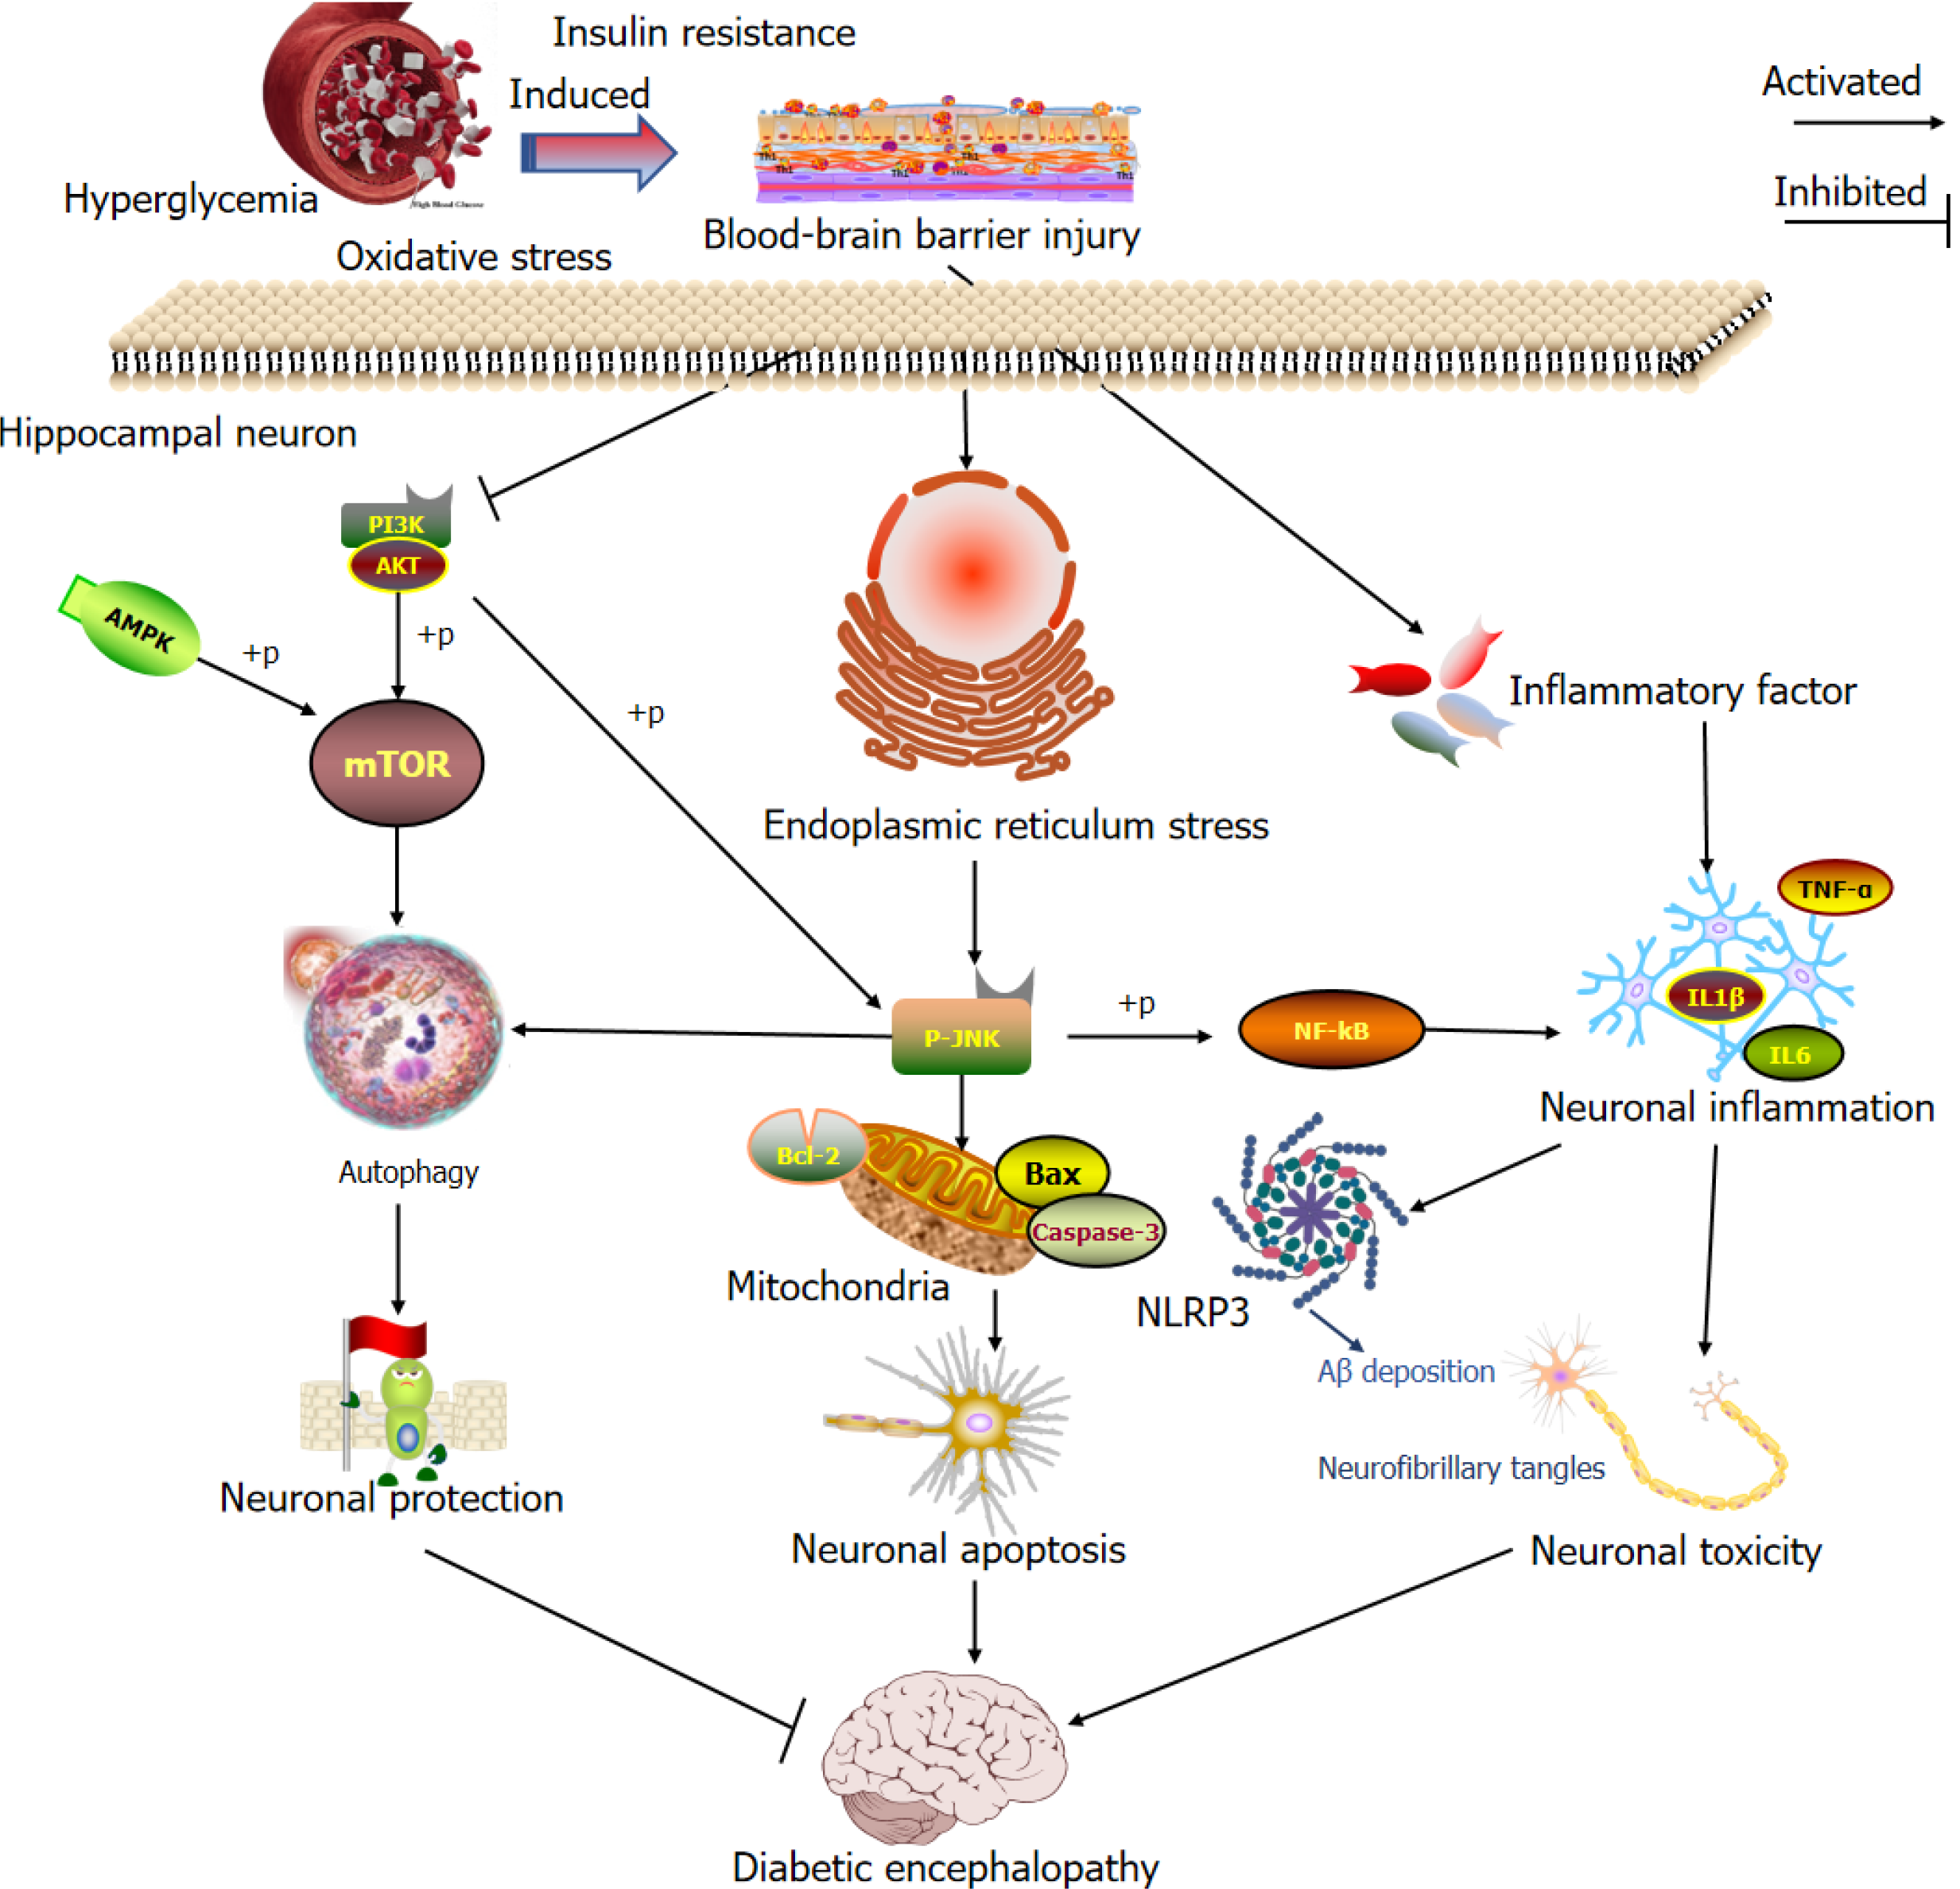
Figure 8 Pathogenesis of diabetic encephalopathy.
PI3K: Phosphatidylinositol 3-kinase; AMPK: Adenosine monophosphate-activated protein kinase; mTOR: Mechanistic target of rapamycin; Bcl-2: B cell leukemia/lymphoma 2; Bax: B cell leukemia/lymphoma 2-associated X; NLRP3: NLR family pyrin domain containing 3; IL: Interleukin; TNF-α: Tumor necrosis factor α.
- Citation: Ye XW, Zhang HX, Li Q, Li CS, Zhao CJ, Xia LJ, Ren HM, Wang XX, Yang C, Wang YJ, Jiang SL, Xu XF, Li XR. Scientometric analysis and historical review of diabetic encephalopathy research: Trends and hotspots (2004-2023). World J Diabetes 2025; 16(5): 91200
- URL: https://www.wjgnet.com/1948-9358/full/v16/i5/91200.htm
- DOI: https://dx.doi.org/10.4239/wjd.v16.i5.91200


